

Key Insights
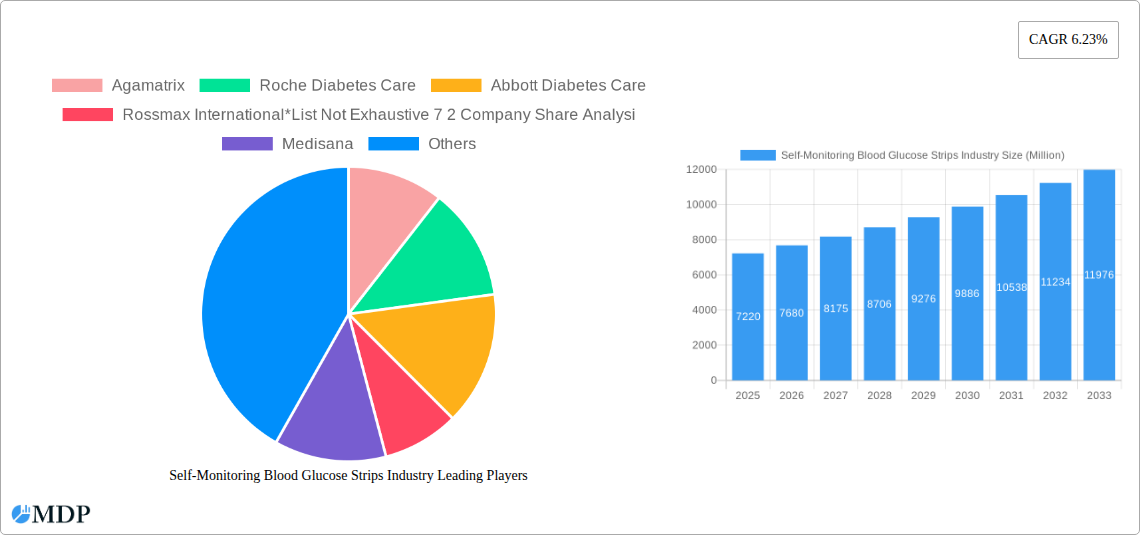
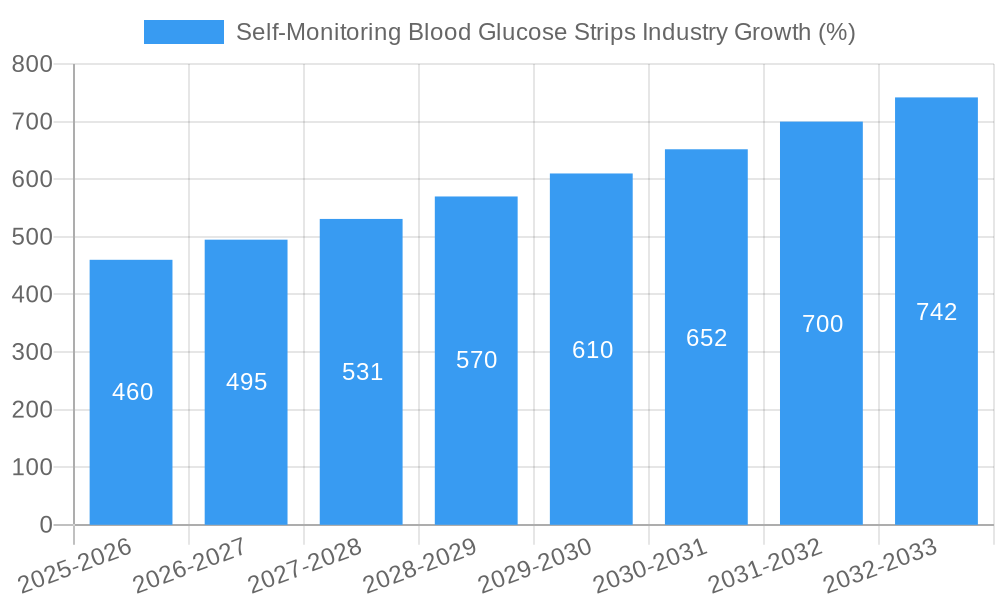
The self-monitoring blood glucose (SMBG) strips market, valued at $7.22 billion in 2025, is projected to experience robust growth, driven by the rising prevalence of diabetes globally and an increasing demand for convenient and accurate blood glucose monitoring. The market's Compound Annual Growth Rate (CAGR) of 6.23% from 2025 to 2033 indicates a significant expansion, fueled by technological advancements leading to smaller, more user-friendly devices and strips. Key market segments include glucometer devices, test strips, and lancets, with test strips representing a substantial portion of the market value due to their consumable nature. Leading players such as Abbott Diabetes Care, Roche Diabetes Care, and LifeScan are continuously innovating to improve accuracy, reduce costs, and enhance the overall patient experience. Geographic analysis suggests a strong market presence in North America and Europe, driven by high diabetes prevalence and established healthcare infrastructure. However, rapidly developing economies in Asia Pacific and other regions present significant growth opportunities due to expanding access to healthcare and rising awareness about diabetes management. Market restraints include the potential for inaccuracies in home testing, high costs associated with regular testing, and the emergence of alternative monitoring technologies like continuous glucose monitoring (CGM) systems. Despite these challenges, the market is expected to maintain a steady growth trajectory driven by the increasing diabetic population and the critical role SMBG plays in diabetes management.
The SMBG strips market's future growth will hinge on several factors. Continued innovation in strip technology to enhance accuracy and convenience will remain crucial. Furthermore, strategic partnerships between manufacturers and healthcare providers to improve patient access and education are key. The competitive landscape will also shape market dynamics, with companies investing in research and development to differentiate their products and cater to the evolving needs of patients and healthcare professionals. Successful market penetration in developing regions will be contingent upon addressing affordability concerns and improving healthcare infrastructure. The integration of SMBG with digital health platforms and remote patient monitoring solutions will also drive market expansion by enhancing data analysis and patient engagement. Ultimately, the market's success depends on maintaining a balance between technological advancement, affordability, and accessibility to enable effective diabetes management worldwide.
Self-Monitoring Blood Glucose Strips Industry Report: 2019-2033
This comprehensive report provides a detailed analysis of the Self-Monitoring Blood Glucose Strips industry, offering invaluable insights for stakeholders, investors, and industry professionals. Covering the period 2019-2033, with a focus on 2025, this report meticulously examines market dynamics, trends, leading players, and future opportunities within this vital healthcare sector. The report leverages extensive data analysis to forecast robust growth and pinpoint key areas for strategic investment.
Self-Monitoring Blood Glucose Strips Industry Market Dynamics & Concentration
The self-monitoring blood glucose strips market is characterized by moderate concentration, with key players like Agamatrix, Roche Diabetes Care, Abbott Diabetes Care, Rossmax International, Medisana, Acon, Bionime Corporation, Arkray, LifeScan, and Ascensia Diabetes Care holding significant market share. However, the market also features several smaller players, contributing to a dynamic competitive landscape. The industry is driven by continuous innovation in glucose monitoring technology, aiming for improved accuracy, convenience, and integration with digital health platforms. Regulatory frameworks, particularly those related to device approvals and reimbursement policies, significantly impact market growth. The presence of substitute technologies, albeit limited, adds another layer of complexity. End-user trends, including the increasing preference for home-based testing and remote monitoring, are reshaping the market. Mergers and acquisitions (M&A) activity within the industry remains relatively modest, with approximately xx M&A deals recorded during the study period (2019-2024). Company share analysis reveals that the top 7 companies account for approximately 72% of the market share in 2025.
- Market Concentration: Moderate, with top 7 players controlling 72% of the market in 2025.
- Innovation Drivers: Improved accuracy, convenience, integration with digital health.
- Regulatory Frameworks: Significant impact on market access and growth.
- Product Substitutes: Limited, but pose a potential threat.
- End-User Trends: Growing preference for home-based testing and remote monitoring.
- M&A Activity: Approximately xx deals between 2019-2024.
Self-Monitoring Blood Glucose Strips Industry Industry Trends & Analysis
The self-monitoring blood glucose strips market exhibits a robust growth trajectory, driven by several key factors. The rising prevalence of diabetes globally is the primary catalyst, fueling the demand for accurate and reliable glucose monitoring solutions. Technological advancements, particularly in the development of continuous glucose monitoring (CGM) systems and integrated mobile applications, are significantly impacting market growth. Consumer preferences are shifting towards smaller, easier-to-use devices, with a growing demand for connected devices that allow for data tracking and remote monitoring. Competitive dynamics are intense, with leading companies investing heavily in research and development to enhance product features and expand their market presence. The market is expected to experience a Compound Annual Growth Rate (CAGR) of xx% during the forecast period (2025-2033). Market penetration of blood glucose monitoring devices remains high in developed markets but shows significant growth potential in emerging economies. This is further driven by increased awareness and government initiatives promoting diabetes management and control.
Leading Markets & Segments in Self-Monitoring Blood Glucose Strips Industry
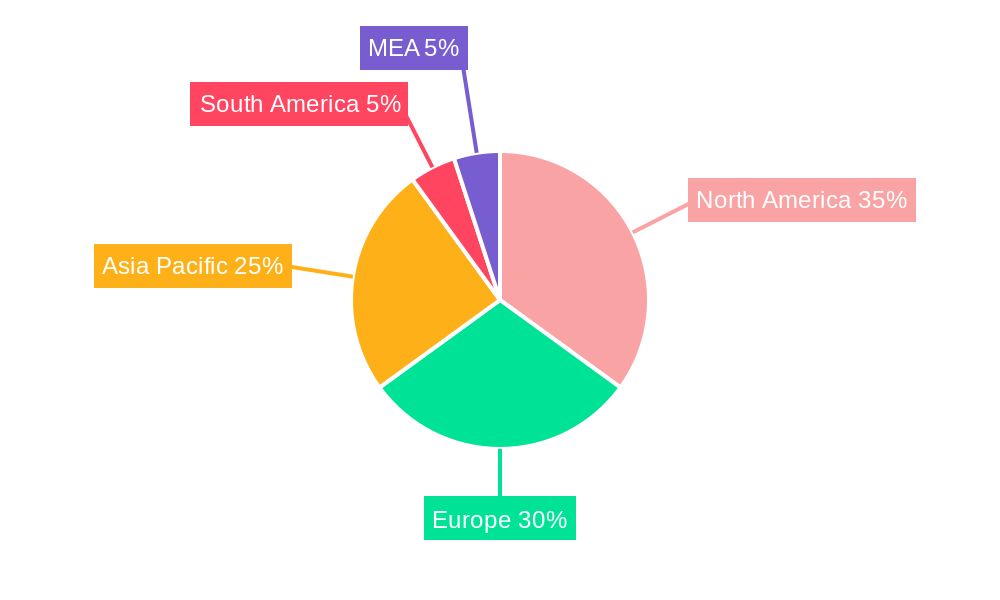
The self-monitoring blood glucose strips market is geographically diverse, with significant presence across North America, Europe, and Asia-Pacific. However, North America currently holds the dominant position, driven by high diabetes prevalence, robust healthcare infrastructure, and high disposable incomes. Within the market segments, test strips constitute the largest revenue contributor, followed by glucometer devices and lancets.
- Dominant Region: North America
- Key Drivers in North America: High diabetes prevalence, advanced healthcare infrastructure, high disposable income.
- Dominant Segment: Test Strips
- Key Drivers in Test Strips Segment: High consumption rate, frequent replacement needs.
Detailed Dominance Analysis: North America's dominance is largely attributed to factors including high prevalence of diabetes, better healthcare infrastructure supporting widespread adoption of blood glucose monitoring, and a strong regulatory framework. This region shows a stronger market maturity compared to other regions, but continued growth can be expected due to technological advancements and the aging population. While the test strips segment holds the largest market share currently, the growth potential for glucometer devices and integration with digital health technology suggests a shift towards a more balanced market share distribution in the long term.
Self-Monitoring Blood Glucose Strips Industry Product Developments
Recent product innovations focus on enhancing accuracy, improving usability, and integrating smart features. Many manufacturers are developing smaller, more user-friendly devices, incorporating Bluetooth connectivity for seamless data transfer to smartphones and cloud platforms. This integration enables remote patient monitoring, personalized diabetes management, and improved clinical outcomes. Continuous glucose monitoring (CGM) systems are gaining popularity due to their ability to provide real-time glucose data, minimizing the need for frequent finger-prick testing. The competitive advantage lies in providing accurate, reliable, and user-friendly devices that offer seamless integration with existing diabetes management systems.
Key Drivers of Self-Monitoring Blood Glucose Strips Industry Growth
The self-monitoring blood glucose strips market is driven by a confluence of factors, including the rising prevalence of diabetes globally, technological advancements leading to more convenient and accurate devices, increasing healthcare expenditure, and supportive government initiatives promoting diabetes management. Growing awareness about diabetes and its complications is also driving demand for self-monitoring tools. Furthermore, expanding access to healthcare in developing countries is also a significant factor. The growing adoption of telehealth and remote patient monitoring is also fueling market growth.
Challenges in the Self-Monitoring Blood Glucose Strips Industry Market
The industry faces challenges such as stringent regulatory requirements for device approvals, fluctuations in raw material prices impacting manufacturing costs, intense competition among established players and emerging entrants, and the potential for price erosion due to increased competition. Furthermore, the reimbursement policies in some countries can also impede market access and hinder growth. These factors contribute to a complex and challenging business environment. An estimated xx Million in revenue loss is potentially linked to supply chain disruptions in 2024.
Emerging Opportunities in Self-Monitoring Blood Glucose Strips Industry
The market presents significant opportunities for growth through technological innovation, expansion into emerging markets, and strategic partnerships. Advancements in CGM technology, development of integrated diabetes management platforms, and expansion into underserved regions offer significant potential. Strategic collaborations with healthcare providers and technology companies can further enhance market penetration and create new revenue streams.
Leading Players in the Self-Monitoring Blood Glucose Strips Industry Sector
- Agamatrix
- Roche Diabetes Care (Roche)
- Abbott Diabetes Care (Abbott)
- Rossmax International
- Medisana
- Acon
- Bionime Corporation
- Arkray
- LifeScan (LifeScan)
- Ascensia Diabetes Care (Ascensia)
Key Milestones in Self-Monitoring Blood Glucose Strips Industry Industry
- June 2022: LifeScan published Real World Evidence demonstrating improved glycemic control using their OneTouch Reveal mobile app with the OneTouch Verio Reflect meter.
- April 2023: NHS England released recommendations for commissioning blood glucose meters, testing strips, and lancets following a national evaluation.
Strategic Outlook for Self-Monitoring Blood Glucose Strips Industry Market
The self-monitoring blood glucose strips market is poised for continued growth, driven by technological advancements, increasing prevalence of diabetes, and expanding access to healthcare. Companies that focus on innovation, strategic partnerships, and expansion into emerging markets are well-positioned to capture significant market share. The integration of advanced technologies such as AI and machine learning to improve data analysis and personalized diabetes management will shape future market trends. The market shows strong potential for substantial growth in the coming decade.
Self-Monitoring Blood Glucose Strips Industry Segmentation
-
1. Component
- 1.1. Glucometer Devices
- 1.2. Test Strips
- 1.3. Lancets
Self-Monitoring Blood Glucose Strips Industry Segmentation By Geography
-
1. North America
- 1.1. United States
- 1.2. Canada
- 1.3. Rest of North America
-
2. Europe
- 2.1. Germany
- 2.2. Spain
- 2.3. Italy
- 2.4. France
- 2.5. United Kingdom
- 2.6. Russia
- 2.7. Rest of Europe
-
3. Asia Pacific
- 3.1. Japan
- 3.2. China
- 3.3. Australia
- 3.4. India
- 3.5. South Korea
- 3.6. Malaysia
- 3.7. Indonesia
- 3.8. Thailand
- 3.9. Philippines
- 3.10. Vietnam
- 3.11. Rest of Asia Pacific
-
4. Latin America
- 4.1. Brazil
- 4.2. Mexico
- 4.3. Rest of Latin America
-
5. Middle East and Africa
- 5.1. South Africa
- 5.2. Saudi Arabia
- 5.3. Oman
- 5.4. Egypt
- 5.5. Iran
- 5.6. Rest of Middle East and Africa
Self-Monitoring Blood Glucose Strips Industry REPORT HIGHLIGHTS
| Aspects | Details |
|---|---|
| Study Period | 2019-2033 |
| Base Year | 2024 |
| Estimated Year | 2025 |
| Forecast Period | 2025-2033 |
| Historical Period | 2019-2024 |
| Growth Rate | CAGR of 6.23% from 2019-2033 |
| Segmentation |
|
Table of Contents
- 1. Introduction
- 1.1. Research Scope
- 1.2. Market Segmentation
- 1.3. Research Methodology
- 1.4. Definitions and Assumptions
- 2. Executive Summary
- 2.1. Introduction
- 3. Market Dynamics
- 3.1. Introduction
- 3.2. Market Drivers
- 3.2.1. Rising Prevalence of Cancer Worldwide; Technological Advancements in Diagnostic Testing; Increasing Demand for Point-of-care Treatment
- 3.3. Market Restrains
- 3.3.1. High Cost of Molecular Diagnostic Tests; Lack of Skilled Workforce and Stringent Regulatory Framework
- 3.4. Market Trends
- 3.4.1. The glucometer devices segment is expected to register the highest CAGR over the forecast period
- 4. Market Factor Analysis
- 4.1. Porters Five Forces
- 4.2. Supply/Value Chain
- 4.3. PESTEL analysis
- 4.4. Market Entropy
- 4.5. Patent/Trademark Analysis
- 5. Global Self-Monitoring Blood Glucose Strips Industry Analysis, Insights and Forecast, 2019-2031
- 5.1. Market Analysis, Insights and Forecast - by Component
- 5.1.1. Glucometer Devices
- 5.1.2. Test Strips
- 5.1.3. Lancets
- 5.2. Market Analysis, Insights and Forecast - by Region
- 5.2.1. North America
- 5.2.2. Europe
- 5.2.3. Asia Pacific
- 5.2.4. Latin America
- 5.2.5. Middle East and Africa
- 5.1. Market Analysis, Insights and Forecast - by Component
- 6. North America Self-Monitoring Blood Glucose Strips Industry Analysis, Insights and Forecast, 2019-2031
- 6.1. Market Analysis, Insights and Forecast - by Component
- 6.1.1. Glucometer Devices
- 6.1.2. Test Strips
- 6.1.3. Lancets
- 6.1. Market Analysis, Insights and Forecast - by Component
- 7. Europe Self-Monitoring Blood Glucose Strips Industry Analysis, Insights and Forecast, 2019-2031
- 7.1. Market Analysis, Insights and Forecast - by Component
- 7.1.1. Glucometer Devices
- 7.1.2. Test Strips
- 7.1.3. Lancets
- 7.1. Market Analysis, Insights and Forecast - by Component
- 8. Asia Pacific Self-Monitoring Blood Glucose Strips Industry Analysis, Insights and Forecast, 2019-2031
- 8.1. Market Analysis, Insights and Forecast - by Component
- 8.1.1. Glucometer Devices
- 8.1.2. Test Strips
- 8.1.3. Lancets
- 8.1. Market Analysis, Insights and Forecast - by Component
- 9. Latin America Self-Monitoring Blood Glucose Strips Industry Analysis, Insights and Forecast, 2019-2031
- 9.1. Market Analysis, Insights and Forecast - by Component
- 9.1.1. Glucometer Devices
- 9.1.2. Test Strips
- 9.1.3. Lancets
- 9.1. Market Analysis, Insights and Forecast - by Component
- 10. Middle East and Africa Self-Monitoring Blood Glucose Strips Industry Analysis, Insights and Forecast, 2019-2031
- 10.1. Market Analysis, Insights and Forecast - by Component
- 10.1.1. Glucometer Devices
- 10.1.2. Test Strips
- 10.1.3. Lancets
- 10.1. Market Analysis, Insights and Forecast - by Component
- 11. North America Self-Monitoring Blood Glucose Strips Industry Analysis, Insights and Forecast, 2019-2031
- 11.1. Market Analysis, Insights and Forecast - By Country/Sub-region
- 11.1.1 United States
- 11.1.2 Canada
- 11.1.3 Mexico
- 12. Europe Self-Monitoring Blood Glucose Strips Industry Analysis, Insights and Forecast, 2019-2031
- 12.1. Market Analysis, Insights and Forecast - By Country/Sub-region
- 12.1.1 Germany
- 12.1.2 United Kingdom
- 12.1.3 France
- 12.1.4 Spain
- 12.1.5 Italy
- 12.1.6 Spain
- 12.1.7 Belgium
- 12.1.8 Netherland
- 12.1.9 Nordics
- 12.1.10 Rest of Europe
- 13. Asia Pacific Self-Monitoring Blood Glucose Strips Industry Analysis, Insights and Forecast, 2019-2031
- 13.1. Market Analysis, Insights and Forecast - By Country/Sub-region
- 13.1.1 China
- 13.1.2 Japan
- 13.1.3 India
- 13.1.4 South Korea
- 13.1.5 Southeast Asia
- 13.1.6 Australia
- 13.1.7 Indonesia
- 13.1.8 Phillipes
- 13.1.9 Singapore
- 13.1.10 Thailandc
- 13.1.11 Rest of Asia Pacific
- 14. South America Self-Monitoring Blood Glucose Strips Industry Analysis, Insights and Forecast, 2019-2031
- 14.1. Market Analysis, Insights and Forecast - By Country/Sub-region
- 14.1.1 Brazil
- 14.1.2 Argentina
- 14.1.3 Peru
- 14.1.4 Chile
- 14.1.5 Colombia
- 14.1.6 Ecuador
- 14.1.7 Venezuela
- 14.1.8 Rest of South America
- 15. MEA Self-Monitoring Blood Glucose Strips Industry Analysis, Insights and Forecast, 2019-2031
- 15.1. Market Analysis, Insights and Forecast - By Country/Sub-region
- 15.1.1 United Arab Emirates
- 15.1.2 Saudi Arabia
- 15.1.3 South Africa
- 15.1.4 Rest of Middle East and Africa
- 16. Competitive Analysis
- 16.1. Global Market Share Analysis 2024
- 16.2. Company Profiles
- 16.2.1 Agamatrix
- 16.2.1.1. Overview
- 16.2.1.2. Products
- 16.2.1.3. SWOT Analysis
- 16.2.1.4. Recent Developments
- 16.2.1.5. Financials (Based on Availability)
- 16.2.2 Roche Diabetes Care
- 16.2.2.1. Overview
- 16.2.2.2. Products
- 16.2.2.3. SWOT Analysis
- 16.2.2.4. Recent Developments
- 16.2.2.5. Financials (Based on Availability)
- 16.2.3 Abbott Diabetes Care
- 16.2.3.1. Overview
- 16.2.3.2. Products
- 16.2.3.3. SWOT Analysis
- 16.2.3.4. Recent Developments
- 16.2.3.5. Financials (Based on Availability)
- 16.2.4 Rossmax International*List Not Exhaustive 7 2 Company Share Analysi
- 16.2.4.1. Overview
- 16.2.4.2. Products
- 16.2.4.3. SWOT Analysis
- 16.2.4.4. Recent Developments
- 16.2.4.5. Financials (Based on Availability)
- 16.2.5 Medisana
- 16.2.5.1. Overview
- 16.2.5.2. Products
- 16.2.5.3. SWOT Analysis
- 16.2.5.4. Recent Developments
- 16.2.5.5. Financials (Based on Availability)
- 16.2.6 Acon
- 16.2.6.1. Overview
- 16.2.6.2. Products
- 16.2.6.3. SWOT Analysis
- 16.2.6.4. Recent Developments
- 16.2.6.5. Financials (Based on Availability)
- 16.2.7 Bionime Corporation
- 16.2.7.1. Overview
- 16.2.7.2. Products
- 16.2.7.3. SWOT Analysis
- 16.2.7.4. Recent Developments
- 16.2.7.5. Financials (Based on Availability)
- 16.2.8 Arkray
- 16.2.8.1. Overview
- 16.2.8.2. Products
- 16.2.8.3. SWOT Analysis
- 16.2.8.4. Recent Developments
- 16.2.8.5. Financials (Based on Availability)
- 16.2.9 LifeScan
- 16.2.9.1. Overview
- 16.2.9.2. Products
- 16.2.9.3. SWOT Analysis
- 16.2.9.4. Recent Developments
- 16.2.9.5. Financials (Based on Availability)
- 16.2.10 Ascensia Diabetes Care
- 16.2.10.1. Overview
- 16.2.10.2. Products
- 16.2.10.3. SWOT Analysis
- 16.2.10.4. Recent Developments
- 16.2.10.5. Financials (Based on Availability)
- 16.2.1 Agamatrix
List of Figures
- Figure 1: Global Self-Monitoring Blood Glucose Strips Industry Revenue Breakdown (Million, %) by Region 2024 & 2032
- Figure 2: North America Self-Monitoring Blood Glucose Strips Industry Revenue (Million), by Country 2024 & 2032
- Figure 3: North America Self-Monitoring Blood Glucose Strips Industry Revenue Share (%), by Country 2024 & 2032
- Figure 4: Europe Self-Monitoring Blood Glucose Strips Industry Revenue (Million), by Country 2024 & 2032
- Figure 5: Europe Self-Monitoring Blood Glucose Strips Industry Revenue Share (%), by Country 2024 & 2032
- Figure 6: Asia Pacific Self-Monitoring Blood Glucose Strips Industry Revenue (Million), by Country 2024 & 2032
- Figure 7: Asia Pacific Self-Monitoring Blood Glucose Strips Industry Revenue Share (%), by Country 2024 & 2032
- Figure 8: South America Self-Monitoring Blood Glucose Strips Industry Revenue (Million), by Country 2024 & 2032
- Figure 9: South America Self-Monitoring Blood Glucose Strips Industry Revenue Share (%), by Country 2024 & 2032
- Figure 10: MEA Self-Monitoring Blood Glucose Strips Industry Revenue (Million), by Country 2024 & 2032
- Figure 11: MEA Self-Monitoring Blood Glucose Strips Industry Revenue Share (%), by Country 2024 & 2032
- Figure 12: North America Self-Monitoring Blood Glucose Strips Industry Revenue (Million), by Component 2024 & 2032
- Figure 13: North America Self-Monitoring Blood Glucose Strips Industry Revenue Share (%), by Component 2024 & 2032
- Figure 14: North America Self-Monitoring Blood Glucose Strips Industry Revenue (Million), by Country 2024 & 2032
- Figure 15: North America Self-Monitoring Blood Glucose Strips Industry Revenue Share (%), by Country 2024 & 2032
- Figure 16: Europe Self-Monitoring Blood Glucose Strips Industry Revenue (Million), by Component 2024 & 2032
- Figure 17: Europe Self-Monitoring Blood Glucose Strips Industry Revenue Share (%), by Component 2024 & 2032
- Figure 18: Europe Self-Monitoring Blood Glucose Strips Industry Revenue (Million), by Country 2024 & 2032
- Figure 19: Europe Self-Monitoring Blood Glucose Strips Industry Revenue Share (%), by Country 2024 & 2032
- Figure 20: Asia Pacific Self-Monitoring Blood Glucose Strips Industry Revenue (Million), by Component 2024 & 2032
- Figure 21: Asia Pacific Self-Monitoring Blood Glucose Strips Industry Revenue Share (%), by Component 2024 & 2032
- Figure 22: Asia Pacific Self-Monitoring Blood Glucose Strips Industry Revenue (Million), by Country 2024 & 2032
- Figure 23: Asia Pacific Self-Monitoring Blood Glucose Strips Industry Revenue Share (%), by Country 2024 & 2032
- Figure 24: Latin America Self-Monitoring Blood Glucose Strips Industry Revenue (Million), by Component 2024 & 2032
- Figure 25: Latin America Self-Monitoring Blood Glucose Strips Industry Revenue Share (%), by Component 2024 & 2032
- Figure 26: Latin America Self-Monitoring Blood Glucose Strips Industry Revenue (Million), by Country 2024 & 2032
- Figure 27: Latin America Self-Monitoring Blood Glucose Strips Industry Revenue Share (%), by Country 2024 & 2032
- Figure 28: Middle East and Africa Self-Monitoring Blood Glucose Strips Industry Revenue (Million), by Component 2024 & 2032
- Figure 29: Middle East and Africa Self-Monitoring Blood Glucose Strips Industry Revenue Share (%), by Component 2024 & 2032
- Figure 30: Middle East and Africa Self-Monitoring Blood Glucose Strips Industry Revenue (Million), by Country 2024 & 2032
- Figure 31: Middle East and Africa Self-Monitoring Blood Glucose Strips Industry Revenue Share (%), by Country 2024 & 2032
List of Tables
- Table 1: Global Self-Monitoring Blood Glucose Strips Industry Revenue Million Forecast, by Region 2019 & 2032
- Table 2: Global Self-Monitoring Blood Glucose Strips Industry Revenue Million Forecast, by Component 2019 & 2032
- Table 3: Global Self-Monitoring Blood Glucose Strips Industry Revenue Million Forecast, by Region 2019 & 2032
- Table 4: Global Self-Monitoring Blood Glucose Strips Industry Revenue Million Forecast, by Country 2019 & 2032
- Table 5: United States Self-Monitoring Blood Glucose Strips Industry Revenue (Million) Forecast, by Application 2019 & 2032
- Table 6: Canada Self-Monitoring Blood Glucose Strips Industry Revenue (Million) Forecast, by Application 2019 & 2032
- Table 7: Mexico Self-Monitoring Blood Glucose Strips Industry Revenue (Million) Forecast, by Application 2019 & 2032
- Table 8: Global Self-Monitoring Blood Glucose Strips Industry Revenue Million Forecast, by Country 2019 & 2032
- Table 9: Germany Self-Monitoring Blood Glucose Strips Industry Revenue (Million) Forecast, by Application 2019 & 2032
- Table 10: United Kingdom Self-Monitoring Blood Glucose Strips Industry Revenue (Million) Forecast, by Application 2019 & 2032
- Table 11: France Self-Monitoring Blood Glucose Strips Industry Revenue (Million) Forecast, by Application 2019 & 2032
- Table 12: Spain Self-Monitoring Blood Glucose Strips Industry Revenue (Million) Forecast, by Application 2019 & 2032
- Table 13: Italy Self-Monitoring Blood Glucose Strips Industry Revenue (Million) Forecast, by Application 2019 & 2032
- Table 14: Spain Self-Monitoring Blood Glucose Strips Industry Revenue (Million) Forecast, by Application 2019 & 2032
- Table 15: Belgium Self-Monitoring Blood Glucose Strips Industry Revenue (Million) Forecast, by Application 2019 & 2032
- Table 16: Netherland Self-Monitoring Blood Glucose Strips Industry Revenue (Million) Forecast, by Application 2019 & 2032
- Table 17: Nordics Self-Monitoring Blood Glucose Strips Industry Revenue (Million) Forecast, by Application 2019 & 2032
- Table 18: Rest of Europe Self-Monitoring Blood Glucose Strips Industry Revenue (Million) Forecast, by Application 2019 & 2032
- Table 19: Global Self-Monitoring Blood Glucose Strips Industry Revenue Million Forecast, by Country 2019 & 2032
- Table 20: China Self-Monitoring Blood Glucose Strips Industry Revenue (Million) Forecast, by Application 2019 & 2032
- Table 21: Japan Self-Monitoring Blood Glucose Strips Industry Revenue (Million) Forecast, by Application 2019 & 2032
- Table 22: India Self-Monitoring Blood Glucose Strips Industry Revenue (Million) Forecast, by Application 2019 & 2032
- Table 23: South Korea Self-Monitoring Blood Glucose Strips Industry Revenue (Million) Forecast, by Application 2019 & 2032
- Table 24: Southeast Asia Self-Monitoring Blood Glucose Strips Industry Revenue (Million) Forecast, by Application 2019 & 2032
- Table 25: Australia Self-Monitoring Blood Glucose Strips Industry Revenue (Million) Forecast, by Application 2019 & 2032
- Table 26: Indonesia Self-Monitoring Blood Glucose Strips Industry Revenue (Million) Forecast, by Application 2019 & 2032
- Table 27: Phillipes Self-Monitoring Blood Glucose Strips Industry Revenue (Million) Forecast, by Application 2019 & 2032
- Table 28: Singapore Self-Monitoring Blood Glucose Strips Industry Revenue (Million) Forecast, by Application 2019 & 2032
- Table 29: Thailandc Self-Monitoring Blood Glucose Strips Industry Revenue (Million) Forecast, by Application 2019 & 2032
- Table 30: Rest of Asia Pacific Self-Monitoring Blood Glucose Strips Industry Revenue (Million) Forecast, by Application 2019 & 2032
- Table 31: Global Self-Monitoring Blood Glucose Strips Industry Revenue Million Forecast, by Country 2019 & 2032
- Table 32: Brazil Self-Monitoring Blood Glucose Strips Industry Revenue (Million) Forecast, by Application 2019 & 2032
- Table 33: Argentina Self-Monitoring Blood Glucose Strips Industry Revenue (Million) Forecast, by Application 2019 & 2032
- Table 34: Peru Self-Monitoring Blood Glucose Strips Industry Revenue (Million) Forecast, by Application 2019 & 2032
- Table 35: Chile Self-Monitoring Blood Glucose Strips Industry Revenue (Million) Forecast, by Application 2019 & 2032
- Table 36: Colombia Self-Monitoring Blood Glucose Strips Industry Revenue (Million) Forecast, by Application 2019 & 2032
- Table 37: Ecuador Self-Monitoring Blood Glucose Strips Industry Revenue (Million) Forecast, by Application 2019 & 2032
- Table 38: Venezuela Self-Monitoring Blood Glucose Strips Industry Revenue (Million) Forecast, by Application 2019 & 2032
- Table 39: Rest of South America Self-Monitoring Blood Glucose Strips Industry Revenue (Million) Forecast, by Application 2019 & 2032
- Table 40: Global Self-Monitoring Blood Glucose Strips Industry Revenue Million Forecast, by Country 2019 & 2032
- Table 41: United Arab Emirates Self-Monitoring Blood Glucose Strips Industry Revenue (Million) Forecast, by Application 2019 & 2032
- Table 42: Saudi Arabia Self-Monitoring Blood Glucose Strips Industry Revenue (Million) Forecast, by Application 2019 & 2032
- Table 43: South Africa Self-Monitoring Blood Glucose Strips Industry Revenue (Million) Forecast, by Application 2019 & 2032
- Table 44: Rest of Middle East and Africa Self-Monitoring Blood Glucose Strips Industry Revenue (Million) Forecast, by Application 2019 & 2032
- Table 45: Global Self-Monitoring Blood Glucose Strips Industry Revenue Million Forecast, by Component 2019 & 2032
- Table 46: Global Self-Monitoring Blood Glucose Strips Industry Revenue Million Forecast, by Country 2019 & 2032
- Table 47: United States Self-Monitoring Blood Glucose Strips Industry Revenue (Million) Forecast, by Application 2019 & 2032
- Table 48: Canada Self-Monitoring Blood Glucose Strips Industry Revenue (Million) Forecast, by Application 2019 & 2032
- Table 49: Rest of North America Self-Monitoring Blood Glucose Strips Industry Revenue (Million) Forecast, by Application 2019 & 2032
- Table 50: Global Self-Monitoring Blood Glucose Strips Industry Revenue Million Forecast, by Component 2019 & 2032
- Table 51: Global Self-Monitoring Blood Glucose Strips Industry Revenue Million Forecast, by Country 2019 & 2032
- Table 52: Germany Self-Monitoring Blood Glucose Strips Industry Revenue (Million) Forecast, by Application 2019 & 2032
- Table 53: Spain Self-Monitoring Blood Glucose Strips Industry Revenue (Million) Forecast, by Application 2019 & 2032
- Table 54: Italy Self-Monitoring Blood Glucose Strips Industry Revenue (Million) Forecast, by Application 2019 & 2032
- Table 55: France Self-Monitoring Blood Glucose Strips Industry Revenue (Million) Forecast, by Application 2019 & 2032
- Table 56: United Kingdom Self-Monitoring Blood Glucose Strips Industry Revenue (Million) Forecast, by Application 2019 & 2032
- Table 57: Russia Self-Monitoring Blood Glucose Strips Industry Revenue (Million) Forecast, by Application 2019 & 2032
- Table 58: Rest of Europe Self-Monitoring Blood Glucose Strips Industry Revenue (Million) Forecast, by Application 2019 & 2032
- Table 59: Global Self-Monitoring Blood Glucose Strips Industry Revenue Million Forecast, by Component 2019 & 2032
- Table 60: Global Self-Monitoring Blood Glucose Strips Industry Revenue Million Forecast, by Country 2019 & 2032
- Table 61: Japan Self-Monitoring Blood Glucose Strips Industry Revenue (Million) Forecast, by Application 2019 & 2032
- Table 62: China Self-Monitoring Blood Glucose Strips Industry Revenue (Million) Forecast, by Application 2019 & 2032
- Table 63: Australia Self-Monitoring Blood Glucose Strips Industry Revenue (Million) Forecast, by Application 2019 & 2032
- Table 64: India Self-Monitoring Blood Glucose Strips Industry Revenue (Million) Forecast, by Application 2019 & 2032
- Table 65: South Korea Self-Monitoring Blood Glucose Strips Industry Revenue (Million) Forecast, by Application 2019 & 2032
- Table 66: Malaysia Self-Monitoring Blood Glucose Strips Industry Revenue (Million) Forecast, by Application 2019 & 2032
- Table 67: Indonesia Self-Monitoring Blood Glucose Strips Industry Revenue (Million) Forecast, by Application 2019 & 2032
- Table 68: Thailand Self-Monitoring Blood Glucose Strips Industry Revenue (Million) Forecast, by Application 2019 & 2032
- Table 69: Philippines Self-Monitoring Blood Glucose Strips Industry Revenue (Million) Forecast, by Application 2019 & 2032
- Table 70: Vietnam Self-Monitoring Blood Glucose Strips Industry Revenue (Million) Forecast, by Application 2019 & 2032
- Table 71: Rest of Asia Pacific Self-Monitoring Blood Glucose Strips Industry Revenue (Million) Forecast, by Application 2019 & 2032
- Table 72: Global Self-Monitoring Blood Glucose Strips Industry Revenue Million Forecast, by Component 2019 & 2032
- Table 73: Global Self-Monitoring Blood Glucose Strips Industry Revenue Million Forecast, by Country 2019 & 2032
- Table 74: Brazil Self-Monitoring Blood Glucose Strips Industry Revenue (Million) Forecast, by Application 2019 & 2032
- Table 75: Mexico Self-Monitoring Blood Glucose Strips Industry Revenue (Million) Forecast, by Application 2019 & 2032
- Table 76: Rest of Latin America Self-Monitoring Blood Glucose Strips Industry Revenue (Million) Forecast, by Application 2019 & 2032
- Table 77: Global Self-Monitoring Blood Glucose Strips Industry Revenue Million Forecast, by Component 2019 & 2032
- Table 78: Global Self-Monitoring Blood Glucose Strips Industry Revenue Million Forecast, by Country 2019 & 2032
- Table 79: South Africa Self-Monitoring Blood Glucose Strips Industry Revenue (Million) Forecast, by Application 2019 & 2032
- Table 80: Saudi Arabia Self-Monitoring Blood Glucose Strips Industry Revenue (Million) Forecast, by Application 2019 & 2032
- Table 81: Oman Self-Monitoring Blood Glucose Strips Industry Revenue (Million) Forecast, by Application 2019 & 2032
- Table 82: Egypt Self-Monitoring Blood Glucose Strips Industry Revenue (Million) Forecast, by Application 2019 & 2032
- Table 83: Iran Self-Monitoring Blood Glucose Strips Industry Revenue (Million) Forecast, by Application 2019 & 2032
- Table 84: Rest of Middle East and Africa Self-Monitoring Blood Glucose Strips Industry Revenue (Million) Forecast, by Application 2019 & 2032
Frequently Asked Questions
1. What is the projected Compound Annual Growth Rate (CAGR) of the Self-Monitoring Blood Glucose Strips Industry?
The projected CAGR is approximately 6.23%.
2. Which companies are prominent players in the Self-Monitoring Blood Glucose Strips Industry?
Key companies in the market include Agamatrix, Roche Diabetes Care, Abbott Diabetes Care, Rossmax International*List Not Exhaustive 7 2 Company Share Analysi, Medisana, Acon, Bionime Corporation, Arkray, LifeScan, Ascensia Diabetes Care.
3. What are the main segments of the Self-Monitoring Blood Glucose Strips Industry?
The market segments include Component.
4. Can you provide details about the market size?
The market size is estimated to be USD 7.22 Million as of 2022.
5. What are some drivers contributing to market growth?
Rising Prevalence of Cancer Worldwide; Technological Advancements in Diagnostic Testing; Increasing Demand for Point-of-care Treatment.
6. What are the notable trends driving market growth?
The glucometer devices segment is expected to register the highest CAGR over the forecast period.
7. Are there any restraints impacting market growth?
High Cost of Molecular Diagnostic Tests; Lack of Skilled Workforce and Stringent Regulatory Framework.
8. Can you provide examples of recent developments in the market?
April 2023: NHS england relased recommendations for commissioning after the national evaluation of blood glucose meters, testing strips, and lancets.
9. What pricing options are available for accessing the report?
Pricing options include single-user, multi-user, and enterprise licenses priced at USD 4750, USD 5250, and USD 8750 respectively.
10. Is the market size provided in terms of value or volume?
The market size is provided in terms of value, measured in Million.
11. Are there any specific market keywords associated with the report?
Yes, the market keyword associated with the report is "Self-Monitoring Blood Glucose Strips Industry," which aids in identifying and referencing the specific market segment covered.
12. How do I determine which pricing option suits my needs best?
The pricing options vary based on user requirements and access needs. Individual users may opt for single-user licenses, while businesses requiring broader access may choose multi-user or enterprise licenses for cost-effective access to the report.
13. Are there any additional resources or data provided in the Self-Monitoring Blood Glucose Strips Industry report?
While the report offers comprehensive insights, it's advisable to review the specific contents or supplementary materials provided to ascertain if additional resources or data are available.
14. How can I stay updated on further developments or reports in the Self-Monitoring Blood Glucose Strips Industry?
To stay informed about further developments, trends, and reports in the Self-Monitoring Blood Glucose Strips Industry, consider subscribing to industry newsletters, following relevant companies and organizations, or regularly checking reputable industry news sources and publications.
Methodology
Step 1 - Identification of Relevant Samples Size from Population Database


Step 2 - Approaches for Defining Global Market Size (Value, Volume* & Price*)

Note*: In applicable scenarios
Step 3 - Data Sources
Primary Research
- Web Analytics
- Survey Reports
- Research Institute
- Latest Research Reports
- Opinion Leaders
Secondary Research
- Annual Reports
- White Paper
- Latest Press Release
- Industry Association
- Paid Database
- Investor Presentations

Step 4 - Data Triangulation
Involves using different sources of information in order to increase the validity of a study
These sources are likely to be stakeholders in a program - participants, other researchers, program staff, other community members, and so on.
Then we put all data in single framework & apply various statistical tools to find out the dynamic on the market.
During the analysis stage, feedback from the stakeholder groups would be compared to determine areas of agreement as well as areas of divergence
