

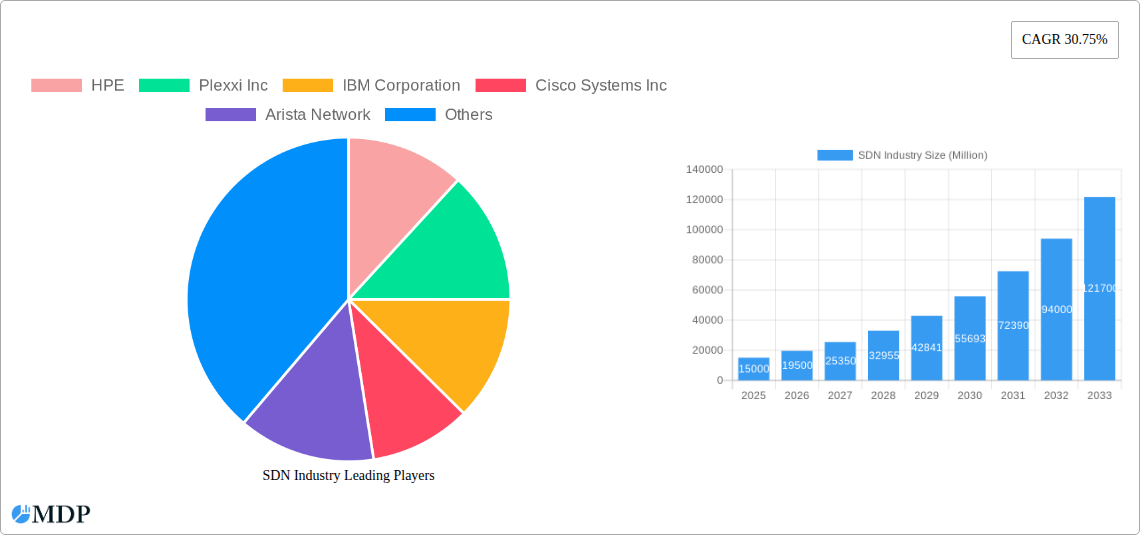
Key Insights
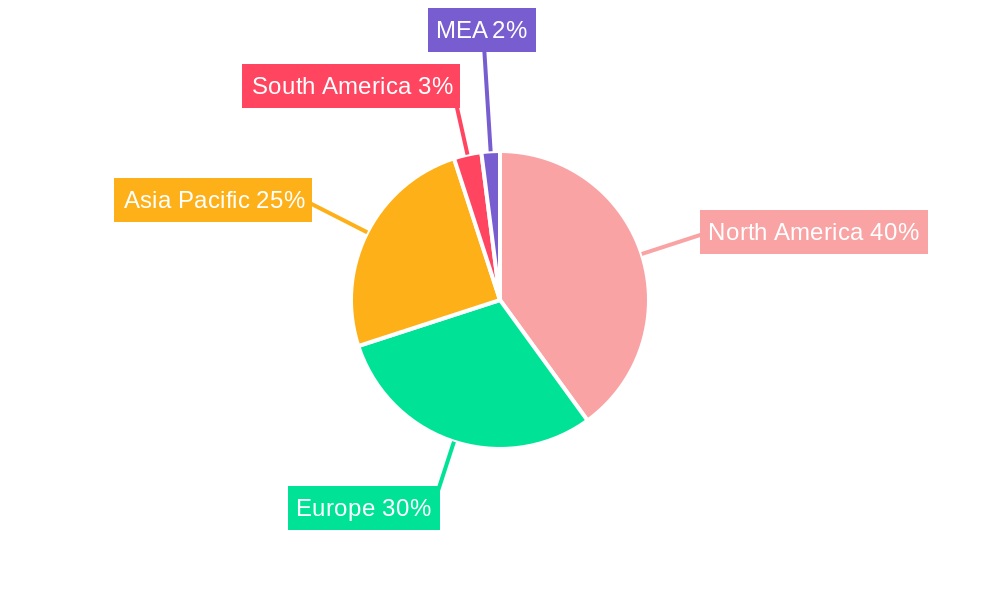
The Software-Defined Networking (SDN) market is experiencing robust growth, projected to reach a significant size by 2033. A Compound Annual Growth Rate (CAGR) of 30.75% from 2019 to 2024 indicates substantial market expansion driven by several key factors. The increasing adoption of cloud computing, the need for greater network agility and automation, and the rise of 5G and edge computing are all significantly contributing to this growth. Enterprises are increasingly embracing SDN to improve network efficiency, reduce operational costs, and enhance security. Furthermore, the growing demand for network programmability and the ability to easily integrate with various applications are driving further adoption across diverse industry verticals, including BFSI, telecom, and manufacturing. The North American market currently holds a substantial share, but regions like Asia-Pacific are experiencing rapid growth, presenting significant opportunities for SDN vendors. Competition is fierce, with established players like Cisco and HPE competing with emerging specialists like Pluribus and Big Switch. This competitive landscape fosters innovation and drives down costs, making SDN more accessible to a wider range of businesses.
However, challenges remain. The complexity of implementation, the need for skilled professionals to manage SDN networks, and concerns around security and vendor lock-in are potential restraints on market growth. Addressing these challenges through improved tools, training programs, and robust security solutions is crucial for realizing the full potential of the SDN market. The ongoing evolution of SDN technologies, particularly in areas like AI-driven network management and the integration of network functions virtualization (NFV), will continue to shape the future of the market, promising further expansion and innovation in the years to come. The strategic focus on hybrid cloud models and multi-cloud architectures will also significantly influence the market’s growth trajectory.
Software Defined Networking (SDN) Industry Market Report: 2019-2033
This comprehensive report provides an in-depth analysis of the SDN industry, projecting a market valuation of xx Million by 2033. It covers market dynamics, leading players, emerging trends, and future opportunities, offering actionable insights for stakeholders across the value chain. The study period spans 2019-2033, with 2025 as the base and estimated year. The forecast period is 2025-2033 and the historical period is 2019-2024.
SDN Industry Market Dynamics & Concentration
The SDN market is characterized by a moderate level of concentration, with several major players holding significant market share. However, the landscape is dynamic, with ongoing innovation, mergers and acquisitions (M&A) activity, and the emergence of new technologies shaping the competitive dynamics. The market is driven by the increasing demand for flexible, scalable, and cost-effective network solutions, particularly in the cloud and enterprise sectors. Regulatory frameworks, while not overly restrictive, play a role in shaping market access and deployment strategies. Product substitutes, such as traditional networking solutions, continue to exist but face increasing pressure from the advantages offered by SDN's agility and programmability. Significant M&A activity, with an estimated xx deals in the last 5 years, indicates consolidation and strategic expansion within the industry. Key market share holders in 2025 are estimated to include:
- Cisco Systems Inc: xx%
- HPE: xx%
- Juniper Networks: xx%
- Others: xx%
End-user trends showcase a strong preference for SDN solutions offering enhanced network visibility, automation, and security. The rise of cloud computing and the Internet of Things (IoT) is further fueling demand. The overall market is expected to exhibit a CAGR of xx% during the forecast period.
SDN Industry Industry Trends & Analysis
The SDN market is experiencing robust growth, driven by several key factors. The increasing adoption of cloud computing and virtualization is a major catalyst, as SDN solutions offer seamless integration and management of virtualized network resources. The demand for agile and scalable networks capable of adapting to fluctuating traffic patterns is another significant driver. Technological advancements, such as the development of advanced SDN controllers and network virtualization platforms, are continuously enhancing the capabilities and efficiency of SDN deployments. Consumer preferences are shifting towards more sophisticated network management solutions that offer increased security, reduced operational costs, and improved performance. Competitive dynamics are shaped by the continuous innovation in SDN technologies and the strategic partnerships formed between vendors and service providers. Market penetration is expected to reach xx% by 2033, driven by the increasing adoption of SDN in various industries. The CAGR for the period 2025-2033 is estimated at xx%.
Leading Markets & Segments in SDN Industry
The North American region currently holds a dominant position in the SDN market, driven by factors such as high technological advancements, strong investments in IT infrastructure, and the presence of major technology companies. However, the Asia-Pacific region is expected to witness significant growth in the coming years, fueled by increasing digitalization initiatives and the expansion of cloud computing services.
Key Drivers by Segment:
By End User:
- Cloud Service Providers: High demand for scalable and automated network infrastructure.
- Enterprises: Need for efficient network management and enhanced security.
- Telecommunications Service Providers: Requirement for flexible network architectures to support 5G and other advanced services.
By Industry Vertical:
- Telecom and IT: High adoption rates due to the inherent need for advanced networking capabilities.
- BFSI: Focus on secure and reliable network infrastructure for financial transactions.
- Government and Defense: Demand for robust and secure network solutions for critical infrastructure.
Dominance Analysis:
The Telecom and IT sector demonstrates strong dominance owing to their proactive adoption of advanced technologies, substantial investment in network infrastructure, and a significant need for agile and scalable network solutions. Cloud service providers are closely following, demanding highly automated and scalable solutions to support their ever-growing infrastructure.
SDN Industry Product Developments
Recent advancements in SDN technology include the development of more sophisticated controllers with enhanced automation capabilities, improved network virtualization platforms, and better integration with cloud-based services. These innovations are driving greater efficiency, scalability, and security in network management. The market is witnessing increased adoption of open-source SDN solutions, fostering greater flexibility and customization options for users. This trend contributes to the wider adoption and increased competition in the market, fostering innovation and improved cost-efficiency.
Key Drivers of SDN Industry Growth
Several factors are propelling the growth of the SDN industry. Technological advancements, including the development of high-performance SDN controllers and network virtualization platforms, are driving increased efficiency and scalability. Economic factors, such as the decreasing cost of hardware and software, are making SDN solutions more accessible to a wider range of users. Furthermore, supportive regulatory frameworks in many regions are encouraging the deployment of SDN technologies. The growing demand for cloud services and the expansion of the Internet of Things (IoT) are also contributing factors.
Challenges in the SDN Industry Market
The SDN market faces certain challenges, including the complexity of integrating SDN solutions with existing network infrastructures, the need for skilled professionals to manage and maintain SDN networks, and the security concerns associated with managing a virtualized network. These challenges can lead to higher deployment costs and potential security vulnerabilities if not properly addressed. Supply chain disruptions can also impact the availability of essential components, affecting project timelines and budgets. Furthermore, intense competition from established players and emerging startups can limit profitability for some vendors.
Emerging Opportunities in SDN Industry
The SDN market presents several promising opportunities for growth. Technological breakthroughs, such as the development of AI-powered SDN controllers and the integration of SDN with edge computing, are expected to drive innovation and efficiency. Strategic partnerships between vendors and service providers are expanding market reach and driving adoption. Furthermore, the expansion of SDN into new markets, such as industrial automation and smart cities, presents significant growth potential.
Leading Players in the SDN Industry Sector
- HPE
- IBM Corporation
- Cisco Systems Inc
- Arista Network
- NEC Corporation
- Huawei Technologies Co Ltd
- Pluribus Network
- Big Switch Network
- AT&T Inc
- Intel Corporation
Key Milestones in SDN Industry Industry
- November 2022: Liquid Dataport launches a pan-African SDN service, expanding market reach in Africa.
- January 2023: Nokia's new SDN controller boosts BICS's network, showcasing advancements in 5G network slicing and intelligent bandwidth utilization.
Strategic Outlook for SDN Industry Market
The SDN market is poised for sustained growth, driven by ongoing technological advancements, increasing demand for agile and scalable networks, and expanding adoption across various industry verticals. Strategic partnerships, investments in research and development, and expansion into emerging markets will be key to success in this dynamic landscape. The market exhibits substantial potential for growth and presents compelling opportunities for businesses that can adapt to the changing technology landscape and meet the evolving needs of customers.
SDN Industry Segmentation
-
1. End User
- 1.1. Cloud Service Providers
- 1.2. Enterprises
- 1.3. Telecommunications Service Providers
-
2. Industry Vertical
- 2.1. Academia and Research
- 2.2. BFSI
- 2.3. Consumer Goods and Retail
- 2.4. Government and Defense
- 2.5. Manufacturing
- 2.6. Telecom and IT
- 2.7. Other Industry Verticals
SDN Industry Segmentation By Geography
-
1. North America
- 1.1. United States
- 1.2. Canada
-
2. Europe
- 2.1. United Kingdom
- 2.2. Germany
- 2.3. France
- 2.4. Rest of Europe
-
3. Asia Pacific
- 3.1. China
- 3.2. Japan
- 3.3. India
- 3.4. Rest of Asia Pacific
- 4. Latin America
- 5. Middle East
SDN Industry REPORT HIGHLIGHTS
| Aspects | Details |
|---|---|
| Study Period | 2019-2033 |
| Base Year | 2024 |
| Estimated Year | 2025 |
| Forecast Period | 2025-2033 |
| Historical Period | 2019-2024 |
| Growth Rate | CAGR of 30.75% from 2019-2033 |
| Segmentation |
|
Table of Contents
- 1. Introduction
- 1.1. Research Scope
- 1.2. Market Segmentation
- 1.3. Research Methodology
- 1.4. Definitions and Assumptions
- 2. Executive Summary
- 2.1. Introduction
- 3. Market Dynamics
- 3.1. Introduction
- 3.2. Market Drivers
- 3.2.1. Rising Adoption of Cloud; Trend of BYOD devices
- 3.3. Market Restrains
- 3.3.1. Concerns related to security
- 3.4. Market Trends
- 3.4.1. BFSI Sector is Benefitting from the Studied Market
- 4. Market Factor Analysis
- 4.1. Porters Five Forces
- 4.2. Supply/Value Chain
- 4.3. PESTEL analysis
- 4.4. Market Entropy
- 4.5. Patent/Trademark Analysis
- 5. Global SDN Industry Analysis, Insights and Forecast, 2019-2031
- 5.1. Market Analysis, Insights and Forecast - by End User
- 5.1.1. Cloud Service Providers
- 5.1.2. Enterprises
- 5.1.3. Telecommunications Service Providers
- 5.2. Market Analysis, Insights and Forecast - by Industry Vertical
- 5.2.1. Academia and Research
- 5.2.2. BFSI
- 5.2.3. Consumer Goods and Retail
- 5.2.4. Government and Defense
- 5.2.5. Manufacturing
- 5.2.6. Telecom and IT
- 5.2.7. Other Industry Verticals
- 5.3. Market Analysis, Insights and Forecast - by Region
- 5.3.1. North America
- 5.3.2. Europe
- 5.3.3. Asia Pacific
- 5.3.4. Latin America
- 5.3.5. Middle East
- 5.1. Market Analysis, Insights and Forecast - by End User
- 6. North America SDN Industry Analysis, Insights and Forecast, 2019-2031
- 6.1. Market Analysis, Insights and Forecast - by End User
- 6.1.1. Cloud Service Providers
- 6.1.2. Enterprises
- 6.1.3. Telecommunications Service Providers
- 6.2. Market Analysis, Insights and Forecast - by Industry Vertical
- 6.2.1. Academia and Research
- 6.2.2. BFSI
- 6.2.3. Consumer Goods and Retail
- 6.2.4. Government and Defense
- 6.2.5. Manufacturing
- 6.2.6. Telecom and IT
- 6.2.7. Other Industry Verticals
- 6.1. Market Analysis, Insights and Forecast - by End User
- 7. Europe SDN Industry Analysis, Insights and Forecast, 2019-2031
- 7.1. Market Analysis, Insights and Forecast - by End User
- 7.1.1. Cloud Service Providers
- 7.1.2. Enterprises
- 7.1.3. Telecommunications Service Providers
- 7.2. Market Analysis, Insights and Forecast - by Industry Vertical
- 7.2.1. Academia and Research
- 7.2.2. BFSI
- 7.2.3. Consumer Goods and Retail
- 7.2.4. Government and Defense
- 7.2.5. Manufacturing
- 7.2.6. Telecom and IT
- 7.2.7. Other Industry Verticals
- 7.1. Market Analysis, Insights and Forecast - by End User
- 8. Asia Pacific SDN Industry Analysis, Insights and Forecast, 2019-2031
- 8.1. Market Analysis, Insights and Forecast - by End User
- 8.1.1. Cloud Service Providers
- 8.1.2. Enterprises
- 8.1.3. Telecommunications Service Providers
- 8.2. Market Analysis, Insights and Forecast - by Industry Vertical
- 8.2.1. Academia and Research
- 8.2.2. BFSI
- 8.2.3. Consumer Goods and Retail
- 8.2.4. Government and Defense
- 8.2.5. Manufacturing
- 8.2.6. Telecom and IT
- 8.2.7. Other Industry Verticals
- 8.1. Market Analysis, Insights and Forecast - by End User
- 9. Latin America SDN Industry Analysis, Insights and Forecast, 2019-2031
- 9.1. Market Analysis, Insights and Forecast - by End User
- 9.1.1. Cloud Service Providers
- 9.1.2. Enterprises
- 9.1.3. Telecommunications Service Providers
- 9.2. Market Analysis, Insights and Forecast - by Industry Vertical
- 9.2.1. Academia and Research
- 9.2.2. BFSI
- 9.2.3. Consumer Goods and Retail
- 9.2.4. Government and Defense
- 9.2.5. Manufacturing
- 9.2.6. Telecom and IT
- 9.2.7. Other Industry Verticals
- 9.1. Market Analysis, Insights and Forecast - by End User
- 10. Middle East SDN Industry Analysis, Insights and Forecast, 2019-2031
- 10.1. Market Analysis, Insights and Forecast - by End User
- 10.1.1. Cloud Service Providers
- 10.1.2. Enterprises
- 10.1.3. Telecommunications Service Providers
- 10.2. Market Analysis, Insights and Forecast - by Industry Vertical
- 10.2.1. Academia and Research
- 10.2.2. BFSI
- 10.2.3. Consumer Goods and Retail
- 10.2.4. Government and Defense
- 10.2.5. Manufacturing
- 10.2.6. Telecom and IT
- 10.2.7. Other Industry Verticals
- 10.1. Market Analysis, Insights and Forecast - by End User
- 11. North America SDN Industry Analysis, Insights and Forecast, 2019-2031
- 11.1. Market Analysis, Insights and Forecast - By Country/Sub-region
- 11.1.1 United States
- 11.1.2 Canada
- 11.1.3 Mexico
- 12. Europe SDN Industry Analysis, Insights and Forecast, 2019-2031
- 12.1. Market Analysis, Insights and Forecast - By Country/Sub-region
- 12.1.1 Germany
- 12.1.2 United Kingdom
- 12.1.3 France
- 12.1.4 Spain
- 12.1.5 Italy
- 12.1.6 Spain
- 12.1.7 Belgium
- 12.1.8 Netherland
- 12.1.9 Nordics
- 12.1.10 Rest of Europe
- 13. Asia Pacific SDN Industry Analysis, Insights and Forecast, 2019-2031
- 13.1. Market Analysis, Insights and Forecast - By Country/Sub-region
- 13.1.1 China
- 13.1.2 Japan
- 13.1.3 India
- 13.1.4 South Korea
- 13.1.5 Southeast Asia
- 13.1.6 Australia
- 13.1.7 Indonesia
- 13.1.8 Phillipes
- 13.1.9 Singapore
- 13.1.10 Thailandc
- 13.1.11 Rest of Asia Pacific
- 14. South America SDN Industry Analysis, Insights and Forecast, 2019-2031
- 14.1. Market Analysis, Insights and Forecast - By Country/Sub-region
- 14.1.1 Brazil
- 14.1.2 Argentina
- 14.1.3 Peru
- 14.1.4 Chile
- 14.1.5 Colombia
- 14.1.6 Ecuador
- 14.1.7 Venezuela
- 14.1.8 Rest of South America
- 15. North America SDN Industry Analysis, Insights and Forecast, 2019-2031
- 15.1. Market Analysis, Insights and Forecast - By Country/Sub-region
- 15.1.1 United States
- 15.1.2 Canada
- 15.1.3 Mexico
- 16. MEA SDN Industry Analysis, Insights and Forecast, 2019-2031
- 16.1. Market Analysis, Insights and Forecast - By Country/Sub-region
- 16.1.1 United Arab Emirates
- 16.1.2 Saudi Arabia
- 16.1.3 South Africa
- 16.1.4 Rest of Middle East and Africa
- 17. Competitive Analysis
- 17.1. Global Market Share Analysis 2024
- 17.2. Company Profiles
- 17.2.1 HPE
- 17.2.1.1. Overview
- 17.2.1.2. Products
- 17.2.1.3. SWOT Analysis
- 17.2.1.4. Recent Developments
- 17.2.1.5. Financials (Based on Availability)
- 17.2.2 Plexxi Inc
- 17.2.2.1. Overview
- 17.2.2.2. Products
- 17.2.2.3. SWOT Analysis
- 17.2.2.4. Recent Developments
- 17.2.2.5. Financials (Based on Availability)
- 17.2.3 IBM Corporation
- 17.2.3.1. Overview
- 17.2.3.2. Products
- 17.2.3.3. SWOT Analysis
- 17.2.3.4. Recent Developments
- 17.2.3.5. Financials (Based on Availability)
- 17.2.4 Cisco Systems Inc
- 17.2.4.1. Overview
- 17.2.4.2. Products
- 17.2.4.3. SWOT Analysis
- 17.2.4.4. Recent Developments
- 17.2.4.5. Financials (Based on Availability)
- 17.2.5 Arista Network
- 17.2.5.1. Overview
- 17.2.5.2. Products
- 17.2.5.3. SWOT Analysis
- 17.2.5.4. Recent Developments
- 17.2.5.5. Financials (Based on Availability)
- 17.2.6 NEC Corporation
- 17.2.6.1. Overview
- 17.2.6.2. Products
- 17.2.6.3. SWOT Analysis
- 17.2.6.4. Recent Developments
- 17.2.6.5. Financials (Based on Availability)
- 17.2.7 Huawei Technologies Co Ltd
- 17.2.7.1. Overview
- 17.2.7.2. Products
- 17.2.7.3. SWOT Analysis
- 17.2.7.4. Recent Developments
- 17.2.7.5. Financials (Based on Availability)
- 17.2.8 Pluribus Network
- 17.2.8.1. Overview
- 17.2.8.2. Products
- 17.2.8.3. SWOT Analysis
- 17.2.8.4. Recent Developments
- 17.2.8.5. Financials (Based on Availability)
- 17.2.9 Big Switch Network
- 17.2.9.1. Overview
- 17.2.9.2. Products
- 17.2.9.3. SWOT Analysis
- 17.2.9.4. Recent Developments
- 17.2.9.5. Financials (Based on Availability)
- 17.2.10 AT&T Inc
- 17.2.10.1. Overview
- 17.2.10.2. Products
- 17.2.10.3. SWOT Analysis
- 17.2.10.4. Recent Developments
- 17.2.10.5. Financials (Based on Availability)
- 17.2.11 Intel Corporation
- 17.2.11.1. Overview
- 17.2.11.2. Products
- 17.2.11.3. SWOT Analysis
- 17.2.11.4. Recent Developments
- 17.2.11.5. Financials (Based on Availability)
- 17.2.1 HPE
List of Figures
- Figure 1: Global SDN Industry Revenue Breakdown (Million, %) by Region 2024 & 2032
- Figure 2: North America SDN Industry Revenue (Million), by Country 2024 & 2032
- Figure 3: North America SDN Industry Revenue Share (%), by Country 2024 & 2032
- Figure 4: Europe SDN Industry Revenue (Million), by Country 2024 & 2032
- Figure 5: Europe SDN Industry Revenue Share (%), by Country 2024 & 2032
- Figure 6: Asia Pacific SDN Industry Revenue (Million), by Country 2024 & 2032
- Figure 7: Asia Pacific SDN Industry Revenue Share (%), by Country 2024 & 2032
- Figure 8: South America SDN Industry Revenue (Million), by Country 2024 & 2032
- Figure 9: South America SDN Industry Revenue Share (%), by Country 2024 & 2032
- Figure 10: North America SDN Industry Revenue (Million), by Country 2024 & 2032
- Figure 11: North America SDN Industry Revenue Share (%), by Country 2024 & 2032
- Figure 12: MEA SDN Industry Revenue (Million), by Country 2024 & 2032
- Figure 13: MEA SDN Industry Revenue Share (%), by Country 2024 & 2032
- Figure 14: North America SDN Industry Revenue (Million), by End User 2024 & 2032
- Figure 15: North America SDN Industry Revenue Share (%), by End User 2024 & 2032
- Figure 16: North America SDN Industry Revenue (Million), by Industry Vertical 2024 & 2032
- Figure 17: North America SDN Industry Revenue Share (%), by Industry Vertical 2024 & 2032
- Figure 18: North America SDN Industry Revenue (Million), by Country 2024 & 2032
- Figure 19: North America SDN Industry Revenue Share (%), by Country 2024 & 2032
- Figure 20: Europe SDN Industry Revenue (Million), by End User 2024 & 2032
- Figure 21: Europe SDN Industry Revenue Share (%), by End User 2024 & 2032
- Figure 22: Europe SDN Industry Revenue (Million), by Industry Vertical 2024 & 2032
- Figure 23: Europe SDN Industry Revenue Share (%), by Industry Vertical 2024 & 2032
- Figure 24: Europe SDN Industry Revenue (Million), by Country 2024 & 2032
- Figure 25: Europe SDN Industry Revenue Share (%), by Country 2024 & 2032
- Figure 26: Asia Pacific SDN Industry Revenue (Million), by End User 2024 & 2032
- Figure 27: Asia Pacific SDN Industry Revenue Share (%), by End User 2024 & 2032
- Figure 28: Asia Pacific SDN Industry Revenue (Million), by Industry Vertical 2024 & 2032
- Figure 29: Asia Pacific SDN Industry Revenue Share (%), by Industry Vertical 2024 & 2032
- Figure 30: Asia Pacific SDN Industry Revenue (Million), by Country 2024 & 2032
- Figure 31: Asia Pacific SDN Industry Revenue Share (%), by Country 2024 & 2032
- Figure 32: Latin America SDN Industry Revenue (Million), by End User 2024 & 2032
- Figure 33: Latin America SDN Industry Revenue Share (%), by End User 2024 & 2032
- Figure 34: Latin America SDN Industry Revenue (Million), by Industry Vertical 2024 & 2032
- Figure 35: Latin America SDN Industry Revenue Share (%), by Industry Vertical 2024 & 2032
- Figure 36: Latin America SDN Industry Revenue (Million), by Country 2024 & 2032
- Figure 37: Latin America SDN Industry Revenue Share (%), by Country 2024 & 2032
- Figure 38: Middle East SDN Industry Revenue (Million), by End User 2024 & 2032
- Figure 39: Middle East SDN Industry Revenue Share (%), by End User 2024 & 2032
- Figure 40: Middle East SDN Industry Revenue (Million), by Industry Vertical 2024 & 2032
- Figure 41: Middle East SDN Industry Revenue Share (%), by Industry Vertical 2024 & 2032
- Figure 42: Middle East SDN Industry Revenue (Million), by Country 2024 & 2032
- Figure 43: Middle East SDN Industry Revenue Share (%), by Country 2024 & 2032
List of Tables
- Table 1: Global SDN Industry Revenue Million Forecast, by Region 2019 & 2032
- Table 2: Global SDN Industry Revenue Million Forecast, by End User 2019 & 2032
- Table 3: Global SDN Industry Revenue Million Forecast, by Industry Vertical 2019 & 2032
- Table 4: Global SDN Industry Revenue Million Forecast, by Region 2019 & 2032
- Table 5: Global SDN Industry Revenue Million Forecast, by Country 2019 & 2032
- Table 6: United States SDN Industry Revenue (Million) Forecast, by Application 2019 & 2032
- Table 7: Canada SDN Industry Revenue (Million) Forecast, by Application 2019 & 2032
- Table 8: Mexico SDN Industry Revenue (Million) Forecast, by Application 2019 & 2032
- Table 9: Global SDN Industry Revenue Million Forecast, by Country 2019 & 2032
- Table 10: Germany SDN Industry Revenue (Million) Forecast, by Application 2019 & 2032
- Table 11: United Kingdom SDN Industry Revenue (Million) Forecast, by Application 2019 & 2032
- Table 12: France SDN Industry Revenue (Million) Forecast, by Application 2019 & 2032
- Table 13: Spain SDN Industry Revenue (Million) Forecast, by Application 2019 & 2032
- Table 14: Italy SDN Industry Revenue (Million) Forecast, by Application 2019 & 2032
- Table 15: Spain SDN Industry Revenue (Million) Forecast, by Application 2019 & 2032
- Table 16: Belgium SDN Industry Revenue (Million) Forecast, by Application 2019 & 2032
- Table 17: Netherland SDN Industry Revenue (Million) Forecast, by Application 2019 & 2032
- Table 18: Nordics SDN Industry Revenue (Million) Forecast, by Application 2019 & 2032
- Table 19: Rest of Europe SDN Industry Revenue (Million) Forecast, by Application 2019 & 2032
- Table 20: Global SDN Industry Revenue Million Forecast, by Country 2019 & 2032
- Table 21: China SDN Industry Revenue (Million) Forecast, by Application 2019 & 2032
- Table 22: Japan SDN Industry Revenue (Million) Forecast, by Application 2019 & 2032
- Table 23: India SDN Industry Revenue (Million) Forecast, by Application 2019 & 2032
- Table 24: South Korea SDN Industry Revenue (Million) Forecast, by Application 2019 & 2032
- Table 25: Southeast Asia SDN Industry Revenue (Million) Forecast, by Application 2019 & 2032
- Table 26: Australia SDN Industry Revenue (Million) Forecast, by Application 2019 & 2032
- Table 27: Indonesia SDN Industry Revenue (Million) Forecast, by Application 2019 & 2032
- Table 28: Phillipes SDN Industry Revenue (Million) Forecast, by Application 2019 & 2032
- Table 29: Singapore SDN Industry Revenue (Million) Forecast, by Application 2019 & 2032
- Table 30: Thailandc SDN Industry Revenue (Million) Forecast, by Application 2019 & 2032
- Table 31: Rest of Asia Pacific SDN Industry Revenue (Million) Forecast, by Application 2019 & 2032
- Table 32: Global SDN Industry Revenue Million Forecast, by Country 2019 & 2032
- Table 33: Brazil SDN Industry Revenue (Million) Forecast, by Application 2019 & 2032
- Table 34: Argentina SDN Industry Revenue (Million) Forecast, by Application 2019 & 2032
- Table 35: Peru SDN Industry Revenue (Million) Forecast, by Application 2019 & 2032
- Table 36: Chile SDN Industry Revenue (Million) Forecast, by Application 2019 & 2032
- Table 37: Colombia SDN Industry Revenue (Million) Forecast, by Application 2019 & 2032
- Table 38: Ecuador SDN Industry Revenue (Million) Forecast, by Application 2019 & 2032
- Table 39: Venezuela SDN Industry Revenue (Million) Forecast, by Application 2019 & 2032
- Table 40: Rest of South America SDN Industry Revenue (Million) Forecast, by Application 2019 & 2032
- Table 41: Global SDN Industry Revenue Million Forecast, by Country 2019 & 2032
- Table 42: United States SDN Industry Revenue (Million) Forecast, by Application 2019 & 2032
- Table 43: Canada SDN Industry Revenue (Million) Forecast, by Application 2019 & 2032
- Table 44: Mexico SDN Industry Revenue (Million) Forecast, by Application 2019 & 2032
- Table 45: Global SDN Industry Revenue Million Forecast, by Country 2019 & 2032
- Table 46: United Arab Emirates SDN Industry Revenue (Million) Forecast, by Application 2019 & 2032
- Table 47: Saudi Arabia SDN Industry Revenue (Million) Forecast, by Application 2019 & 2032
- Table 48: South Africa SDN Industry Revenue (Million) Forecast, by Application 2019 & 2032
- Table 49: Rest of Middle East and Africa SDN Industry Revenue (Million) Forecast, by Application 2019 & 2032
- Table 50: Global SDN Industry Revenue Million Forecast, by End User 2019 & 2032
- Table 51: Global SDN Industry Revenue Million Forecast, by Industry Vertical 2019 & 2032
- Table 52: Global SDN Industry Revenue Million Forecast, by Country 2019 & 2032
- Table 53: United States SDN Industry Revenue (Million) Forecast, by Application 2019 & 2032
- Table 54: Canada SDN Industry Revenue (Million) Forecast, by Application 2019 & 2032
- Table 55: Global SDN Industry Revenue Million Forecast, by End User 2019 & 2032
- Table 56: Global SDN Industry Revenue Million Forecast, by Industry Vertical 2019 & 2032
- Table 57: Global SDN Industry Revenue Million Forecast, by Country 2019 & 2032
- Table 58: United Kingdom SDN Industry Revenue (Million) Forecast, by Application 2019 & 2032
- Table 59: Germany SDN Industry Revenue (Million) Forecast, by Application 2019 & 2032
- Table 60: France SDN Industry Revenue (Million) Forecast, by Application 2019 & 2032
- Table 61: Rest of Europe SDN Industry Revenue (Million) Forecast, by Application 2019 & 2032
- Table 62: Global SDN Industry Revenue Million Forecast, by End User 2019 & 2032
- Table 63: Global SDN Industry Revenue Million Forecast, by Industry Vertical 2019 & 2032
- Table 64: Global SDN Industry Revenue Million Forecast, by Country 2019 & 2032
- Table 65: China SDN Industry Revenue (Million) Forecast, by Application 2019 & 2032
- Table 66: Japan SDN Industry Revenue (Million) Forecast, by Application 2019 & 2032
- Table 67: India SDN Industry Revenue (Million) Forecast, by Application 2019 & 2032
- Table 68: Rest of Asia Pacific SDN Industry Revenue (Million) Forecast, by Application 2019 & 2032
- Table 69: Global SDN Industry Revenue Million Forecast, by End User 2019 & 2032
- Table 70: Global SDN Industry Revenue Million Forecast, by Industry Vertical 2019 & 2032
- Table 71: Global SDN Industry Revenue Million Forecast, by Country 2019 & 2032
- Table 72: Global SDN Industry Revenue Million Forecast, by End User 2019 & 2032
- Table 73: Global SDN Industry Revenue Million Forecast, by Industry Vertical 2019 & 2032
- Table 74: Global SDN Industry Revenue Million Forecast, by Country 2019 & 2032
Frequently Asked Questions
1. What is the projected Compound Annual Growth Rate (CAGR) of the SDN Industry?
The projected CAGR is approximately 30.75%.
2. Which companies are prominent players in the SDN Industry?
Key companies in the market include HPE, Plexxi Inc, IBM Corporation, Cisco Systems Inc, Arista Network, NEC Corporation, Huawei Technologies Co Ltd, Pluribus Network, Big Switch Network, AT&T Inc, Intel Corporation.
3. What are the main segments of the SDN Industry?
The market segments include End User, Industry Vertical.
4. Can you provide details about the market size?
The market size is estimated to be USD XX Million as of 2022.
5. What are some drivers contributing to market growth?
Rising Adoption of Cloud; Trend of BYOD devices.
6. What are the notable trends driving market growth?
BFSI Sector is Benefitting from the Studied Market.
7. Are there any restraints impacting market growth?
Concerns related to security.
8. Can you provide examples of recent developments in the market?
January 2023 - A new SDN (Software Defined Network) controller developed by Nokia has boosted the network of global communications platform provider BICS. The module will automate the network's traffic routing, enhancing user experience while laying the 5G network slicing framework. It will further guide intelligent bandwidth utilization across 5G networks, opening up new possibilities for meeting the growing connectivity requirements for enterprises. It will be used to schedule an activity at predefined times, such as calendaring bandwidth every month for a cloud data backup.
9. What pricing options are available for accessing the report?
Pricing options include single-user, multi-user, and enterprise licenses priced at USD 4750, USD 5250, and USD 8750 respectively.
10. Is the market size provided in terms of value or volume?
The market size is provided in terms of value, measured in Million.
11. Are there any specific market keywords associated with the report?
Yes, the market keyword associated with the report is "SDN Industry," which aids in identifying and referencing the specific market segment covered.
12. How do I determine which pricing option suits my needs best?
The pricing options vary based on user requirements and access needs. Individual users may opt for single-user licenses, while businesses requiring broader access may choose multi-user or enterprise licenses for cost-effective access to the report.
13. Are there any additional resources or data provided in the SDN Industry report?
While the report offers comprehensive insights, it's advisable to review the specific contents or supplementary materials provided to ascertain if additional resources or data are available.
14. How can I stay updated on further developments or reports in the SDN Industry?
To stay informed about further developments, trends, and reports in the SDN Industry, consider subscribing to industry newsletters, following relevant companies and organizations, or regularly checking reputable industry news sources and publications.
Methodology
Step 1 - Identification of Relevant Samples Size from Population Database


Step 2 - Approaches for Defining Global Market Size (Value, Volume* & Price*)

Note*: In applicable scenarios
Step 3 - Data Sources
Primary Research
- Web Analytics
- Survey Reports
- Research Institute
- Latest Research Reports
- Opinion Leaders
Secondary Research
- Annual Reports
- White Paper
- Latest Press Release
- Industry Association
- Paid Database
- Investor Presentations

Step 4 - Data Triangulation
Involves using different sources of information in order to increase the validity of a study
These sources are likely to be stakeholders in a program - participants, other researchers, program staff, other community members, and so on.
Then we put all data in single framework & apply various statistical tools to find out the dynamic on the market.
During the analysis stage, feedback from the stakeholder groups would be compared to determine areas of agreement as well as areas of divergence
