

Key Insights
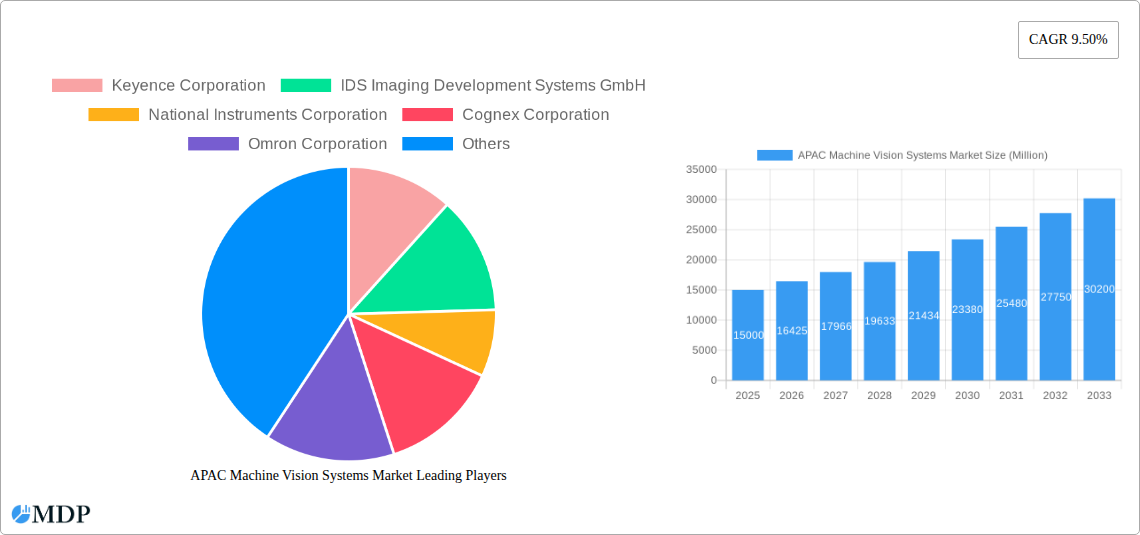
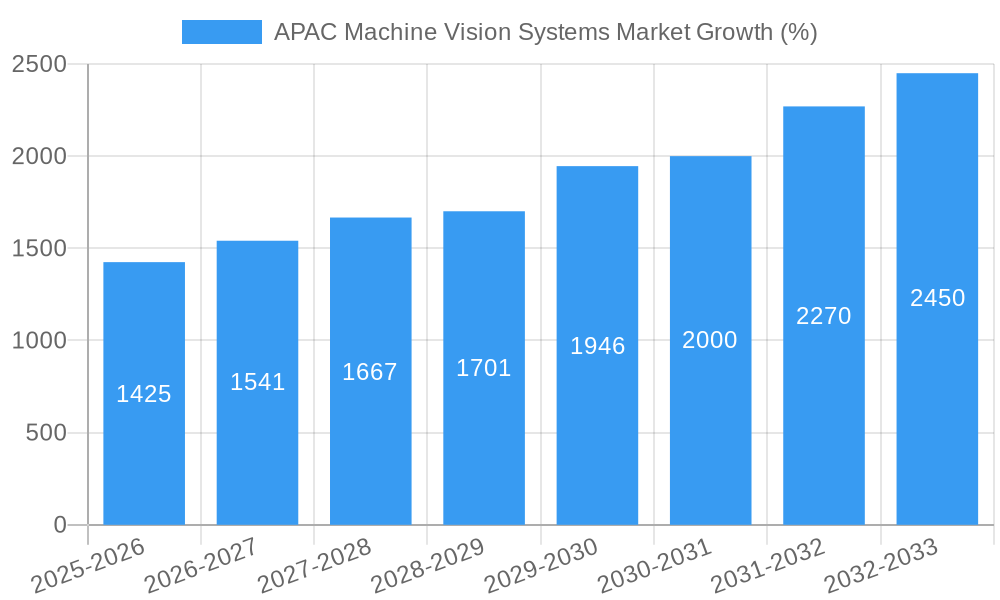
The Asia-Pacific (APAC) machine vision systems market is experiencing robust growth, driven by the increasing automation needs across diverse industries. The region's substantial manufacturing base, coupled with burgeoning technological advancements, is fueling demand for sophisticated machine vision solutions. A 9.50% CAGR indicates a significant expansion trajectory, projected to reach a substantial market value by 2033. Key growth drivers include the rising adoption of smart factories, Industry 4.0 initiatives, and the need for improved quality control and efficiency in manufacturing processes. The food and beverage, healthcare, and automotive sectors are particularly significant contributors, leveraging machine vision for tasks such as product inspection, robotic guidance, and process optimization. While China and India represent the largest markets within APAC, other nations like Japan and South Korea are also showing promising growth due to their strong technological capabilities and focus on automation. The market is segmented by product type (PC-based, smart camera-based), end-user industry, and component (hardware, software), providing diverse opportunities for market players. The prevalence of PC-based systems is currently high but the demand for smart camera-based systems is witnessing rapid growth due to their compact size and ease of integration. Competition is fierce, with established players like Keyence, Cognex, and Omron vying for market share alongside emerging innovative companies. Challenges include the high initial investment costs associated with implementing machine vision systems and the need for skilled personnel to operate and maintain these technologies. However, the long-term benefits in terms of increased productivity, reduced operational costs, and improved product quality are compelling factors driving continued market expansion.
The continued growth of the APAC machine vision systems market is expected to be sustained by several factors. Government initiatives promoting industrial automation and digital transformation across the region are playing a crucial role. Furthermore, the growing trend towards customized solutions tailored to specific industry needs and the development of advanced technologies like artificial intelligence and deep learning are opening new avenues for innovation. The integration of machine vision systems with other technologies, such as robotics and IoT, is also creating synergistic opportunities for growth. As the demand for higher-quality products and faster production speeds intensifies, the adoption of machine vision systems will become increasingly critical across diverse industries within APAC. The market is poised for continued expansion, with further segmentation and specialization expected to emerge in response to evolving industry needs and technological advancements. The competitive landscape will remain dynamic, with both established players and new entrants striving to capture market share by offering innovative solutions and adapting to the evolving demands of the market.
APAC Machine Vision Systems Market: A Comprehensive Report (2019-2033)
This in-depth report provides a comprehensive analysis of the Asia-Pacific (APAC) Machine Vision Systems market, covering market dynamics, industry trends, leading segments, key players, and future growth prospects. The study period spans from 2019 to 2033, with 2025 serving as the base and estimated year. The report projects robust growth, offering valuable insights for stakeholders including manufacturers, investors, and industry professionals. The market is expected to reach xx Million by 2033, exhibiting a CAGR of xx% during the forecast period (2025-2033).
APAC Machine Vision Systems Market Dynamics & Concentration
The APAC machine vision systems market is characterized by a moderately concentrated landscape, with key players like Keyence Corporation, Cognex Corporation, and Omron Corporation holding significant market share. Market concentration is influenced by factors such as technological advancements, stringent regulatory frameworks (particularly in industries like food and pharmaceuticals), and the increasing adoption of automation across various end-user sectors. Innovation plays a crucial role, driving the development of advanced AI-powered systems and the integration of machine vision into smart manufacturing initiatives. The prevalence of product substitutes, such as manual inspection methods, is gradually decreasing due to the increasing cost-effectiveness and efficiency of machine vision systems. End-user trends, such as the rising demand for improved quality control and traceability in industries like food and beverage, are fueling market growth. M&A activity in the sector remains relatively moderate, with an estimated xx M&A deals concluded in the historical period (2019-2024), primarily focused on enhancing technological capabilities and expanding market reach. This resulted in a market share distribution approximately as follows (estimated):
- Keyence Corporation: xx%
- Cognex Corporation: xx%
- Omron Corporation: xx%
- Others: xx%
APAC Machine Vision Systems Market Industry Trends & Analysis
The APAC machine vision systems market is experiencing significant growth, driven by several key factors. The rising adoption of automation across various industries, particularly in manufacturing and logistics, is a major driver. The increasing demand for improved product quality and efficiency is pushing companies to adopt machine vision systems for precise quality control and process optimization. Technological advancements, such as the development of AI-powered vision systems and the integration of advanced image processing techniques, are further accelerating market growth. Consumer preferences for higher-quality products and faster delivery times are placing pressure on manufacturers to adopt advanced technologies, including machine vision. Competitive dynamics are shaped by continuous innovation and the emergence of new players offering specialized solutions. This has resulted in a market exhibiting a CAGR of xx% during the historical period (2019-2024), with market penetration increasing significantly in key sectors like electronics and automotive. The forecast period (2025-2033) projects similar growth trajectory, driven by the expanding application of machine vision in emerging sectors like robotics and smart agriculture. The market penetration in the forecast period is expected to be xx%.
Leading Markets & Segments in APAC Machine Vision Systems Market
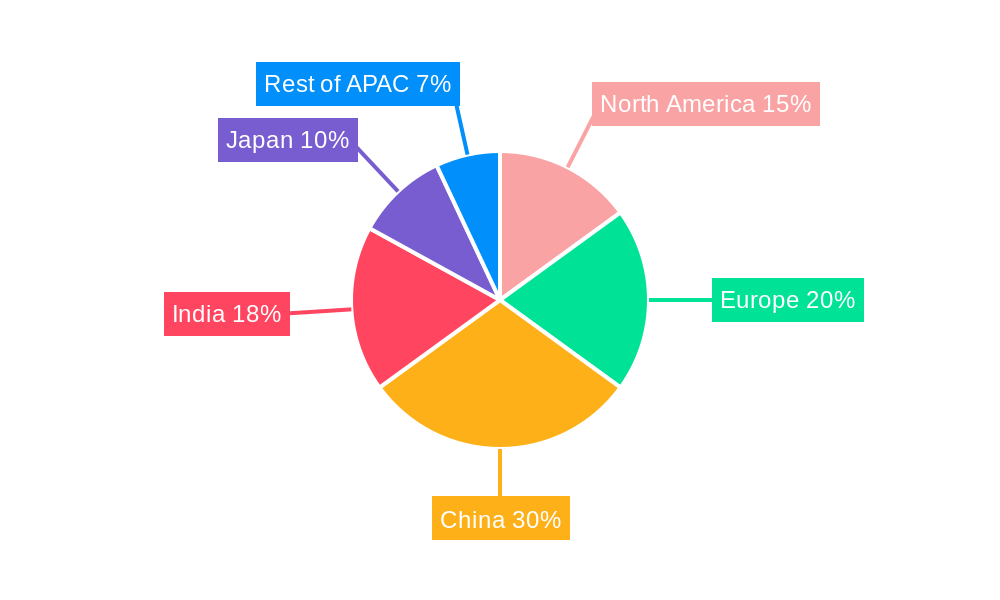
China and Japan are the dominant markets in the APAP region for machine vision systems, driven by robust industrial growth, significant investments in automation, and the presence of major technology hubs. India is also emerging as a significant market, fueled by its growing manufacturing sector and increasing adoption of advanced technologies.
Dominant Regions/Countries:
- China: Strong manufacturing base, government initiatives supporting automation.
- Japan: Advanced technological capabilities, high adoption rates in automotive and electronics.
- India: Rapid industrialization, rising demand for quality control.
Dominant Segments:
- Product: Smart Camera-based systems are gaining popularity due to their ease of use and cost-effectiveness.
- End-User Industry: The automotive, electronics, and semiconductors industries are major consumers due to high-precision requirements and high production volumes. Food and beverage is also showing strong growth.
- Component: Hardware constitutes the largest segment, while software is witnessing robust growth.
APAC Machine Vision Systems Market Product Developments
Recent product developments focus on incorporating advanced AI capabilities, enabling automated defect detection and sophisticated image analysis. These systems offer improved accuracy, reduced reliance on human inspection, and increased efficiency. Smart cameras are gaining market share due to their compact design and ease of integration into existing production lines. The integration of machine learning algorithms is enhancing the ability of vision systems to adapt to changing conditions and improve defect detection accuracy over time. The focus is on developing user-friendly interfaces and modular designs that are easily customizable to diverse applications.
Key Drivers of APAC Machine Vision Systems Market Growth
Several factors are driving the growth of the APAC machine vision systems market:
- Technological Advancements: The development of AI-powered vision systems, higher-resolution cameras, and improved image processing algorithms.
- Increasing Automation: The rising demand for automation across various industries, particularly in manufacturing and logistics, fuels the adoption of machine vision systems.
- Government Initiatives: supportive policies in countries like China and India promote the adoption of advanced technologies, including machine vision.
Challenges in the APAC Machine Vision Systems Market
Despite strong growth potential, the APAC machine vision systems market faces several challenges:
- High Initial Investment Costs: The high cost of implementing machine vision systems can deter smaller companies from adopting the technology.
- Lack of Skilled Workforce: A shortage of skilled professionals capable of installing, configuring, and maintaining these complex systems remains a barrier.
- Competition: Intense competition among established players and the emergence of new entrants can create pricing pressure.
Emerging Opportunities in APAC Machine Vision Systems Market
The APAC machine vision systems market presents significant opportunities for long-term growth, driven by:
- Expansion into New Applications: The adoption of machine vision in emerging sectors like healthcare and smart agriculture.
- Strategic Partnerships: Collaborations between machine vision companies and system integrators can broaden market reach and accelerate deployment.
- Technological Innovation: Continued development of AI-based vision systems and the integration of advanced analytics capabilities will unlock new applications and increase market value.
Leading Players in the APAC Machine Vision Systems Market Sector
- Keyence Corporation
- IDS Imaging Development Systems GmbH
- National Instruments Corporation
- Cognex Corporation
- Omron Corporation
- Uss Vision Inc
- Perceptron Inc
- Teledyne DALSA
- Datalogic SpA
- Basler AG
Key Milestones in APAC Machine Vision Systems Market Industry
- September 2020: Omron introduced the FH Series Vision system featuring industry-first defect detection AI, automating visual inspection without sample learning. This significantly impacted market dynamics by highlighting AI's role in enhancing inspection efficiency and accuracy.
Strategic Outlook for APAC Machine Vision Systems Market
The APAC machine vision systems market is poised for significant growth, driven by ongoing technological advancements, increasing automation across industries, and supportive government policies. Strategic opportunities lie in developing AI-powered solutions, expanding into new applications, and forging strategic partnerships to broaden market reach. Focusing on user-friendly interfaces and cost-effective solutions will be key to driving wider adoption, particularly among smaller companies. The market is expected to experience robust growth throughout the forecast period (2025-2033), presenting significant potential for stakeholders who can adapt to evolving market demands and technological advancements.
APAC Machine Vision Systems Market Segmentation
-
1. Component
-
1.1. Hardware
- 1.1.1. Vision Systems
- 1.1.2. Cameras
- 1.1.3. Optics and Illumination Systems
- 1.1.4. Frame Grabber
- 1.1.5. Other Types of Hardware
- 1.2. Software
-
1.1. Hardware
-
2. Product
- 2.1. PC-based
- 2.2. Smart Camera-based
-
3. End-User Industry
- 3.1. Food and Beverage
- 3.2. Healthcare and Pharmaceutical
- 3.3. Logistic and Retail
- 3.4. Automotive
- 3.5. Electronics and Semiconductors
- 3.6. Other End-User Industries
APAC Machine Vision Systems Market Segmentation By Geography
-
1. Asia Pacific
- 1.1. China
- 1.2. India
- 1.3. Japan
- 1.4. South Korea
- 1.5. ASEAN
- 1.6. Oceania
- 1.7. Rest of Asia Pacific
APAC Machine Vision Systems Market REPORT HIGHLIGHTS
| Aspects | Details |
|---|---|
| Study Period | 2019-2033 |
| Base Year | 2024 |
| Estimated Year | 2025 |
| Forecast Period | 2025-2033 |
| Historical Period | 2019-2024 |
| Growth Rate | CAGR of 9.50% from 2019-2033 |
| Segmentation |
|
Table of Contents
- 1. Introduction
- 1.1. Research Scope
- 1.2. Market Segmentation
- 1.3. Research Methodology
- 1.4. Definitions and Assumptions
- 2. Executive Summary
- 2.1. Introduction
- 3. Market Dynamics
- 3.1. Introduction
- 3.2. Market Drivers
- 3.2.1. Increased Demand for Smart Factories; Rising Demand for Accurate Defect Detection
- 3.3. Market Restrains
- 3.3.1. Scarcity of Flexible Machine Vision Solutions
- 3.4. Market Trends
- 3.4.1. Smart Camera-based Expected to Witness Significant Growth
- 4. Market Factor Analysis
- 4.1. Porters Five Forces
- 4.2. Supply/Value Chain
- 4.3. PESTEL analysis
- 4.4. Market Entropy
- 4.5. Patent/Trademark Analysis
- 5. Global APAC Machine Vision Systems Market Analysis, Insights and Forecast, 2019-2031
- 5.1. Market Analysis, Insights and Forecast - by Component
- 5.1.1. Hardware
- 5.1.1.1. Vision Systems
- 5.1.1.2. Cameras
- 5.1.1.3. Optics and Illumination Systems
- 5.1.1.4. Frame Grabber
- 5.1.1.5. Other Types of Hardware
- 5.1.2. Software
- 5.1.1. Hardware
- 5.2. Market Analysis, Insights and Forecast - by Product
- 5.2.1. PC-based
- 5.2.2. Smart Camera-based
- 5.3. Market Analysis, Insights and Forecast - by End-User Industry
- 5.3.1. Food and Beverage
- 5.3.2. Healthcare and Pharmaceutical
- 5.3.3. Logistic and Retail
- 5.3.4. Automotive
- 5.3.5. Electronics and Semiconductors
- 5.3.6. Other End-User Industries
- 5.4. Market Analysis, Insights and Forecast - by Region
- 5.4.1. Asia Pacific
- 5.1. Market Analysis, Insights and Forecast - by Component
- 6. North America APAC Machine Vision Systems Market Analysis, Insights and Forecast, 2019-2031
- 6.1. Market Analysis, Insights and Forecast - By Country/Sub-region
- 6.1.1 United States
- 6.1.2 Canada
- 7. Europe APAC Machine Vision Systems Market Analysis, Insights and Forecast, 2019-2031
- 7.1. Market Analysis, Insights and Forecast - By Country/Sub-region
- 7.1.1 Germany
- 7.1.2 United Kingdom
- 7.1.3 France
- 7.1.4 Italy
- 7.1.5 Spain
- 8. Asia APAC Machine Vision Systems Market Analysis, Insights and Forecast, 2019-2031
- 8.1. Market Analysis, Insights and Forecast - By Country/Sub-region
- 8.1.1 China
- 8.1.2 Japan
- 8.1.3 South Korea
- 8.1.4 India
- 9. Australia and New Zealand APAC Machine Vision Systems Market Analysis, Insights and Forecast, 2019-2031
- 9.1. Market Analysis, Insights and Forecast - By Country/Sub-region
- 9.1.1.
- 10. Competitive Analysis
- 10.1. Global Market Share Analysis 2024
- 10.2. Company Profiles
- 10.2.1 Keyence Corporation
- 10.2.1.1. Overview
- 10.2.1.2. Products
- 10.2.1.3. SWOT Analysis
- 10.2.1.4. Recent Developments
- 10.2.1.5. Financials (Based on Availability)
- 10.2.2 IDS Imaging Development Systems GmbH
- 10.2.2.1. Overview
- 10.2.2.2. Products
- 10.2.2.3. SWOT Analysis
- 10.2.2.4. Recent Developments
- 10.2.2.5. Financials (Based on Availability)
- 10.2.3 National Instruments Corporation
- 10.2.3.1. Overview
- 10.2.3.2. Products
- 10.2.3.3. SWOT Analysis
- 10.2.3.4. Recent Developments
- 10.2.3.5. Financials (Based on Availability)
- 10.2.4 Cognex Corporation
- 10.2.4.1. Overview
- 10.2.4.2. Products
- 10.2.4.3. SWOT Analysis
- 10.2.4.4. Recent Developments
- 10.2.4.5. Financials (Based on Availability)
- 10.2.5 Omron Corporation
- 10.2.5.1. Overview
- 10.2.5.2. Products
- 10.2.5.3. SWOT Analysis
- 10.2.5.4. Recent Developments
- 10.2.5.5. Financials (Based on Availability)
- 10.2.6 Uss Vision Inc
- 10.2.6.1. Overview
- 10.2.6.2. Products
- 10.2.6.3. SWOT Analysis
- 10.2.6.4. Recent Developments
- 10.2.6.5. Financials (Based on Availability)
- 10.2.7 Perceptron Inc
- 10.2.7.1. Overview
- 10.2.7.2. Products
- 10.2.7.3. SWOT Analysis
- 10.2.7.4. Recent Developments
- 10.2.7.5. Financials (Based on Availability)
- 10.2.8 Teledyne DALSA
- 10.2.8.1. Overview
- 10.2.8.2. Products
- 10.2.8.3. SWOT Analysis
- 10.2.8.4. Recent Developments
- 10.2.8.5. Financials (Based on Availability)
- 10.2.9 Datalogic SpA
- 10.2.9.1. Overview
- 10.2.9.2. Products
- 10.2.9.3. SWOT Analysis
- 10.2.9.4. Recent Developments
- 10.2.9.5. Financials (Based on Availability)
- 10.2.10 Basler AG
- 10.2.10.1. Overview
- 10.2.10.2. Products
- 10.2.10.3. SWOT Analysis
- 10.2.10.4. Recent Developments
- 10.2.10.5. Financials (Based on Availability)
- 10.2.1 Keyence Corporation
List of Figures
- Figure 1: Global APAC Machine Vision Systems Market Revenue Breakdown (Million, %) by Region 2024 & 2032
- Figure 2: Global APAC Machine Vision Systems Market Volume Breakdown (K Unit, %) by Region 2024 & 2032
- Figure 3: North America APAC Machine Vision Systems Market Revenue (Million), by Country 2024 & 2032
- Figure 4: North America APAC Machine Vision Systems Market Volume (K Unit), by Country 2024 & 2032
- Figure 5: North America APAC Machine Vision Systems Market Revenue Share (%), by Country 2024 & 2032
- Figure 6: North America APAC Machine Vision Systems Market Volume Share (%), by Country 2024 & 2032
- Figure 7: Europe APAC Machine Vision Systems Market Revenue (Million), by Country 2024 & 2032
- Figure 8: Europe APAC Machine Vision Systems Market Volume (K Unit), by Country 2024 & 2032
- Figure 9: Europe APAC Machine Vision Systems Market Revenue Share (%), by Country 2024 & 2032
- Figure 10: Europe APAC Machine Vision Systems Market Volume Share (%), by Country 2024 & 2032
- Figure 11: Asia APAC Machine Vision Systems Market Revenue (Million), by Country 2024 & 2032
- Figure 12: Asia APAC Machine Vision Systems Market Volume (K Unit), by Country 2024 & 2032
- Figure 13: Asia APAC Machine Vision Systems Market Revenue Share (%), by Country 2024 & 2032
- Figure 14: Asia APAC Machine Vision Systems Market Volume Share (%), by Country 2024 & 2032
- Figure 15: Australia and New Zealand APAC Machine Vision Systems Market Revenue (Million), by Country 2024 & 2032
- Figure 16: Australia and New Zealand APAC Machine Vision Systems Market Volume (K Unit), by Country 2024 & 2032
- Figure 17: Australia and New Zealand APAC Machine Vision Systems Market Revenue Share (%), by Country 2024 & 2032
- Figure 18: Australia and New Zealand APAC Machine Vision Systems Market Volume Share (%), by Country 2024 & 2032
- Figure 19: Asia Pacific APAC Machine Vision Systems Market Revenue (Million), by Component 2024 & 2032
- Figure 20: Asia Pacific APAC Machine Vision Systems Market Volume (K Unit), by Component 2024 & 2032
- Figure 21: Asia Pacific APAC Machine Vision Systems Market Revenue Share (%), by Component 2024 & 2032
- Figure 22: Asia Pacific APAC Machine Vision Systems Market Volume Share (%), by Component 2024 & 2032
- Figure 23: Asia Pacific APAC Machine Vision Systems Market Revenue (Million), by Product 2024 & 2032
- Figure 24: Asia Pacific APAC Machine Vision Systems Market Volume (K Unit), by Product 2024 & 2032
- Figure 25: Asia Pacific APAC Machine Vision Systems Market Revenue Share (%), by Product 2024 & 2032
- Figure 26: Asia Pacific APAC Machine Vision Systems Market Volume Share (%), by Product 2024 & 2032
- Figure 27: Asia Pacific APAC Machine Vision Systems Market Revenue (Million), by End-User Industry 2024 & 2032
- Figure 28: Asia Pacific APAC Machine Vision Systems Market Volume (K Unit), by End-User Industry 2024 & 2032
- Figure 29: Asia Pacific APAC Machine Vision Systems Market Revenue Share (%), by End-User Industry 2024 & 2032
- Figure 30: Asia Pacific APAC Machine Vision Systems Market Volume Share (%), by End-User Industry 2024 & 2032
- Figure 31: Asia Pacific APAC Machine Vision Systems Market Revenue (Million), by Country 2024 & 2032
- Figure 32: Asia Pacific APAC Machine Vision Systems Market Volume (K Unit), by Country 2024 & 2032
- Figure 33: Asia Pacific APAC Machine Vision Systems Market Revenue Share (%), by Country 2024 & 2032
- Figure 34: Asia Pacific APAC Machine Vision Systems Market Volume Share (%), by Country 2024 & 2032
List of Tables
- Table 1: Global APAC Machine Vision Systems Market Revenue Million Forecast, by Region 2019 & 2032
- Table 2: Global APAC Machine Vision Systems Market Volume K Unit Forecast, by Region 2019 & 2032
- Table 3: Global APAC Machine Vision Systems Market Revenue Million Forecast, by Component 2019 & 2032
- Table 4: Global APAC Machine Vision Systems Market Volume K Unit Forecast, by Component 2019 & 2032
- Table 5: Global APAC Machine Vision Systems Market Revenue Million Forecast, by Product 2019 & 2032
- Table 6: Global APAC Machine Vision Systems Market Volume K Unit Forecast, by Product 2019 & 2032
- Table 7: Global APAC Machine Vision Systems Market Revenue Million Forecast, by End-User Industry 2019 & 2032
- Table 8: Global APAC Machine Vision Systems Market Volume K Unit Forecast, by End-User Industry 2019 & 2032
- Table 9: Global APAC Machine Vision Systems Market Revenue Million Forecast, by Region 2019 & 2032
- Table 10: Global APAC Machine Vision Systems Market Volume K Unit Forecast, by Region 2019 & 2032
- Table 11: Global APAC Machine Vision Systems Market Revenue Million Forecast, by Country 2019 & 2032
- Table 12: Global APAC Machine Vision Systems Market Volume K Unit Forecast, by Country 2019 & 2032
- Table 13: United States APAC Machine Vision Systems Market Revenue (Million) Forecast, by Application 2019 & 2032
- Table 14: United States APAC Machine Vision Systems Market Volume (K Unit) Forecast, by Application 2019 & 2032
- Table 15: Canada APAC Machine Vision Systems Market Revenue (Million) Forecast, by Application 2019 & 2032
- Table 16: Canada APAC Machine Vision Systems Market Volume (K Unit) Forecast, by Application 2019 & 2032
- Table 17: Global APAC Machine Vision Systems Market Revenue Million Forecast, by Country 2019 & 2032
- Table 18: Global APAC Machine Vision Systems Market Volume K Unit Forecast, by Country 2019 & 2032
- Table 19: Germany APAC Machine Vision Systems Market Revenue (Million) Forecast, by Application 2019 & 2032
- Table 20: Germany APAC Machine Vision Systems Market Volume (K Unit) Forecast, by Application 2019 & 2032
- Table 21: United Kingdom APAC Machine Vision Systems Market Revenue (Million) Forecast, by Application 2019 & 2032
- Table 22: United Kingdom APAC Machine Vision Systems Market Volume (K Unit) Forecast, by Application 2019 & 2032
- Table 23: France APAC Machine Vision Systems Market Revenue (Million) Forecast, by Application 2019 & 2032
- Table 24: France APAC Machine Vision Systems Market Volume (K Unit) Forecast, by Application 2019 & 2032
- Table 25: Italy APAC Machine Vision Systems Market Revenue (Million) Forecast, by Application 2019 & 2032
- Table 26: Italy APAC Machine Vision Systems Market Volume (K Unit) Forecast, by Application 2019 & 2032
- Table 27: Spain APAC Machine Vision Systems Market Revenue (Million) Forecast, by Application 2019 & 2032
- Table 28: Spain APAC Machine Vision Systems Market Volume (K Unit) Forecast, by Application 2019 & 2032
- Table 29: Global APAC Machine Vision Systems Market Revenue Million Forecast, by Country 2019 & 2032
- Table 30: Global APAC Machine Vision Systems Market Volume K Unit Forecast, by Country 2019 & 2032
- Table 31: China APAC Machine Vision Systems Market Revenue (Million) Forecast, by Application 2019 & 2032
- Table 32: China APAC Machine Vision Systems Market Volume (K Unit) Forecast, by Application 2019 & 2032
- Table 33: Japan APAC Machine Vision Systems Market Revenue (Million) Forecast, by Application 2019 & 2032
- Table 34: Japan APAC Machine Vision Systems Market Volume (K Unit) Forecast, by Application 2019 & 2032
- Table 35: South Korea APAC Machine Vision Systems Market Revenue (Million) Forecast, by Application 2019 & 2032
- Table 36: South Korea APAC Machine Vision Systems Market Volume (K Unit) Forecast, by Application 2019 & 2032
- Table 37: India APAC Machine Vision Systems Market Revenue (Million) Forecast, by Application 2019 & 2032
- Table 38: India APAC Machine Vision Systems Market Volume (K Unit) Forecast, by Application 2019 & 2032
- Table 39: Global APAC Machine Vision Systems Market Revenue Million Forecast, by Country 2019 & 2032
- Table 40: Global APAC Machine Vision Systems Market Volume K Unit Forecast, by Country 2019 & 2032
- Table 41: APAC Machine Vision Systems Market Revenue (Million) Forecast, by Application 2019 & 2032
- Table 42: APAC Machine Vision Systems Market Volume (K Unit) Forecast, by Application 2019 & 2032
- Table 43: Global APAC Machine Vision Systems Market Revenue Million Forecast, by Component 2019 & 2032
- Table 44: Global APAC Machine Vision Systems Market Volume K Unit Forecast, by Component 2019 & 2032
- Table 45: Global APAC Machine Vision Systems Market Revenue Million Forecast, by Product 2019 & 2032
- Table 46: Global APAC Machine Vision Systems Market Volume K Unit Forecast, by Product 2019 & 2032
- Table 47: Global APAC Machine Vision Systems Market Revenue Million Forecast, by End-User Industry 2019 & 2032
- Table 48: Global APAC Machine Vision Systems Market Volume K Unit Forecast, by End-User Industry 2019 & 2032
- Table 49: Global APAC Machine Vision Systems Market Revenue Million Forecast, by Country 2019 & 2032
- Table 50: Global APAC Machine Vision Systems Market Volume K Unit Forecast, by Country 2019 & 2032
- Table 51: China APAC Machine Vision Systems Market Revenue (Million) Forecast, by Application 2019 & 2032
- Table 52: China APAC Machine Vision Systems Market Volume (K Unit) Forecast, by Application 2019 & 2032
- Table 53: India APAC Machine Vision Systems Market Revenue (Million) Forecast, by Application 2019 & 2032
- Table 54: India APAC Machine Vision Systems Market Volume (K Unit) Forecast, by Application 2019 & 2032
- Table 55: Japan APAC Machine Vision Systems Market Revenue (Million) Forecast, by Application 2019 & 2032
- Table 56: Japan APAC Machine Vision Systems Market Volume (K Unit) Forecast, by Application 2019 & 2032
- Table 57: South Korea APAC Machine Vision Systems Market Revenue (Million) Forecast, by Application 2019 & 2032
- Table 58: South Korea APAC Machine Vision Systems Market Volume (K Unit) Forecast, by Application 2019 & 2032
- Table 59: ASEAN APAC Machine Vision Systems Market Revenue (Million) Forecast, by Application 2019 & 2032
- Table 60: ASEAN APAC Machine Vision Systems Market Volume (K Unit) Forecast, by Application 2019 & 2032
- Table 61: Oceania APAC Machine Vision Systems Market Revenue (Million) Forecast, by Application 2019 & 2032
- Table 62: Oceania APAC Machine Vision Systems Market Volume (K Unit) Forecast, by Application 2019 & 2032
- Table 63: Rest of Asia Pacific APAC Machine Vision Systems Market Revenue (Million) Forecast, by Application 2019 & 2032
- Table 64: Rest of Asia Pacific APAC Machine Vision Systems Market Volume (K Unit) Forecast, by Application 2019 & 2032
Frequently Asked Questions
1. What is the projected Compound Annual Growth Rate (CAGR) of the APAC Machine Vision Systems Market?
The projected CAGR is approximately 9.50%.
2. Which companies are prominent players in the APAC Machine Vision Systems Market?
Key companies in the market include Keyence Corporation, IDS Imaging Development Systems GmbH, National Instruments Corporation, Cognex Corporation, Omron Corporation, Uss Vision Inc, Perceptron Inc, Teledyne DALSA, Datalogic SpA, Basler AG.
3. What are the main segments of the APAC Machine Vision Systems Market?
The market segments include Component, Product, End-User Industry.
4. Can you provide details about the market size?
The market size is estimated to be USD XX Million as of 2022.
5. What are some drivers contributing to market growth?
Increased Demand for Smart Factories; Rising Demand for Accurate Defect Detection.
6. What are the notable trends driving market growth?
Smart Camera-based Expected to Witness Significant Growth.
7. Are there any restraints impacting market growth?
Scarcity of Flexible Machine Vision Solutions.
8. Can you provide examples of recent developments in the market?
September 2020 - Omron introduced a new FH Series Vision system, which includes the industry's first defect detection AI technology, which detects defects without learning samples. The artificial intelligence technology, which attempts to simulate sensibility and skilled inspector techniques, reliably detects previously complex defects, automating human vision-based visual inspection.
9. What pricing options are available for accessing the report?
Pricing options include single-user, multi-user, and enterprise licenses priced at USD 4750, USD 4950, and USD 6800 respectively.
10. Is the market size provided in terms of value or volume?
The market size is provided in terms of value, measured in Million and volume, measured in K Unit.
11. Are there any specific market keywords associated with the report?
Yes, the market keyword associated with the report is "APAC Machine Vision Systems Market," which aids in identifying and referencing the specific market segment covered.
12. How do I determine which pricing option suits my needs best?
The pricing options vary based on user requirements and access needs. Individual users may opt for single-user licenses, while businesses requiring broader access may choose multi-user or enterprise licenses for cost-effective access to the report.
13. Are there any additional resources or data provided in the APAC Machine Vision Systems Market report?
While the report offers comprehensive insights, it's advisable to review the specific contents or supplementary materials provided to ascertain if additional resources or data are available.
14. How can I stay updated on further developments or reports in the APAC Machine Vision Systems Market?
To stay informed about further developments, trends, and reports in the APAC Machine Vision Systems Market, consider subscribing to industry newsletters, following relevant companies and organizations, or regularly checking reputable industry news sources and publications.
Methodology
Step 1 - Identification of Relevant Samples Size from Population Database


Step 2 - Approaches for Defining Global Market Size (Value, Volume* & Price*)

Note*: In applicable scenarios
Step 3 - Data Sources
Primary Research
- Web Analytics
- Survey Reports
- Research Institute
- Latest Research Reports
- Opinion Leaders
Secondary Research
- Annual Reports
- White Paper
- Latest Press Release
- Industry Association
- Paid Database
- Investor Presentations

Step 4 - Data Triangulation
Involves using different sources of information in order to increase the validity of a study
These sources are likely to be stakeholders in a program - participants, other researchers, program staff, other community members, and so on.
Then we put all data in single framework & apply various statistical tools to find out the dynamic on the market.
During the analysis stage, feedback from the stakeholder groups would be compared to determine areas of agreement as well as areas of divergence
