

Key Insights
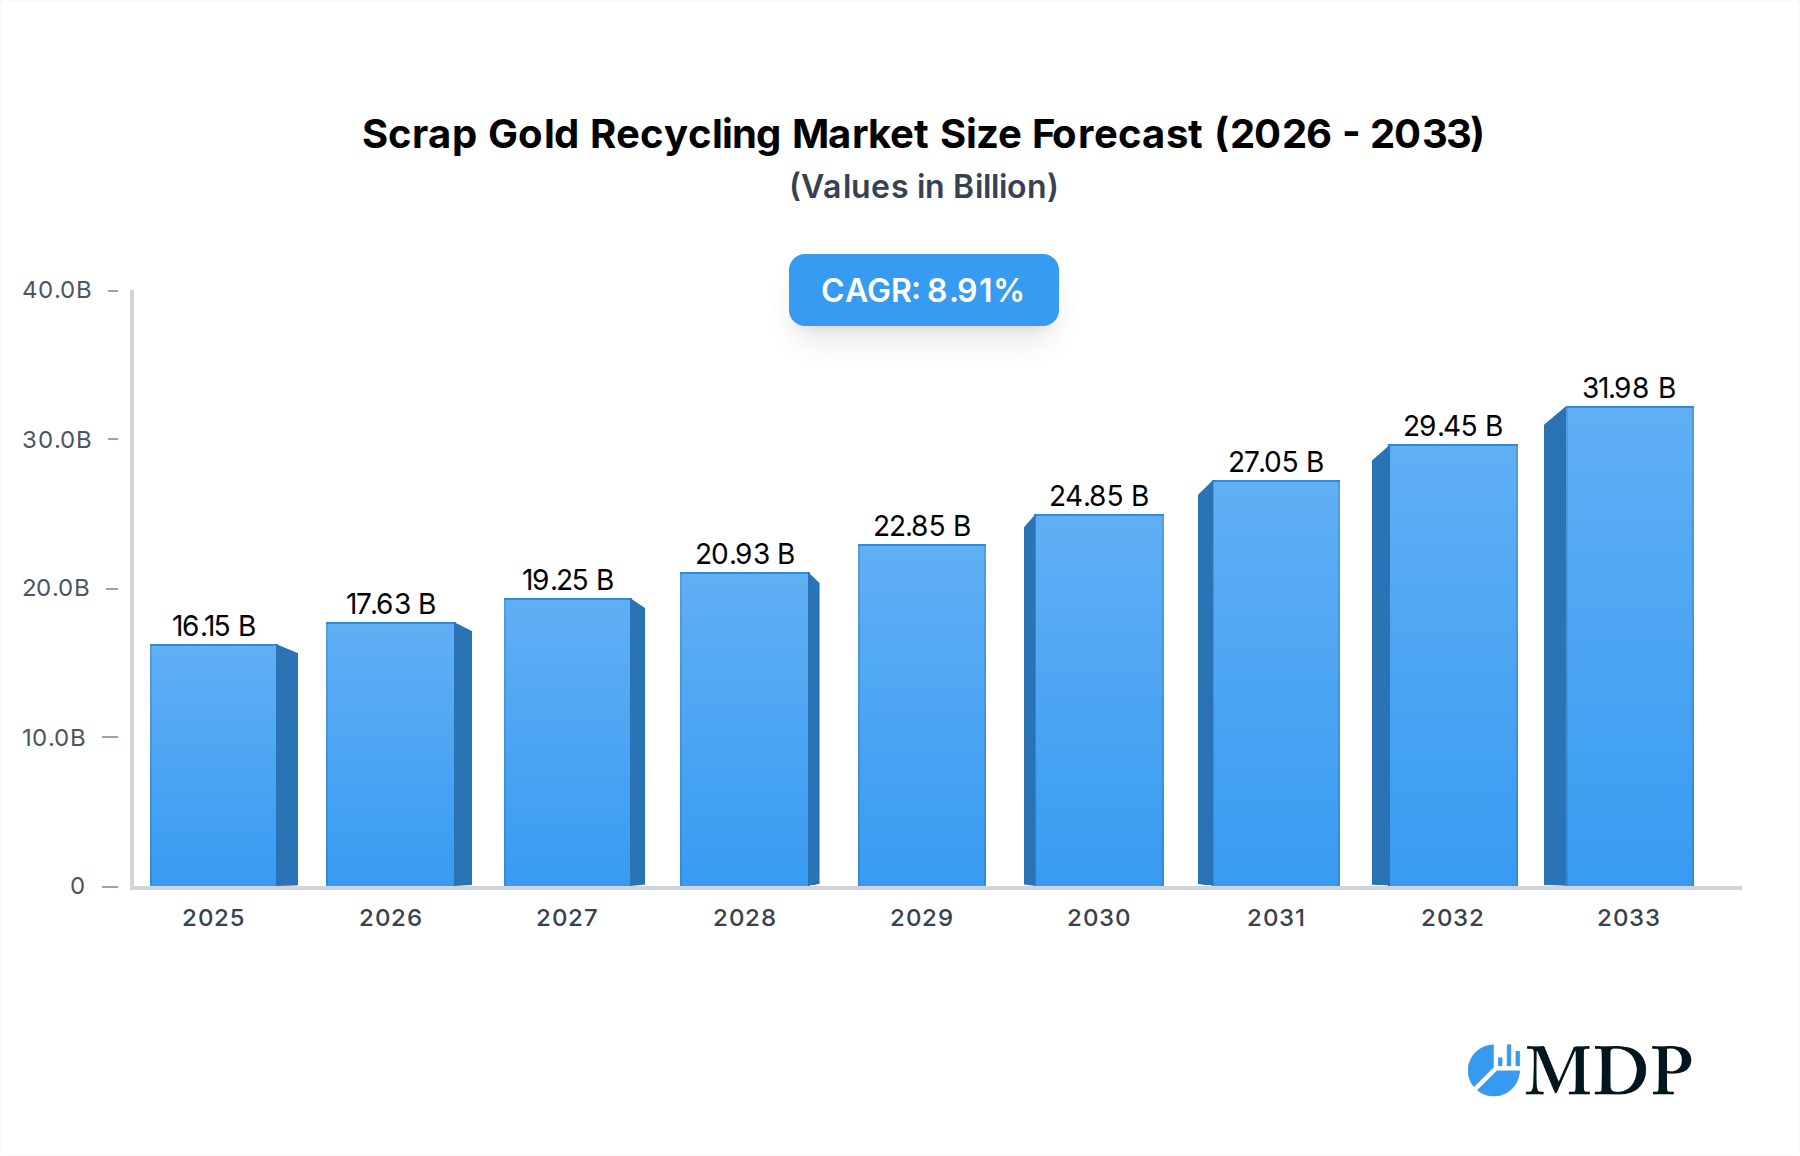
The global scrap gold recycling market is poised for significant expansion, projected to reach $16.15 billion by 2025, demonstrating a robust compound annual growth rate (CAGR) of 9.3% during the forecast period of 2025-2033. This impressive growth is primarily fueled by increasing consumer demand for gold in jewelry, the rising importance of gold as a catalyst in various industrial processes, and its critical role in advanced electronics and battery technologies. As the world grapples with the imperative of resource sustainability, the recycling of gold from electronic waste, industrial byproducts, and end-of-life jewelry presents a highly attractive and environmentally conscious alternative to primary gold extraction. Key players like Umicore, PX Group, Materion, and Sims Recycling Solutions are at the forefront of developing advanced recycling technologies and expanding their collection networks to capitalize on this burgeoning market.

Scrap Gold Recycling Market Size (In Billion)
The market's upward trajectory is further supported by emerging trends such as the growing awareness and adoption of circular economy principles, incentivized by government regulations promoting e-waste management and responsible sourcing of precious metals. Sophisticated refining processes are enabling higher recovery rates, making scrap gold recycling more economically viable and appealing to a wider range of stakeholders, including jewelers, dental professionals, and processing plants. While the substantial initial investment required for advanced recycling infrastructure and fluctuating gold prices represent potential restraints, the inherent value of gold and its limited primary supply ensure a consistent demand for recycled material. The Asia Pacific region, particularly China and India, is expected to emerge as a dominant force, driven by a large consumer base for jewelry and a rapidly growing electronics manufacturing sector, further solidifying the global market's positive outlook.
Scrap Gold Recycling Company Market Share
This comprehensive report delves into the burgeoning scrap gold recycling market, a critical sector driving sustainable resource management and economic value. With a projected market size exceeding $150 billion by 2033, this analysis provides invaluable insights for industry stakeholders, investors, and policymakers. The study encompasses a historical period from 2019 to 2024, a base year of 2025, and a forecast period extending to 2033, offering a robust understanding of past performance and future trajectory. We explore key market dynamics, leading players, technological advancements, and the intricate segment landscape, all crucial for navigating this high-growth industry.
Scrap Gold Recycling Market Dynamics & Concentration
The scrap gold recycling market exhibits a dynamic and evolving concentration landscape. While some consolidation has occurred, the presence of both large-scale refiners and specialized niche players maintains a competitive environment. Innovation drivers are primarily fueled by advancements in refining technologies, particularly in extracting higher purities and reducing environmental impact. Regulatory frameworks, such as extended producer responsibility and stricter environmental standards, are increasingly shaping market practices. Product substitutes, while limited for gold's intrinsic value, exist in alternative precious metals or industrial materials for specific applications, though they don't directly replicate gold's market appeal. End-user trends are leaning towards greater demand for recycled gold in jewelry and electronics due to ethical sourcing concerns and cost-effectiveness. Mergers and acquisitions (M&A) activities, totaling an estimated 15 significant deals in the historical period, have been instrumental in market consolidation and expansion. Key players like Umicore, PX Group, and Sims Recycling Solutions have strategically acquired smaller entities to bolster their processing capabilities and geographic reach. Market share analysis reveals that the top five companies command approximately 65% of the total market value.
Scrap Gold Recycling Industry Trends & Analysis
The scrap gold recycling industry is experiencing robust growth, projected to expand at a Compound Annual Growth Rate (CAGR) of 8.7% during the forecast period. This expansion is propelled by a confluence of factors, including the increasing scarcity of primary gold reserves, driving a greater reliance on secondary sources. Technological disruptions have been paramount, with innovations in hydrometallurgical and pyrometallurgical refining processes enhancing efficiency and purity levels, reducing operational costs, and minimizing environmental footprints. Companies are investing heavily in research and development for advanced extraction techniques that can recover gold from increasingly complex waste streams, such as electronic waste. Consumer preferences are shifting significantly towards ethically sourced and sustainable products, making recycled gold a highly attractive option for both jewelry manufacturers and end consumers. The growing awareness of the environmental impact of traditional mining has further cemented the demand for recycled alternatives. Competitive dynamics are intensifying, with established players continuously innovating and smaller, agile companies emerging to focus on specific waste streams or refining technologies. Market penetration of recycled gold, particularly in the jewelry sector, is steadily increasing, estimated to reach 40% by 2030. The burgeoning electric vehicle (EV) market also presents a substantial opportunity, as batteries contain precious metals that can be recovered. The persistent volatility in gold prices also encourages more active recycling to capitalize on favorable market conditions. The increasing volume of electronic waste, a rich source of gold, further fuels this upward trend.
Leading Markets & Segments in Scrap Gold Recycling
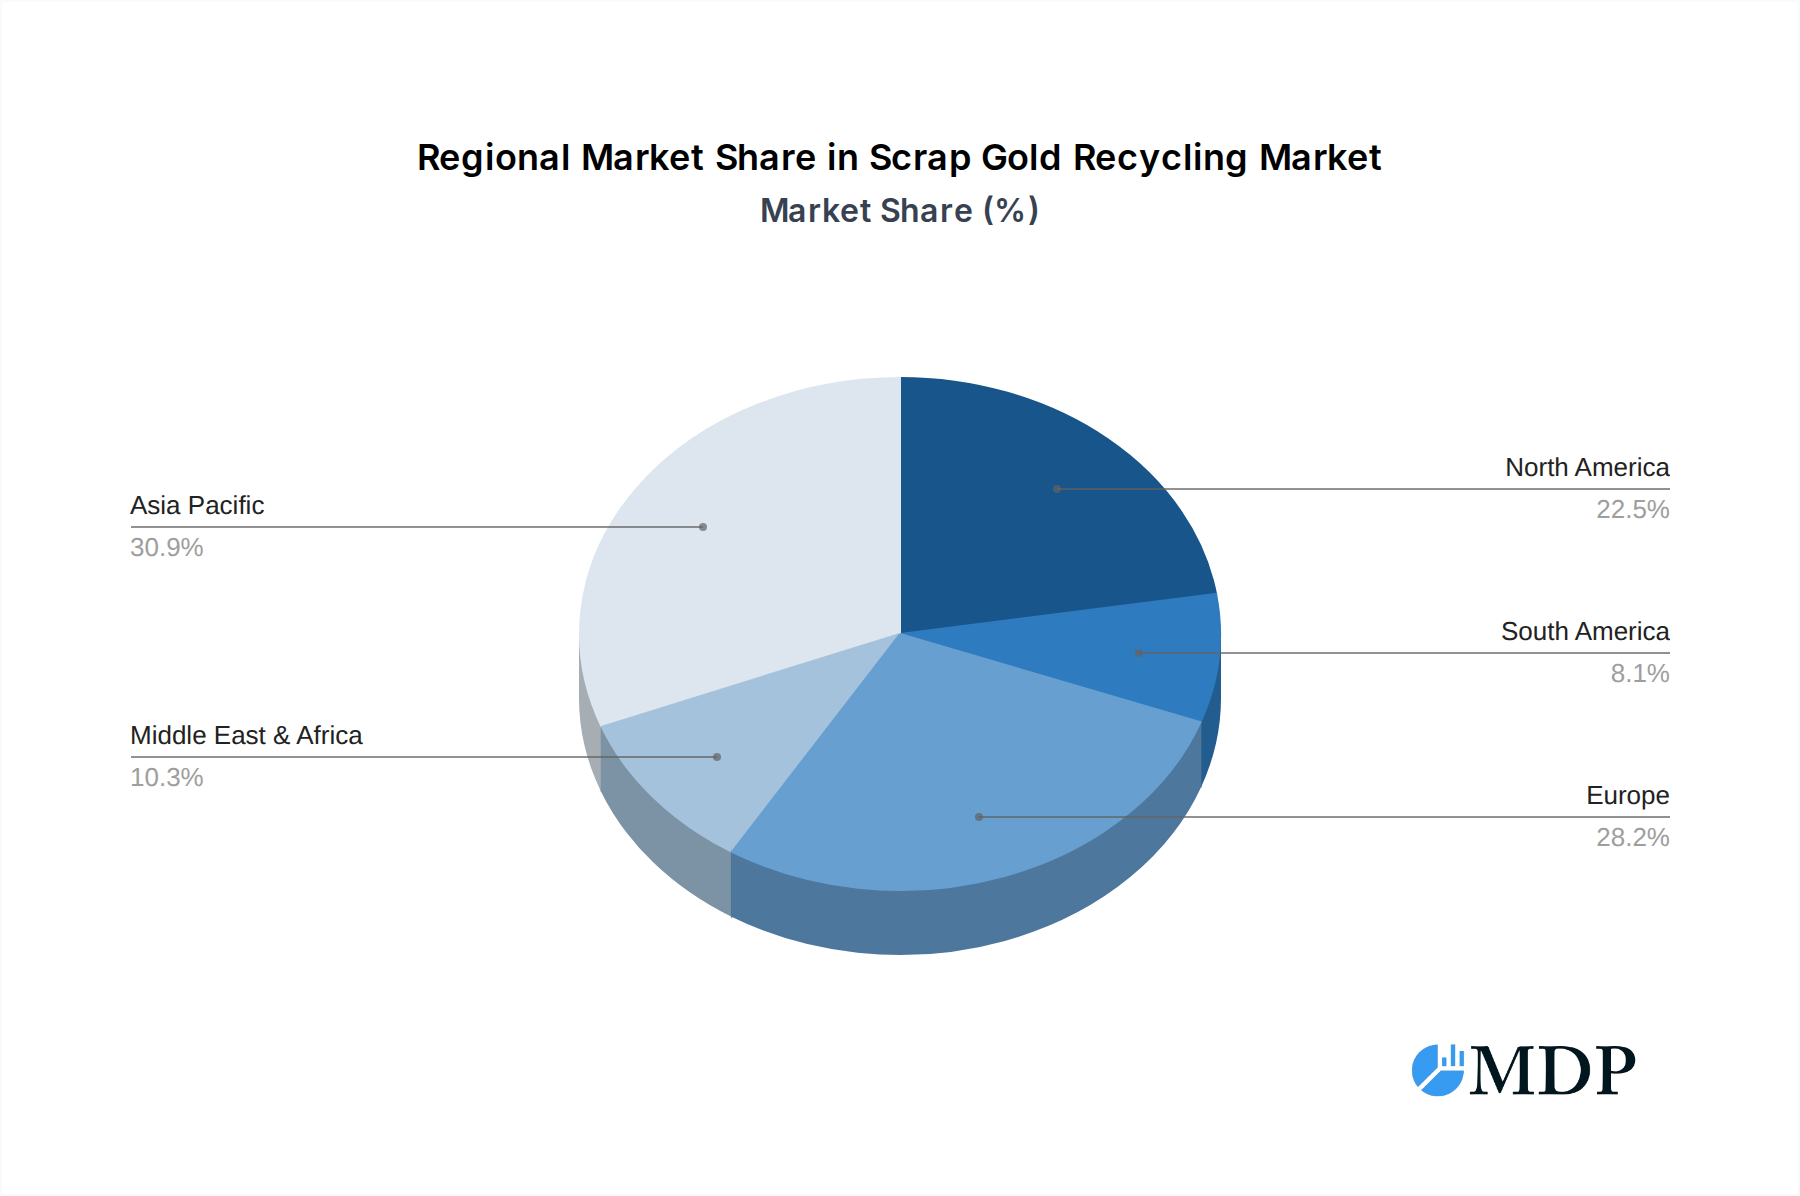
The scrap gold recycling market showcases distinct regional dominance and segment-specific growth patterns. North America and Europe currently lead the market, driven by well-established industrial infrastructure, stringent environmental regulations that incentivize recycling, and a higher consumer propensity for sustainable products. Asia-Pacific is rapidly emerging as a significant growth region, fueled by a burgeoning manufacturing sector, particularly in electronics, and increasing investments in recycling capabilities.
Within the Application segment:
- Electronics currently holds the largest market share, estimated at 35%, due to the ever-increasing volume of discarded electronic devices containing gold components. This segment is expected to continue its robust growth as the lifecycle of electronics shortens and e-waste management becomes a global priority.
- Jewelry represents another significant segment, accounting for approximately 30% of the market. Consumer preference for recycled gold in jewelry is on the rise, driven by ethical sourcing and sustainability concerns.
- Catalyst applications, particularly in the automotive and chemical industries, contribute 15% to the market, with gold's unique catalytic properties making it indispensable.
- Battery recycling is a rapidly growing segment, expected to see substantial expansion in the coming years due to the increasing adoption of electric vehicles and energy storage solutions. This segment currently accounts for 10%.
- Others, including dental applications and industrial uses, make up the remaining 10%.
In terms of Types:
- Electronic Scrap is the dominant type, mirroring the application segment's growth, and accounts for an estimated 45% of the market. The complexity of extracting gold from e-scrap drives innovation in refining technologies.
- Jewelers and Goldsmiths contribute a substantial 25% to the market, with established channels for collecting and recycling gold jewelry.
- Processing Plants themselves are a source of scrap, contributing around 15%, as facilities upgrade or decommission.
- Dental scrap, though smaller, is a consistent source, making up 10%.
- Others, encompassing various industrial and miscellaneous sources, represent the remaining 5%. Economic policies favoring circular economy principles and robust infrastructure for waste collection and processing are key drivers of dominance in these leading markets and segments.
Scrap Gold Recycling Product Developments
Product development in scrap gold recycling is focused on enhancing recovery rates and expanding the range of recoverable materials. Advanced refining technologies are enabling the efficient extraction of high-purity gold from increasingly complex waste streams, including intricate electronic components and low-concentration industrial byproducts. Innovations in chemical leaching and electrochemical methods are improving selectivity and reducing environmental impact. The competitive advantage lies in the ability to process diverse feedstocks with greater precision, yielding higher returns and meeting stringent purity standards demanded by jewelry and electronics manufacturers. These advancements are crucial for capturing value from an ever-growing volume of secondary gold resources.
Key Drivers of Scrap Gold Recycling Growth
The scrap gold recycling market is propelled by a potent combination of drivers. Technologically, advancements in refining techniques, such as improved hydrometallurgical and pyrometallurgical processes, are significantly increasing recovery rates and reducing operational costs. Economically, the rising price of virgin gold and the increasing depletion of primary reserves make recycled gold a more cost-effective and secure alternative. Regulatory factors, including stricter environmental protection laws and government incentives for circular economy initiatives, are creating a favorable landscape for recycling operations. For instance, the EU's Battery Directive is driving increased recycling of precious metals from EV batteries. The growing demand for ethically sourced materials across industries, particularly in consumer-facing sectors like jewelry, further amplifies the appeal of recycled gold.
Challenges in the Scrap Gold Recycling Market
Despite its strong growth trajectory, the scrap gold recycling market faces several challenges. Regulatory hurdles, such as varying international standards for waste handling and import/export of hazardous materials, can complicate cross-border operations. Supply chain issues, including the inconsistent availability and unpredictable quality of scrap feedstock, pose operational challenges and can lead to fluctuations in processing efficiency. Competitive pressures from established players and the constant need for technological upgrades to maintain efficiency and cost-effectiveness are also significant. Furthermore, the energy-intensive nature of some refining processes, coupled with the need for stringent safety protocols, adds to the operational costs and complexity. The estimated impact of these challenges on market efficiency can range from 5-10% reduction in optimal output.
Emerging Opportunities in Scrap Gold Recycling
The scrap gold recycling market is ripe with emerging opportunities. Technological breakthroughs in artificial intelligence and machine learning are being applied to optimize sorting and pre-treatment of complex e-waste streams, improving gold recovery efficiency. Strategic partnerships between e-waste collectors, refiners, and manufacturers are creating more streamlined and efficient supply chains for recycled gold. Market expansion into developing economies with rapidly growing electronics consumption and less mature recycling infrastructure presents significant potential for growth. The increasing focus on the circular economy and sustainable finance is also driving demand for certified recycled gold, creating new market niches. Furthermore, the recovery of other precious metals alongside gold from complex waste streams offers additional revenue streams.
Leading Players in the Scrap Gold Recycling Sector
- Umicore
- PX Group
- Materion
- Sims Recycling Solutions
- Johnson Matthey
- Abington Reldan Metals
- Tanaka
- Dowa Holdings
- Heraeus
- Sino-Platinum Metals
- Asahi Holdings
- SilverTeam
Key Milestones in Scrap Gold Recycling Industry
- 2019: Increased investment in advanced hydrometallurgical refining technologies by major players.
- 2020: Growing consumer demand for ethically sourced gold in jewelry, boosting recycled gold uptake.
- 2021: Implementation of stricter e-waste regulations in key markets, driving greater collection and processing of electronic scrap.
- 2022: Significant M&A activity as larger companies acquire smaller, specialized recyclers to expand capabilities.
- 2023: Advancements in AI-driven sorting technologies for e-waste, improving efficiency in gold recovery.
- 2024: Expansion of battery recycling initiatives, including those for electric vehicles, leading to increased gold recovery.
Strategic Outlook for Scrap Gold Recycling Market
The scrap gold recycling market is poised for continued expansion, driven by the inherent value of gold, increasing environmental consciousness, and technological innovation. Strategic opportunities lie in further developing and scaling advanced refining processes to handle diverse and complex waste streams, thereby maximizing recovery rates and purity. Establishing robust and transparent supply chains through strategic partnerships with waste generators and manufacturers will be crucial. Furthermore, focusing on emerging markets and developing specialized recycling solutions for nascent industries, such as the burgeoning electric vehicle battery sector, will unlock significant future potential. The market's trajectory indicates a robust and sustainable future, offering attractive returns for investors and a vital contribution to resource management.
Scrap Gold Recycling Segmentation
-
1. Application
- 1.1. Jewelry
- 1.2. Catalyst
- 1.3. Electronics
- 1.4. Battery
- 1.5. Others
-
2. Types
- 2.1. Dental
- 2.2. Jewelers and Goldsmiths
- 2.3. Processing Plants
- 2.4. Electronic Scrap
- 2.5. Others
Scrap Gold Recycling Segmentation By Geography
-
1. North America
- 1.1. United States
- 1.2. Canada
- 1.3. Mexico
-
2. South America
- 2.1. Brazil
- 2.2. Argentina
- 2.3. Rest of South America
-
3. Europe
- 3.1. United Kingdom
- 3.2. Germany
- 3.3. France
- 3.4. Italy
- 3.5. Spain
- 3.6. Russia
- 3.7. Benelux
- 3.8. Nordics
- 3.9. Rest of Europe
-
4. Middle East & Africa
- 4.1. Turkey
- 4.2. Israel
- 4.3. GCC
- 4.4. North Africa
- 4.5. South Africa
- 4.6. Rest of Middle East & Africa
-
5. Asia Pacific
- 5.1. China
- 5.2. India
- 5.3. Japan
- 5.4. South Korea
- 5.5. ASEAN
- 5.6. Oceania
- 5.7. Rest of Asia Pacific
Scrap Gold Recycling Regional Market Share
Geographic Coverage of Scrap Gold Recycling
Scrap Gold Recycling REPORT HIGHLIGHTS
| Aspects | Details |
|---|---|
| Study Period | 2020-2034 |
| Base Year | 2025 |
| Estimated Year | 2026 |
| Forecast Period | 2026-2034 |
| Historical Period | 2020-2025 |
| Growth Rate | CAGR of 9.3% from 2020-2034 |
| Segmentation |
|
Table of Contents
- 1. Introduction
- 1.1. Research Scope
- 1.2. Market Segmentation
- 1.3. Research Objective
- 1.4. Definitions and Assumptions
- 2. Executive Summary
- 2.1. Market Snapshot
- 3. Market Dynamics
- 3.1. Market Drivers
- 3.2. Market Restrains
- 3.3. Market Trends
- 3.4. Market Opportunities
- 4. Market Factor Analysis
- 4.1. Porters Five Forces
- 4.1.1. Bargaining Power of Suppliers
- 4.1.2. Bargaining Power of Buyers
- 4.1.3. Threat of New Entrants
- 4.1.4. Threat of Substitutes
- 4.1.5. Competitive Rivalry
- 4.2. PESTEL analysis
- 4.3. BCG Analysis
- 4.3.1. Stars (High Growth, High Market Share)
- 4.3.2. Cash Cows (Low Growth, High Market Share)
- 4.3.3. Question Mark (High Growth, Low Market Share)
- 4.3.4. Dogs (Low Growth, Low Market Share)
- 4.4. Ansoff Matrix Analysis
- 4.5. Supply Chain Analysis
- 4.6. Regulatory Landscape
- 4.7. Current Market Potential and Opportunity Assessment (TAM–SAM–SOM Framework)
- 4.8. MDP Analyst Note
- 4.1. Porters Five Forces
- 5. Market Analysis, Insights and Forecast 2021-2033
- 5.1. Market Analysis, Insights and Forecast - by Application
- 5.1.1. Jewelry
- 5.1.2. Catalyst
- 5.1.3. Electronics
- 5.1.4. Battery
- 5.1.5. Others
- 5.2. Market Analysis, Insights and Forecast - by Types
- 5.2.1. Dental
- 5.2.2. Jewelers and Goldsmiths
- 5.2.3. Processing Plants
- 5.2.4. Electronic Scrap
- 5.2.5. Others
- 5.3. Market Analysis, Insights and Forecast - by Region
- 5.3.1. North America
- 5.3.2. South America
- 5.3.3. Europe
- 5.3.4. Middle East & Africa
- 5.3.5. Asia Pacific
- 5.1. Market Analysis, Insights and Forecast - by Application
- 6. Global Scrap Gold Recycling Analysis, Insights and Forecast, 2021-2033
- 6.1. Market Analysis, Insights and Forecast - by Application
- 6.1.1. Jewelry
- 6.1.2. Catalyst
- 6.1.3. Electronics
- 6.1.4. Battery
- 6.1.5. Others
- 6.2. Market Analysis, Insights and Forecast - by Types
- 6.2.1. Dental
- 6.2.2. Jewelers and Goldsmiths
- 6.2.3. Processing Plants
- 6.2.4. Electronic Scrap
- 6.2.5. Others
- 6.1. Market Analysis, Insights and Forecast - by Application
- 7. North America Scrap Gold Recycling Analysis, Insights and Forecast, 2020-2032
- 7.1. Market Analysis, Insights and Forecast - by Application
- 7.1.1. Jewelry
- 7.1.2. Catalyst
- 7.1.3. Electronics
- 7.1.4. Battery
- 7.1.5. Others
- 7.2. Market Analysis, Insights and Forecast - by Types
- 7.2.1. Dental
- 7.2.2. Jewelers and Goldsmiths
- 7.2.3. Processing Plants
- 7.2.4. Electronic Scrap
- 7.2.5. Others
- 7.1. Market Analysis, Insights and Forecast - by Application
- 8. South America Scrap Gold Recycling Analysis, Insights and Forecast, 2020-2032
- 8.1. Market Analysis, Insights and Forecast - by Application
- 8.1.1. Jewelry
- 8.1.2. Catalyst
- 8.1.3. Electronics
- 8.1.4. Battery
- 8.1.5. Others
- 8.2. Market Analysis, Insights and Forecast - by Types
- 8.2.1. Dental
- 8.2.2. Jewelers and Goldsmiths
- 8.2.3. Processing Plants
- 8.2.4. Electronic Scrap
- 8.2.5. Others
- 8.1. Market Analysis, Insights and Forecast - by Application
- 9. Europe Scrap Gold Recycling Analysis, Insights and Forecast, 2020-2032
- 9.1. Market Analysis, Insights and Forecast - by Application
- 9.1.1. Jewelry
- 9.1.2. Catalyst
- 9.1.3. Electronics
- 9.1.4. Battery
- 9.1.5. Others
- 9.2. Market Analysis, Insights and Forecast - by Types
- 9.2.1. Dental
- 9.2.2. Jewelers and Goldsmiths
- 9.2.3. Processing Plants
- 9.2.4. Electronic Scrap
- 9.2.5. Others
- 9.1. Market Analysis, Insights and Forecast - by Application
- 10. Middle East & Africa Scrap Gold Recycling Analysis, Insights and Forecast, 2020-2032
- 10.1. Market Analysis, Insights and Forecast - by Application
- 10.1.1. Jewelry
- 10.1.2. Catalyst
- 10.1.3. Electronics
- 10.1.4. Battery
- 10.1.5. Others
- 10.2. Market Analysis, Insights and Forecast - by Types
- 10.2.1. Dental
- 10.2.2. Jewelers and Goldsmiths
- 10.2.3. Processing Plants
- 10.2.4. Electronic Scrap
- 10.2.5. Others
- 10.1. Market Analysis, Insights and Forecast - by Application
- 11. Asia Pacific Scrap Gold Recycling Analysis, Insights and Forecast, 2020-2032
- 11.1. Market Analysis, Insights and Forecast - by Application
- 11.1.1. Jewelry
- 11.1.2. Catalyst
- 11.1.3. Electronics
- 11.1.4. Battery
- 11.1.5. Others
- 11.2. Market Analysis, Insights and Forecast - by Types
- 11.2.1. Dental
- 11.2.2. Jewelers and Goldsmiths
- 11.2.3. Processing Plants
- 11.2.4. Electronic Scrap
- 11.2.5. Others
- 11.1. Market Analysis, Insights and Forecast - by Application
- 12. Competitive Analysis
- 12.1. Company Profiles
- 12.1.1 Umicore
- 12.1.1.1. Company Overview
- 12.1.1.2. Products
- 12.1.1.3. Company Financials
- 12.1.1.4. SWOT Analysis
- 12.1.2 PX Group
- 12.1.2.1. Company Overview
- 12.1.2.2. Products
- 12.1.2.3. Company Financials
- 12.1.2.4. SWOT Analysis
- 12.1.3 Materion
- 12.1.3.1. Company Overview
- 12.1.3.2. Products
- 12.1.3.3. Company Financials
- 12.1.3.4. SWOT Analysis
- 12.1.4 Sims Recycling Solutions
- 12.1.4.1. Company Overview
- 12.1.4.2. Products
- 12.1.4.3. Company Financials
- 12.1.4.4. SWOT Analysis
- 12.1.5 Johnson Matthey
- 12.1.5.1. Company Overview
- 12.1.5.2. Products
- 12.1.5.3. Company Financials
- 12.1.5.4. SWOT Analysis
- 12.1.6 Abington Reldan Metals
- 12.1.6.1. Company Overview
- 12.1.6.2. Products
- 12.1.6.3. Company Financials
- 12.1.6.4. SWOT Analysis
- 12.1.7 Tanaka
- 12.1.7.1. Company Overview
- 12.1.7.2. Products
- 12.1.7.3. Company Financials
- 12.1.7.4. SWOT Analysis
- 12.1.8 Dowa Holdings
- 12.1.8.1. Company Overview
- 12.1.8.2. Products
- 12.1.8.3. Company Financials
- 12.1.8.4. SWOT Analysis
- 12.1.9 Heraeus
- 12.1.9.1. Company Overview
- 12.1.9.2. Products
- 12.1.9.3. Company Financials
- 12.1.9.4. SWOT Analysis
- 12.1.10 Sino-Platinum Metals
- 12.1.10.1. Company Overview
- 12.1.10.2. Products
- 12.1.10.3. Company Financials
- 12.1.10.4. SWOT Analysis
- 12.1.11 Asahi Holdings
- 12.1.11.1. Company Overview
- 12.1.11.2. Products
- 12.1.11.3. Company Financials
- 12.1.11.4. SWOT Analysis
- 12.1.12 SilverTeam
- 12.1.12.1. Company Overview
- 12.1.12.2. Products
- 12.1.12.3. Company Financials
- 12.1.12.4. SWOT Analysis
- 12.1.1 Umicore
- 12.2. Market Entropy
- 12.2.1 Company's Key Areas Served
- 12.2.2 Recent Developments
- 12.3. Company Market Share Analysis 2025
- 12.3.1 Top 5 Companies Market Share Analysis
- 12.3.2 Top 3 Companies Market Share Analysis
- 12.4. List of Potential Customers
- 13. Research Methodology
List of Figures
- Figure 1: Global Scrap Gold Recycling Revenue Breakdown (billion, %) by Region 2025 & 2033
- Figure 2: North America Scrap Gold Recycling Revenue (billion), by Application 2025 & 2033
- Figure 3: North America Scrap Gold Recycling Revenue Share (%), by Application 2025 & 2033
- Figure 4: North America Scrap Gold Recycling Revenue (billion), by Types 2025 & 2033
- Figure 5: North America Scrap Gold Recycling Revenue Share (%), by Types 2025 & 2033
- Figure 6: North America Scrap Gold Recycling Revenue (billion), by Country 2025 & 2033
- Figure 7: North America Scrap Gold Recycling Revenue Share (%), by Country 2025 & 2033
- Figure 8: South America Scrap Gold Recycling Revenue (billion), by Application 2025 & 2033
- Figure 9: South America Scrap Gold Recycling Revenue Share (%), by Application 2025 & 2033
- Figure 10: South America Scrap Gold Recycling Revenue (billion), by Types 2025 & 2033
- Figure 11: South America Scrap Gold Recycling Revenue Share (%), by Types 2025 & 2033
- Figure 12: South America Scrap Gold Recycling Revenue (billion), by Country 2025 & 2033
- Figure 13: South America Scrap Gold Recycling Revenue Share (%), by Country 2025 & 2033
- Figure 14: Europe Scrap Gold Recycling Revenue (billion), by Application 2025 & 2033
- Figure 15: Europe Scrap Gold Recycling Revenue Share (%), by Application 2025 & 2033
- Figure 16: Europe Scrap Gold Recycling Revenue (billion), by Types 2025 & 2033
- Figure 17: Europe Scrap Gold Recycling Revenue Share (%), by Types 2025 & 2033
- Figure 18: Europe Scrap Gold Recycling Revenue (billion), by Country 2025 & 2033
- Figure 19: Europe Scrap Gold Recycling Revenue Share (%), by Country 2025 & 2033
- Figure 20: Middle East & Africa Scrap Gold Recycling Revenue (billion), by Application 2025 & 2033
- Figure 21: Middle East & Africa Scrap Gold Recycling Revenue Share (%), by Application 2025 & 2033
- Figure 22: Middle East & Africa Scrap Gold Recycling Revenue (billion), by Types 2025 & 2033
- Figure 23: Middle East & Africa Scrap Gold Recycling Revenue Share (%), by Types 2025 & 2033
- Figure 24: Middle East & Africa Scrap Gold Recycling Revenue (billion), by Country 2025 & 2033
- Figure 25: Middle East & Africa Scrap Gold Recycling Revenue Share (%), by Country 2025 & 2033
- Figure 26: Asia Pacific Scrap Gold Recycling Revenue (billion), by Application 2025 & 2033
- Figure 27: Asia Pacific Scrap Gold Recycling Revenue Share (%), by Application 2025 & 2033
- Figure 28: Asia Pacific Scrap Gold Recycling Revenue (billion), by Types 2025 & 2033
- Figure 29: Asia Pacific Scrap Gold Recycling Revenue Share (%), by Types 2025 & 2033
- Figure 30: Asia Pacific Scrap Gold Recycling Revenue (billion), by Country 2025 & 2033
- Figure 31: Asia Pacific Scrap Gold Recycling Revenue Share (%), by Country 2025 & 2033
List of Tables
- Table 1: Global Scrap Gold Recycling Revenue billion Forecast, by Application 2020 & 2033
- Table 2: Global Scrap Gold Recycling Revenue billion Forecast, by Types 2020 & 2033
- Table 3: Global Scrap Gold Recycling Revenue billion Forecast, by Region 2020 & 2033
- Table 4: Global Scrap Gold Recycling Revenue billion Forecast, by Application 2020 & 2033
- Table 5: Global Scrap Gold Recycling Revenue billion Forecast, by Types 2020 & 2033
- Table 6: Global Scrap Gold Recycling Revenue billion Forecast, by Country 2020 & 2033
- Table 7: United States Scrap Gold Recycling Revenue (billion) Forecast, by Application 2020 & 2033
- Table 8: Canada Scrap Gold Recycling Revenue (billion) Forecast, by Application 2020 & 2033
- Table 9: Mexico Scrap Gold Recycling Revenue (billion) Forecast, by Application 2020 & 2033
- Table 10: Global Scrap Gold Recycling Revenue billion Forecast, by Application 2020 & 2033
- Table 11: Global Scrap Gold Recycling Revenue billion Forecast, by Types 2020 & 2033
- Table 12: Global Scrap Gold Recycling Revenue billion Forecast, by Country 2020 & 2033
- Table 13: Brazil Scrap Gold Recycling Revenue (billion) Forecast, by Application 2020 & 2033
- Table 14: Argentina Scrap Gold Recycling Revenue (billion) Forecast, by Application 2020 & 2033
- Table 15: Rest of South America Scrap Gold Recycling Revenue (billion) Forecast, by Application 2020 & 2033
- Table 16: Global Scrap Gold Recycling Revenue billion Forecast, by Application 2020 & 2033
- Table 17: Global Scrap Gold Recycling Revenue billion Forecast, by Types 2020 & 2033
- Table 18: Global Scrap Gold Recycling Revenue billion Forecast, by Country 2020 & 2033
- Table 19: United Kingdom Scrap Gold Recycling Revenue (billion) Forecast, by Application 2020 & 2033
- Table 20: Germany Scrap Gold Recycling Revenue (billion) Forecast, by Application 2020 & 2033
- Table 21: France Scrap Gold Recycling Revenue (billion) Forecast, by Application 2020 & 2033
- Table 22: Italy Scrap Gold Recycling Revenue (billion) Forecast, by Application 2020 & 2033
- Table 23: Spain Scrap Gold Recycling Revenue (billion) Forecast, by Application 2020 & 2033
- Table 24: Russia Scrap Gold Recycling Revenue (billion) Forecast, by Application 2020 & 2033
- Table 25: Benelux Scrap Gold Recycling Revenue (billion) Forecast, by Application 2020 & 2033
- Table 26: Nordics Scrap Gold Recycling Revenue (billion) Forecast, by Application 2020 & 2033
- Table 27: Rest of Europe Scrap Gold Recycling Revenue (billion) Forecast, by Application 2020 & 2033
- Table 28: Global Scrap Gold Recycling Revenue billion Forecast, by Application 2020 & 2033
- Table 29: Global Scrap Gold Recycling Revenue billion Forecast, by Types 2020 & 2033
- Table 30: Global Scrap Gold Recycling Revenue billion Forecast, by Country 2020 & 2033
- Table 31: Turkey Scrap Gold Recycling Revenue (billion) Forecast, by Application 2020 & 2033
- Table 32: Israel Scrap Gold Recycling Revenue (billion) Forecast, by Application 2020 & 2033
- Table 33: GCC Scrap Gold Recycling Revenue (billion) Forecast, by Application 2020 & 2033
- Table 34: North Africa Scrap Gold Recycling Revenue (billion) Forecast, by Application 2020 & 2033
- Table 35: South Africa Scrap Gold Recycling Revenue (billion) Forecast, by Application 2020 & 2033
- Table 36: Rest of Middle East & Africa Scrap Gold Recycling Revenue (billion) Forecast, by Application 2020 & 2033
- Table 37: Global Scrap Gold Recycling Revenue billion Forecast, by Application 2020 & 2033
- Table 38: Global Scrap Gold Recycling Revenue billion Forecast, by Types 2020 & 2033
- Table 39: Global Scrap Gold Recycling Revenue billion Forecast, by Country 2020 & 2033
- Table 40: China Scrap Gold Recycling Revenue (billion) Forecast, by Application 2020 & 2033
- Table 41: India Scrap Gold Recycling Revenue (billion) Forecast, by Application 2020 & 2033
- Table 42: Japan Scrap Gold Recycling Revenue (billion) Forecast, by Application 2020 & 2033
- Table 43: South Korea Scrap Gold Recycling Revenue (billion) Forecast, by Application 2020 & 2033
- Table 44: ASEAN Scrap Gold Recycling Revenue (billion) Forecast, by Application 2020 & 2033
- Table 45: Oceania Scrap Gold Recycling Revenue (billion) Forecast, by Application 2020 & 2033
- Table 46: Rest of Asia Pacific Scrap Gold Recycling Revenue (billion) Forecast, by Application 2020 & 2033
Frequently Asked Questions
1. What is the projected Compound Annual Growth Rate (CAGR) of the Scrap Gold Recycling?
The projected CAGR is approximately 9.3%.
2. Which companies are prominent players in the Scrap Gold Recycling?
Key companies in the market include Umicore, PX Group, Materion, Sims Recycling Solutions, Johnson Matthey, Abington Reldan Metals, Tanaka, Dowa Holdings, Heraeus, Sino-Platinum Metals, Asahi Holdings, SilverTeam.
3. What are the main segments of the Scrap Gold Recycling?
The market segments include Application, Types.
4. Can you provide details about the market size?
The market size is estimated to be USD 16.15 billion as of 2022.
5. What are some drivers contributing to market growth?
N/A
6. What are the notable trends driving market growth?
N/A
7. Are there any restraints impacting market growth?
N/A
8. Can you provide examples of recent developments in the market?
N/A
9. What pricing options are available for accessing the report?
Pricing options include single-user, multi-user, and enterprise licenses priced at USD 4900.00, USD 7350.00, and USD 9800.00 respectively.
10. Is the market size provided in terms of value or volume?
The market size is provided in terms of value, measured in billion.
11. Are there any specific market keywords associated with the report?
Yes, the market keyword associated with the report is "Scrap Gold Recycling," which aids in identifying and referencing the specific market segment covered.
12. How do I determine which pricing option suits my needs best?
The pricing options vary based on user requirements and access needs. Individual users may opt for single-user licenses, while businesses requiring broader access may choose multi-user or enterprise licenses for cost-effective access to the report.
13. Are there any additional resources or data provided in the Scrap Gold Recycling report?
While the report offers comprehensive insights, it's advisable to review the specific contents or supplementary materials provided to ascertain if additional resources or data are available.
14. How can I stay updated on further developments or reports in the Scrap Gold Recycling?
To stay informed about further developments, trends, and reports in the Scrap Gold Recycling, consider subscribing to industry newsletters, following relevant companies and organizations, or regularly checking reputable industry news sources and publications.
Methodology
Step 1 - Identification of Relevant Samples Size from Population Database


Step 2 - Approaches for Defining Global Market Size (Value, Volume* & Price*)

Note*: In applicable scenarios
Step 3 - Data Sources
Primary Research
- Web Analytics
- Survey Reports
- Research Institute
- Latest Research Reports
- Opinion Leaders
Secondary Research
- Annual Reports
- White Paper
- Latest Press Release
- Industry Association
- Paid Database
- Investor Presentations

Step 4 - Data Triangulation
Involves using different sources of information in order to increase the validity of a study
These sources are likely to be stakeholders in a program - participants, other researchers, program staff, other community members, and so on.
Then we put all data in single framework & apply various statistical tools to find out the dynamic on the market.
During the analysis stage, feedback from the stakeholder groups would be compared to determine areas of agreement as well as areas of divergence