

Key Insights
The robotic vision market is experiencing robust growth, driven by increasing automation across various industries and advancements in computer vision technologies. The market's Compound Annual Growth Rate (CAGR) of 9.86% from 2019-2033 indicates significant expansion, particularly within key segments like automotive, electronics, and pharmaceuticals. The integration of 3D vision systems, offering superior depth perception and object recognition capabilities, is a major trend, outpacing the growth of 2D vision systems. This shift is fueled by the need for more precise and adaptable automation solutions in complex manufacturing processes. Furthermore, the rising demand for quality control and inspection in diverse industries is significantly contributing to market expansion. The adoption of advanced algorithms like deep learning and machine learning is enhancing the accuracy and speed of robotic vision systems, leading to improved efficiency and reduced operational costs. The North American and European regions currently hold substantial market shares, but the Asia-Pacific region is expected to witness faster growth in the coming years, driven by rapid industrialization and increasing investments in automation technologies.
While the market enjoys strong growth drivers, certain restraints exist. High initial investment costs associated with implementing robotic vision systems can hinder adoption, particularly for smaller companies. The complexity of integrating these systems into existing infrastructure and the need for skilled technicians to operate and maintain them also present challenges. However, ongoing technological advancements are addressing these issues through the development of more user-friendly interfaces and cost-effective solutions. The competition among established players like Keyence, FANUC, and Cognex, coupled with the emergence of innovative startups, is fostering innovation and driving down prices, making robotic vision more accessible to a broader range of businesses. This competitive landscape ultimately benefits end-users through greater choice and improved value propositions.
Robotic Vision Industry Market Report: 2019-2033
Dive into the comprehensive analysis of the Robotic Vision Industry, projecting a market value of $XX Million by 2033. This in-depth report provides actionable insights into market dynamics, leading players, technological advancements, and future growth opportunities. The study period covers 2019-2033, with a base year of 2025 and a forecast period of 2025-2033. Gain a competitive edge with this essential resource, packed with data-driven analysis and strategic recommendations.
Robotic Vision Industry Market Dynamics & Concentration
This section analyzes the competitive landscape, innovation drivers, and regulatory factors shaping the Robotic Vision Industry. The market is characterized by a moderate level of concentration, with several key players holding significant market share. However, the entry of new players and technological advancements are constantly reshaping the competitive dynamics.
Market Concentration:
- The top 10 players account for an estimated xx% of the global market share in 2025.
- Consolidation through mergers and acquisitions (M&A) is expected to continue, further shaping market concentration. The number of M&A deals in the sector averaged xx per year during the historical period (2019-2024).
Innovation Drivers:
- Advancements in artificial intelligence (AI) and machine learning (ML) are driving the development of more sophisticated and efficient robotic vision systems.
- The increasing demand for automation across various industries is a major growth catalyst.
- Development of advanced sensors and imaging technologies is leading to improved accuracy and performance.
Regulatory Frameworks:
- Government regulations and safety standards play a significant role in shaping market growth.
- Compliance with data privacy regulations is also becoming increasingly important.
Product Substitutes:
- While robotic vision systems offer unique advantages, they face competition from alternative technologies, such as traditional human inspection methods. However, the advantages of robotic vision in terms of speed, accuracy, and consistency are driving adoption.
End-User Trends:
- The growing adoption of robotics in industries like automotive, electronics, and healthcare is fueling demand for robotic vision systems.
- The increasing focus on Industry 4.0 and smart manufacturing is driving the adoption of advanced robotic vision technologies.
Robotic Vision Industry Industry Trends & Analysis
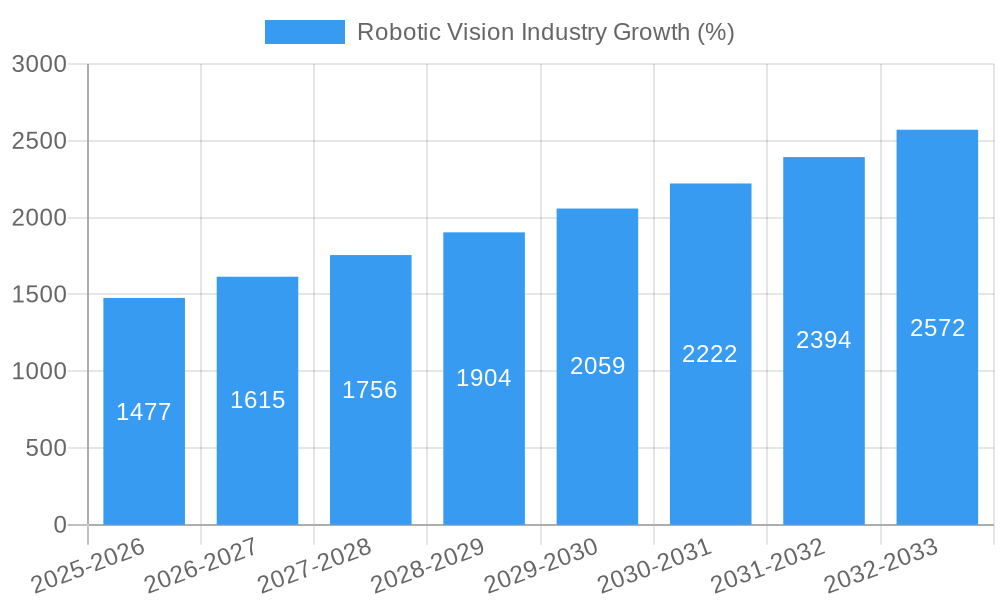
The Robotic Vision Industry exhibits robust growth, driven by technological advancements, increasing automation needs, and favorable regulatory environments. The market is projected to experience a Compound Annual Growth Rate (CAGR) of xx% during the forecast period (2025-2033). Market penetration is expected to increase significantly across various sectors. Key market growth drivers include:
- The rising adoption of advanced imaging technologies, like 3D vision and LiDAR, is enhancing the capabilities of robotic vision systems.
- The increasing need for quality control and process optimization in manufacturing is driving the demand for these systems.
- The emergence of new applications in fields like logistics, agriculture, and healthcare is opening up significant market opportunities.
- Technological disruptions such as the development of more sophisticated AI and Machine Learning algorithms are enhancing the accuracy and efficiency of robotic vision systems.
Leading Markets & Segments in Robotic Vision Industry
The Automotive industry remains the dominant end-user segment for robotic vision systems, followed by Electronics and Aerospace. Geographically, North America and Asia-Pacific are the leading markets, driven by robust industrial growth and technological advancements.
By Technology:
- 3D Vision: Experiencing faster growth than 2D vision due to its ability to provide more comprehensive data and facilitate complex tasks.
- 2D Vision: Remains a significant segment due to its cost-effectiveness and suitability for simpler applications.
By End User Industry:
- Automotive: High adoption due to the need for precision and automation in manufacturing processes. Key drivers include government regulations promoting autonomous driving and increasing production volumes.
- Electronics: Growing demand for high-precision assembly and inspection in the electronics manufacturing industry.
- Aerospace: Strict quality control requirements and complex geometries drive the need for advanced robotic vision systems.
- Food and Beverage: Increasing focus on food safety and quality control, along with automation in packaging and processing.
- Pharmaceutical: Stringent regulatory requirements and the need for precise handling and inspection drive adoption.
- Other End User Industries: Expanding applications in various sectors including logistics, agriculture, and healthcare.
Robotic Vision Industry Product Developments
Recent years have witnessed significant product innovation in the robotic vision sector, focusing on improved image processing, enhanced AI capabilities, and more robust hardware. The integration of AI-powered algorithms enables faster and more accurate object recognition and scene understanding. Compact and user-friendly designs are enhancing market accessibility, while modular systems are providing greater flexibility to suit specific applications. The integration of advanced sensors, like LiDAR and time-of-flight (ToF) cameras, expands the capabilities of robotic vision systems for complex tasks requiring high precision and depth perception.
Key Drivers of Robotic Vision Industry Growth
Several factors are propelling the growth of the Robotic Vision Industry. Technological advancements, particularly in AI and machine learning, are significantly improving the speed, accuracy, and capabilities of robotic vision systems. Increasing automation demands across various industrial sectors are driving adoption, while government initiatives promoting technological innovation and smart manufacturing are creating a supportive regulatory environment. Furthermore, the cost reductions associated with robotic vision components are increasing affordability and market accessibility.
Challenges in the Robotic Vision Industry Market
Despite significant growth potential, the Robotic Vision Industry faces challenges. The high initial investment costs for implementing robotic vision systems can be a barrier to entry for smaller companies. Supply chain disruptions and the complexity of integrating robotic vision systems into existing production lines pose significant hurdles. Furthermore, the need for skilled labor to operate and maintain these systems can limit adoption. The competitive landscape, with established players and new entrants, adds further pressure. These challenges can account for an estimated xx% reduction in potential market growth in the forecast period.
Emerging Opportunities in Robotic Vision Industry
The long-term growth prospects for the Robotic Vision Industry are promising. Emerging technologies such as deep learning, computer vision, and 3D imaging are creating new opportunities. Strategic partnerships between robotic vision providers and end-user companies are accelerating innovation and market expansion. Moreover, expanding applications in areas like healthcare, logistics, and agriculture are opening up vast new market segments. The development of more robust and user-friendly robotic vision systems will further drive market growth.
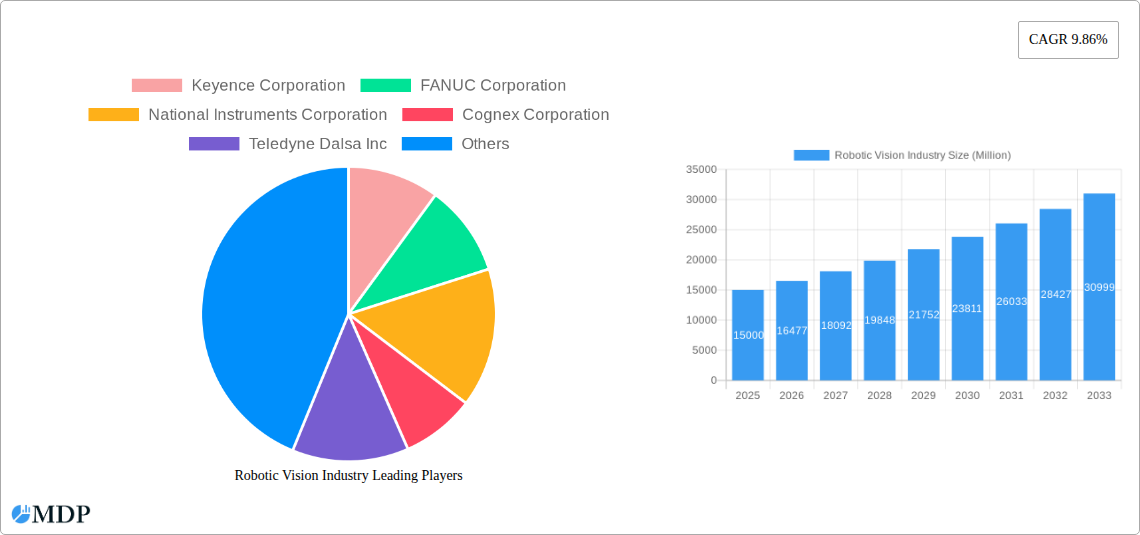
Leading Players in the Robotic Vision Industry Sector
- Keyence Corporation
- FANUC Corporation
- National Instruments Corporation
- Cognex Corporation
- Teledyne Dalsa Inc
- Sick AG
- ABB Group
- Qualcomm Technologies Inc
- Hexagon A
- Omron Adept Technology Inc
Key Milestones in Robotic Vision Industry Industry
- September 2022: ABB launches its first line of branded Autonomous Mobile Robots (AMRs) following its 2021 acquisition of ASTI Mobile Robotics. This significantly expands ABB's integrated automation solutions, impacting the AMR market and furthering the integration of robotic vision technologies within complete automation systems.
- August 2022: Visionary.ai and Innoviz partner to combine imaging technology with LiDAR sensors, improving 3D machine vision performance for robots and drones, creating opportunities for enhanced 3D perception in various applications.
Strategic Outlook for Robotic Vision Industry Market
The Robotic Vision Industry is poised for significant growth, driven by ongoing technological innovation, increasing automation demands, and expansion into new applications. Companies focusing on developing advanced AI capabilities, integrating various sensor technologies, and building user-friendly interfaces will be well-positioned to capture market share. Strategic partnerships, mergers, and acquisitions will continue to shape the competitive landscape. The industry's future is bright, offering abundant opportunities for growth and innovation across diverse sectors.
Robotic Vision Industry Segmentation
-
1. Technology
- 1.1. 2D Vision
- 1.2. 3D Vision
-
2. End User Industry
- 2.1. Automotive
- 2.2. Electronics
- 2.3. Aerospace
- 2.4. Food and Beverage
- 2.5. Pharmaceutical
- 2.6. Other End User Industries
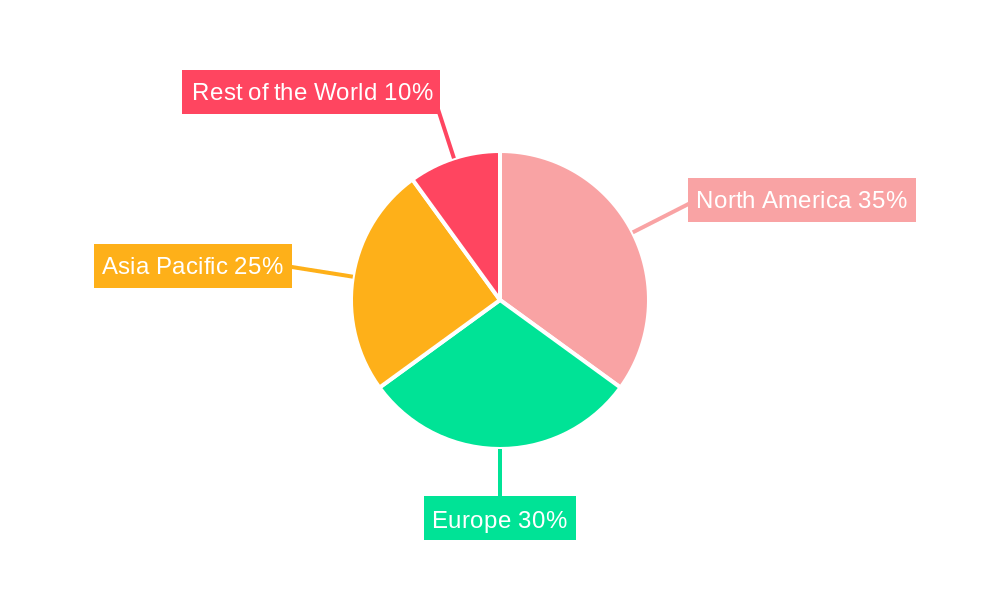
Robotic Vision Industry Segmentation By Geography
- 1. North America
- 2. Europe
- 3. Asia Pacific
- 4. Rest of the World
Robotic Vision Industry REPORT HIGHLIGHTS
| Aspects | Details |
|---|---|
| Study Period | 2019-2033 |
| Base Year | 2024 |
| Estimated Year | 2025 |
| Forecast Period | 2025-2033 |
| Historical Period | 2019-2024 |
| Growth Rate | CAGR of 9.86% from 2019-2033 |
| Segmentation |
|
Table of Contents
- 1. Introduction
- 1.1. Research Scope
- 1.2. Market Segmentation
- 1.3. Research Methodology
- 1.4. Definitions and Assumptions
- 2. Executive Summary
- 2.1. Introduction
- 3. Market Dynamics
- 3.1. Introduction
- 3.2. Market Drivers
- 3.2.1. Increased Adoption of Cognitive Humanoid Robots; Growing Demand from End - User Segments like Automotive Industry
- 3.3. Market Restrains
- 3.3.1. High Investments
- 3.4. Market Trends
- 3.4.1. Growing Demand from End-User Segments like Automotive Industry Drives the Market Growth
- 4. Market Factor Analysis
- 4.1. Porters Five Forces
- 4.2. Supply/Value Chain
- 4.3. PESTEL analysis
- 4.4. Market Entropy
- 4.5. Patent/Trademark Analysis
- 5. Global Robotic Vision Industry Analysis, Insights and Forecast, 2019-2031
- 5.1. Market Analysis, Insights and Forecast - by Technology
- 5.1.1. 2D Vision
- 5.1.2. 3D Vision
- 5.2. Market Analysis, Insights and Forecast - by End User Industry
- 5.2.1. Automotive
- 5.2.2. Electronics
- 5.2.3. Aerospace
- 5.2.4. Food and Beverage
- 5.2.5. Pharmaceutical
- 5.2.6. Other End User Industries
- 5.3. Market Analysis, Insights and Forecast - by Region
- 5.3.1. North America
- 5.3.2. Europe
- 5.3.3. Asia Pacific
- 5.3.4. Rest of the World
- 5.1. Market Analysis, Insights and Forecast - by Technology
- 6. North America Robotic Vision Industry Analysis, Insights and Forecast, 2019-2031
- 6.1. Market Analysis, Insights and Forecast - by Technology
- 6.1.1. 2D Vision
- 6.1.2. 3D Vision
- 6.2. Market Analysis, Insights and Forecast - by End User Industry
- 6.2.1. Automotive
- 6.2.2. Electronics
- 6.2.3. Aerospace
- 6.2.4. Food and Beverage
- 6.2.5. Pharmaceutical
- 6.2.6. Other End User Industries
- 6.1. Market Analysis, Insights and Forecast - by Technology
- 7. Europe Robotic Vision Industry Analysis, Insights and Forecast, 2019-2031
- 7.1. Market Analysis, Insights and Forecast - by Technology
- 7.1.1. 2D Vision
- 7.1.2. 3D Vision
- 7.2. Market Analysis, Insights and Forecast - by End User Industry
- 7.2.1. Automotive
- 7.2.2. Electronics
- 7.2.3. Aerospace
- 7.2.4. Food and Beverage
- 7.2.5. Pharmaceutical
- 7.2.6. Other End User Industries
- 7.1. Market Analysis, Insights and Forecast - by Technology
- 8. Asia Pacific Robotic Vision Industry Analysis, Insights and Forecast, 2019-2031
- 8.1. Market Analysis, Insights and Forecast - by Technology
- 8.1.1. 2D Vision
- 8.1.2. 3D Vision
- 8.2. Market Analysis, Insights and Forecast - by End User Industry
- 8.2.1. Automotive
- 8.2.2. Electronics
- 8.2.3. Aerospace
- 8.2.4. Food and Beverage
- 8.2.5. Pharmaceutical
- 8.2.6. Other End User Industries
- 8.1. Market Analysis, Insights and Forecast - by Technology
- 9. Rest of the World Robotic Vision Industry Analysis, Insights and Forecast, 2019-2031
- 9.1. Market Analysis, Insights and Forecast - by Technology
- 9.1.1. 2D Vision
- 9.1.2. 3D Vision
- 9.2. Market Analysis, Insights and Forecast - by End User Industry
- 9.2.1. Automotive
- 9.2.2. Electronics
- 9.2.3. Aerospace
- 9.2.4. Food and Beverage
- 9.2.5. Pharmaceutical
- 9.2.6. Other End User Industries
- 9.1. Market Analysis, Insights and Forecast - by Technology
- 10. North America Robotic Vision Industry Analysis, Insights and Forecast, 2019-2031
- 10.1. Market Analysis, Insights and Forecast - By Country/Sub-region
- 10.1.1.
- 11. Europe Robotic Vision Industry Analysis, Insights and Forecast, 2019-2031
- 11.1. Market Analysis, Insights and Forecast - By Country/Sub-region
- 11.1.1.
- 12. Asia Pacific Robotic Vision Industry Analysis, Insights and Forecast, 2019-2031
- 12.1. Market Analysis, Insights and Forecast - By Country/Sub-region
- 12.1.1.
- 13. Rest of the World Robotic Vision Industry Analysis, Insights and Forecast, 2019-2031
- 13.1. Market Analysis, Insights and Forecast - By Country/Sub-region
- 13.1.1.
- 14. Competitive Analysis
- 14.1. Global Market Share Analysis 2024
- 14.2. Company Profiles
- 14.2.1 Keyence Corporation
- 14.2.1.1. Overview
- 14.2.1.2. Products
- 14.2.1.3. SWOT Analysis
- 14.2.1.4. Recent Developments
- 14.2.1.5. Financials (Based on Availability)
- 14.2.2 FANUC Corporation
- 14.2.2.1. Overview
- 14.2.2.2. Products
- 14.2.2.3. SWOT Analysis
- 14.2.2.4. Recent Developments
- 14.2.2.5. Financials (Based on Availability)
- 14.2.3 National Instruments Corporation
- 14.2.3.1. Overview
- 14.2.3.2. Products
- 14.2.3.3. SWOT Analysis
- 14.2.3.4. Recent Developments
- 14.2.3.5. Financials (Based on Availability)
- 14.2.4 Cognex Corporation
- 14.2.4.1. Overview
- 14.2.4.2. Products
- 14.2.4.3. SWOT Analysis
- 14.2.4.4. Recent Developments
- 14.2.4.5. Financials (Based on Availability)
- 14.2.5 Teledyne Dalsa Inc
- 14.2.5.1. Overview
- 14.2.5.2. Products
- 14.2.5.3. SWOT Analysis
- 14.2.5.4. Recent Developments
- 14.2.5.5. Financials (Based on Availability)
- 14.2.6 Sick AG
- 14.2.6.1. Overview
- 14.2.6.2. Products
- 14.2.6.3. SWOT Analysis
- 14.2.6.4. Recent Developments
- 14.2.6.5. Financials (Based on Availability)
- 14.2.7 ABB Group
- 14.2.7.1. Overview
- 14.2.7.2. Products
- 14.2.7.3. SWOT Analysis
- 14.2.7.4. Recent Developments
- 14.2.7.5. Financials (Based on Availability)
- 14.2.8 Qualcomm Technologies Inc
- 14.2.8.1. Overview
- 14.2.8.2. Products
- 14.2.8.3. SWOT Analysis
- 14.2.8.4. Recent Developments
- 14.2.8.5. Financials (Based on Availability)
- 14.2.9 Hexagon A
- 14.2.9.1. Overview
- 14.2.9.2. Products
- 14.2.9.3. SWOT Analysis
- 14.2.9.4. Recent Developments
- 14.2.9.5. Financials (Based on Availability)
- 14.2.10 Omron Adept Technology Inc
- 14.2.10.1. Overview
- 14.2.10.2. Products
- 14.2.10.3. SWOT Analysis
- 14.2.10.4. Recent Developments
- 14.2.10.5. Financials (Based on Availability)
- 14.2.1 Keyence Corporation
List of Figures
- Figure 1: Global Robotic Vision Industry Revenue Breakdown (Million, %) by Region 2024 & 2032
- Figure 2: North America Robotic Vision Industry Revenue (Million), by Country 2024 & 2032
- Figure 3: North America Robotic Vision Industry Revenue Share (%), by Country 2024 & 2032
- Figure 4: Europe Robotic Vision Industry Revenue (Million), by Country 2024 & 2032
- Figure 5: Europe Robotic Vision Industry Revenue Share (%), by Country 2024 & 2032
- Figure 6: Asia Pacific Robotic Vision Industry Revenue (Million), by Country 2024 & 2032
- Figure 7: Asia Pacific Robotic Vision Industry Revenue Share (%), by Country 2024 & 2032
- Figure 8: Rest of the World Robotic Vision Industry Revenue (Million), by Country 2024 & 2032
- Figure 9: Rest of the World Robotic Vision Industry Revenue Share (%), by Country 2024 & 2032
- Figure 10: North America Robotic Vision Industry Revenue (Million), by Technology 2024 & 2032
- Figure 11: North America Robotic Vision Industry Revenue Share (%), by Technology 2024 & 2032
- Figure 12: North America Robotic Vision Industry Revenue (Million), by End User Industry 2024 & 2032
- Figure 13: North America Robotic Vision Industry Revenue Share (%), by End User Industry 2024 & 2032
- Figure 14: North America Robotic Vision Industry Revenue (Million), by Country 2024 & 2032
- Figure 15: North America Robotic Vision Industry Revenue Share (%), by Country 2024 & 2032
- Figure 16: Europe Robotic Vision Industry Revenue (Million), by Technology 2024 & 2032
- Figure 17: Europe Robotic Vision Industry Revenue Share (%), by Technology 2024 & 2032
- Figure 18: Europe Robotic Vision Industry Revenue (Million), by End User Industry 2024 & 2032
- Figure 19: Europe Robotic Vision Industry Revenue Share (%), by End User Industry 2024 & 2032
- Figure 20: Europe Robotic Vision Industry Revenue (Million), by Country 2024 & 2032
- Figure 21: Europe Robotic Vision Industry Revenue Share (%), by Country 2024 & 2032
- Figure 22: Asia Pacific Robotic Vision Industry Revenue (Million), by Technology 2024 & 2032
- Figure 23: Asia Pacific Robotic Vision Industry Revenue Share (%), by Technology 2024 & 2032
- Figure 24: Asia Pacific Robotic Vision Industry Revenue (Million), by End User Industry 2024 & 2032
- Figure 25: Asia Pacific Robotic Vision Industry Revenue Share (%), by End User Industry 2024 & 2032
- Figure 26: Asia Pacific Robotic Vision Industry Revenue (Million), by Country 2024 & 2032
- Figure 27: Asia Pacific Robotic Vision Industry Revenue Share (%), by Country 2024 & 2032
- Figure 28: Rest of the World Robotic Vision Industry Revenue (Million), by Technology 2024 & 2032
- Figure 29: Rest of the World Robotic Vision Industry Revenue Share (%), by Technology 2024 & 2032
- Figure 30: Rest of the World Robotic Vision Industry Revenue (Million), by End User Industry 2024 & 2032
- Figure 31: Rest of the World Robotic Vision Industry Revenue Share (%), by End User Industry 2024 & 2032
- Figure 32: Rest of the World Robotic Vision Industry Revenue (Million), by Country 2024 & 2032
- Figure 33: Rest of the World Robotic Vision Industry Revenue Share (%), by Country 2024 & 2032
List of Tables
- Table 1: Global Robotic Vision Industry Revenue Million Forecast, by Region 2019 & 2032
- Table 2: Global Robotic Vision Industry Revenue Million Forecast, by Technology 2019 & 2032
- Table 3: Global Robotic Vision Industry Revenue Million Forecast, by End User Industry 2019 & 2032
- Table 4: Global Robotic Vision Industry Revenue Million Forecast, by Region 2019 & 2032
- Table 5: Global Robotic Vision Industry Revenue Million Forecast, by Country 2019 & 2032
- Table 6: Robotic Vision Industry Revenue (Million) Forecast, by Application 2019 & 2032
- Table 7: Global Robotic Vision Industry Revenue Million Forecast, by Country 2019 & 2032
- Table 8: Robotic Vision Industry Revenue (Million) Forecast, by Application 2019 & 2032
- Table 9: Global Robotic Vision Industry Revenue Million Forecast, by Country 2019 & 2032
- Table 10: Robotic Vision Industry Revenue (Million) Forecast, by Application 2019 & 2032
- Table 11: Global Robotic Vision Industry Revenue Million Forecast, by Country 2019 & 2032
- Table 12: Robotic Vision Industry Revenue (Million) Forecast, by Application 2019 & 2032
- Table 13: Global Robotic Vision Industry Revenue Million Forecast, by Technology 2019 & 2032
- Table 14: Global Robotic Vision Industry Revenue Million Forecast, by End User Industry 2019 & 2032
- Table 15: Global Robotic Vision Industry Revenue Million Forecast, by Country 2019 & 2032
- Table 16: Global Robotic Vision Industry Revenue Million Forecast, by Technology 2019 & 2032
- Table 17: Global Robotic Vision Industry Revenue Million Forecast, by End User Industry 2019 & 2032
- Table 18: Global Robotic Vision Industry Revenue Million Forecast, by Country 2019 & 2032
- Table 19: Global Robotic Vision Industry Revenue Million Forecast, by Technology 2019 & 2032
- Table 20: Global Robotic Vision Industry Revenue Million Forecast, by End User Industry 2019 & 2032
- Table 21: Global Robotic Vision Industry Revenue Million Forecast, by Country 2019 & 2032
- Table 22: Global Robotic Vision Industry Revenue Million Forecast, by Technology 2019 & 2032
- Table 23: Global Robotic Vision Industry Revenue Million Forecast, by End User Industry 2019 & 2032
- Table 24: Global Robotic Vision Industry Revenue Million Forecast, by Country 2019 & 2032
Frequently Asked Questions
1. What is the projected Compound Annual Growth Rate (CAGR) of the Robotic Vision Industry?
The projected CAGR is approximately 9.86%.
2. Which companies are prominent players in the Robotic Vision Industry?
Key companies in the market include Keyence Corporation, FANUC Corporation, National Instruments Corporation, Cognex Corporation, Teledyne Dalsa Inc, Sick AG, ABB Group, Qualcomm Technologies Inc, Hexagon A, Omron Adept Technology Inc.
3. What are the main segments of the Robotic Vision Industry?
The market segments include Technology, End User Industry.
4. Can you provide details about the market size?
The market size is estimated to be USD XX Million as of 2022.
5. What are some drivers contributing to market growth?
Increased Adoption of Cognitive Humanoid Robots; Growing Demand from End - User Segments like Automotive Industry.
6. What are the notable trends driving market growth?
Growing Demand from End-User Segments like Automotive Industry Drives the Market Growth.
7. Are there any restraints impacting market growth?
High Investments.
8. Can you provide examples of recent developments in the market?
September 2022 - Following the 2021 acquisition of mobile robot company ASTI Mobile Robotics, ABB has launched its first line of branded Autonomous Mobile Robots (AMRs). ABB has a fully integrated offering of robots, AMRs, and machine automation solutions. ABB, which already provides AMR solutions for client projects, has collaborated with crucial partner Expert Technology Group in the UK to develop a complete assembly line based on AMRs for a technology startup creating breakthrough parts for EV vehicle drive trains. ABB's automation system uses ABB robots, vision function packages, and AMRs to transport products between robotic automation cells and human assembly stations.
9. What pricing options are available for accessing the report?
Pricing options include single-user, multi-user, and enterprise licenses priced at USD 4750, USD 5250, and USD 8750 respectively.
10. Is the market size provided in terms of value or volume?
The market size is provided in terms of value, measured in Million.
11. Are there any specific market keywords associated with the report?
Yes, the market keyword associated with the report is "Robotic Vision Industry," which aids in identifying and referencing the specific market segment covered.
12. How do I determine which pricing option suits my needs best?
The pricing options vary based on user requirements and access needs. Individual users may opt for single-user licenses, while businesses requiring broader access may choose multi-user or enterprise licenses for cost-effective access to the report.
13. Are there any additional resources or data provided in the Robotic Vision Industry report?
While the report offers comprehensive insights, it's advisable to review the specific contents or supplementary materials provided to ascertain if additional resources or data are available.
14. How can I stay updated on further developments or reports in the Robotic Vision Industry?
To stay informed about further developments, trends, and reports in the Robotic Vision Industry, consider subscribing to industry newsletters, following relevant companies and organizations, or regularly checking reputable industry news sources and publications.
Methodology
Step 1 - Identification of Relevant Samples Size from Population Database


Step 2 - Approaches for Defining Global Market Size (Value, Volume* & Price*)

Note*: In applicable scenarios
Step 3 - Data Sources
Primary Research
- Web Analytics
- Survey Reports
- Research Institute
- Latest Research Reports
- Opinion Leaders
Secondary Research
- Annual Reports
- White Paper
- Latest Press Release
- Industry Association
- Paid Database
- Investor Presentations

Step 4 - Data Triangulation
Involves using different sources of information in order to increase the validity of a study
These sources are likely to be stakeholders in a program - participants, other researchers, program staff, other community members, and so on.
Then we put all data in single framework & apply various statistical tools to find out the dynamic on the market.
During the analysis stage, feedback from the stakeholder groups would be compared to determine areas of agreement as well as areas of divergence
