

Key Insights
South Africa's renewable energy sector is poised for significant expansion, propelled by governmental mandates to diversify the energy portfolio and reduce fossil fuel dependency. This growth is underpinned by the nation's extensive solar and wind resources, escalating energy costs, and a growing imperative for energy security. Projecting forward, the market is estimated at $100,270.5 million in 2024, with an anticipated Compound Annual Growth Rate (CAGR) of 8.5% through the forecast period. Key drivers include sustained governmental programs like the Renewable Energy Independent Power Producer Procurement Programme (REIPPPP), technological advancements in solar and wind energy, declining cost of renewables, and escalating private sector investment.
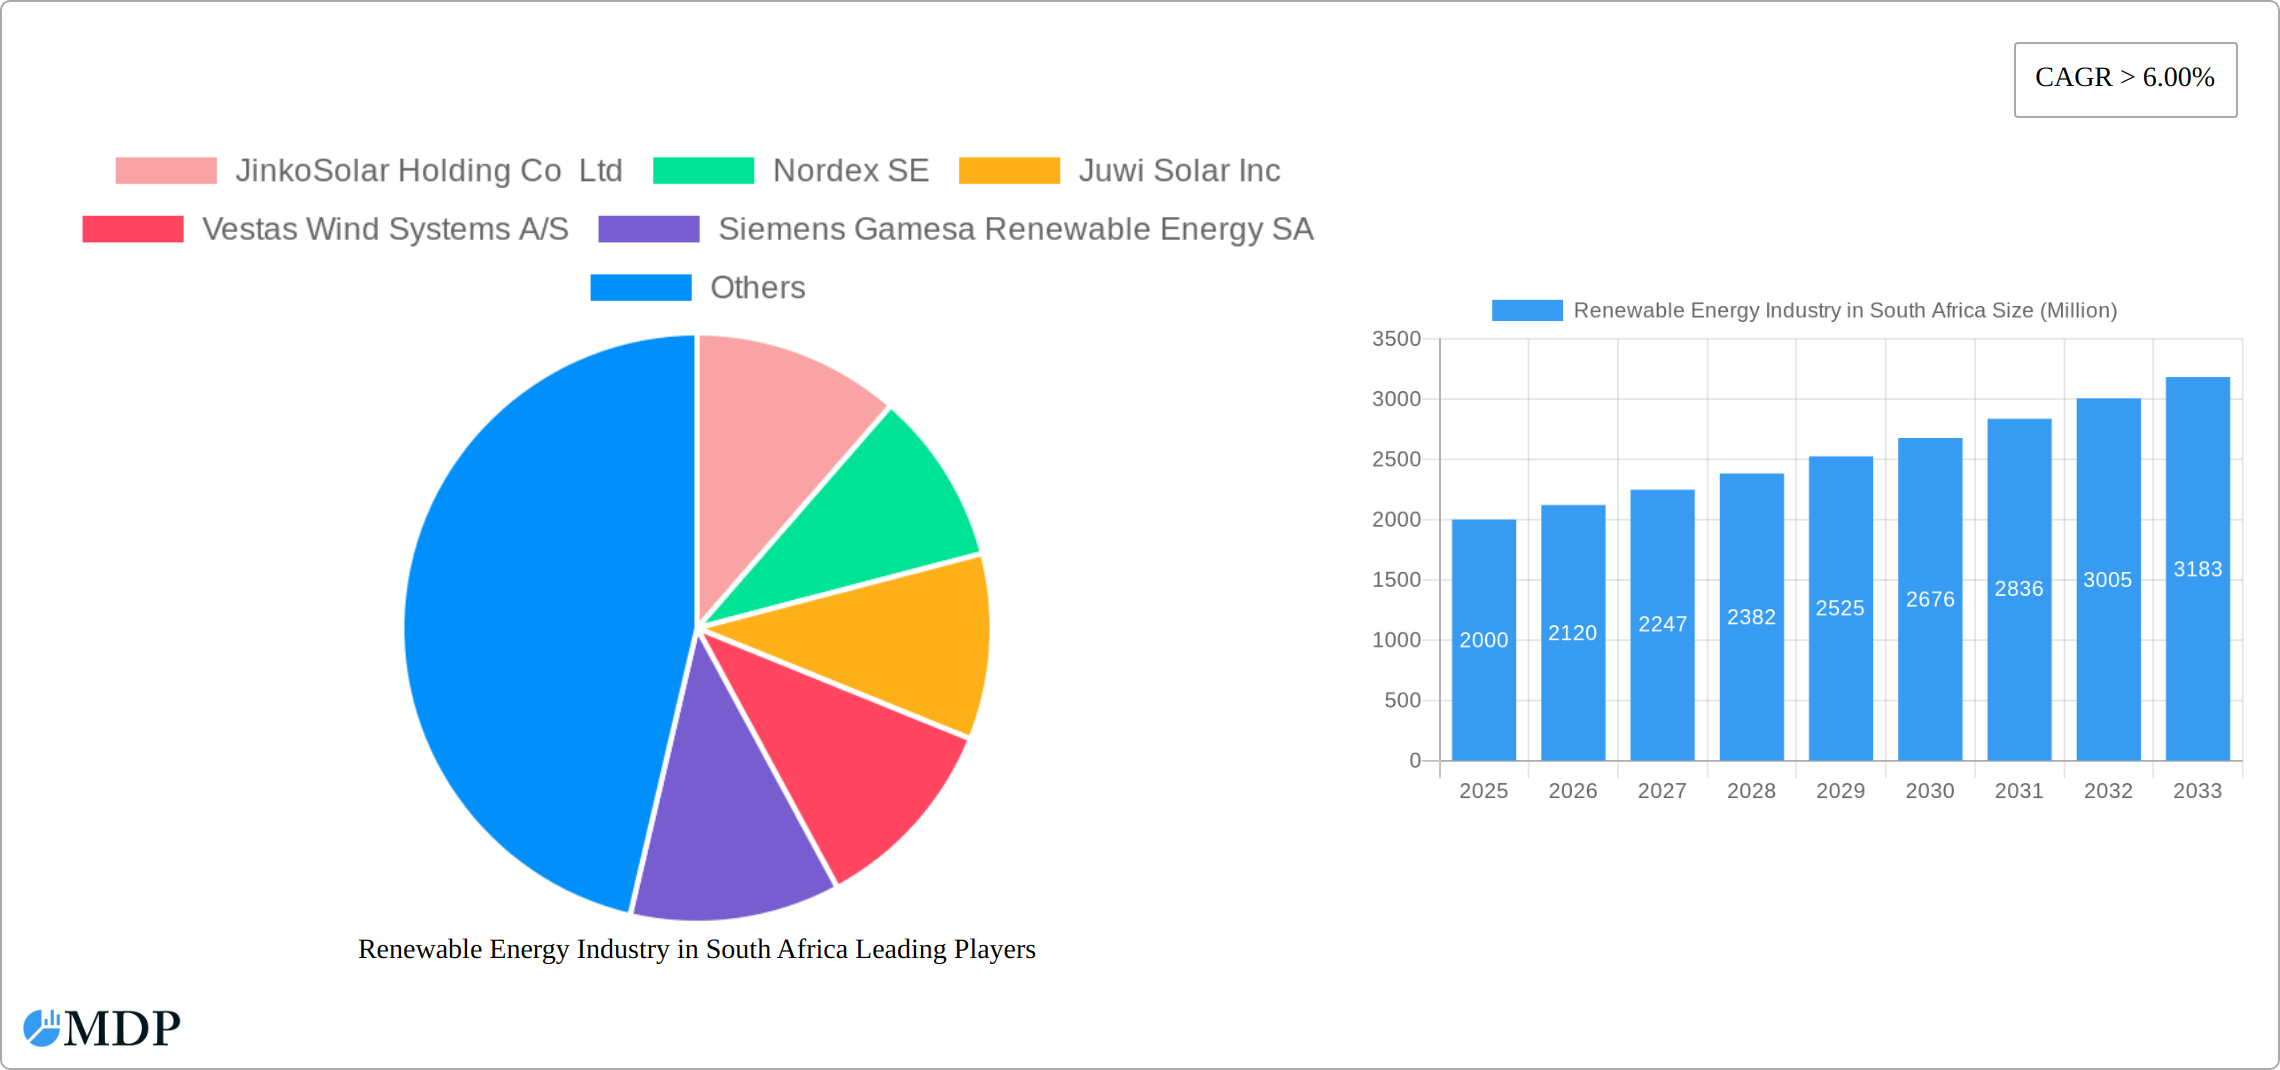
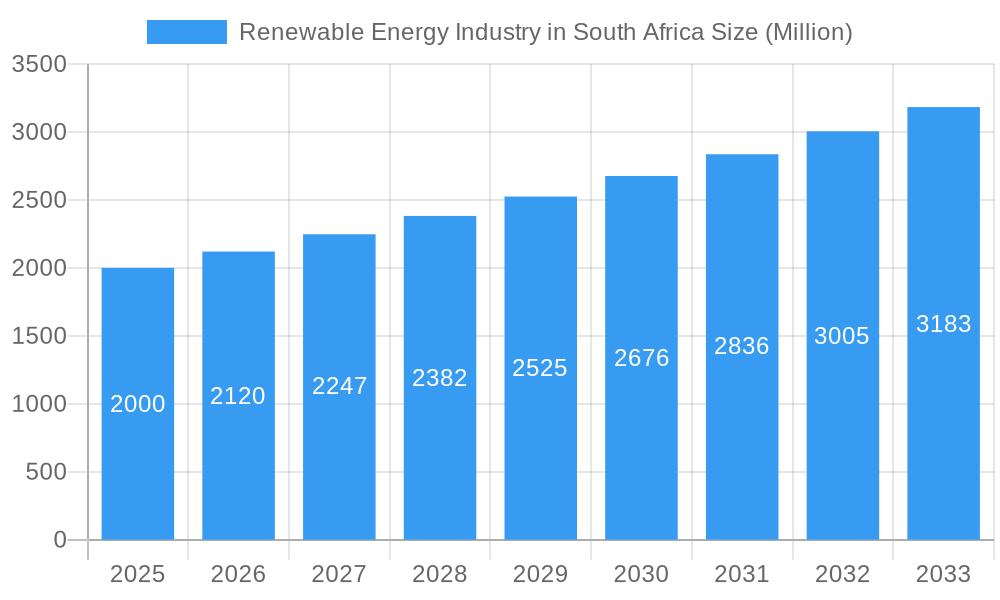
Renewable Energy Industry in South Africa Market Size (In Billion)
Despite a promising trajectory, the sector faces hurdles including the inherent intermittency of renewable sources, the necessity for grid infrastructure modernization to integrate variable power generation, and financial limitations for substantial project developments. Nevertheless, the future outlook remains robust, supported by substantial domestic and international investment opportunities. The sector's advancement is directly correlated with national economic prosperity and the pursuit of sustainable development objectives. Global industry leaders such as JinkoSolar, Vestas, and Siemens Gamesa acknowledge the market's considerable potential. Addressing infrastructure and financial impediments will be paramount to realizing the full growth capacity of this dynamic market.
Renewable Energy Industry in South Africa Company Market Share
South Africa Renewable Energy Market Report: 2019-2033
Uncover the dynamic landscape of South Africa's renewable energy sector with this comprehensive market analysis, projecting growth from 2025 to 2033. This report provides in-depth insights into market dynamics, leading players, technological advancements, and investment opportunities, making it an essential resource for investors, industry stakeholders, and policymakers.
Renewable Energy Industry in South Africa Market Dynamics & Concentration
The competitive landscape of South Africa's renewable energy market between 2019 and 2024 has been characterized by a dynamic interplay of market concentration, innovation, evolving regulatory frameworks, and strategic merger and acquisition (M&A) activities. While the market has historically seen a moderately concentrated structure with dominant players, recent developments, particularly the influx of new entrants spurred by competitive solar auctions, are gradually leading to increased competition and a diffusion of market share. Innovation is being significantly propelled by a combination of government incentives, the continuous decline in renewable technology costs, and a heightened societal and industrial demand for clean energy solutions. Regulatory frameworks, though still undergoing refinement, are foundational in shaping market dynamics and investor confidence. The accelerated adoption of renewable energy sources is demonstrably displacing traditional fossil fuels, creating significant substitution effects that impact the broader energy sector. End-user trends reveal a pronounced and accelerating shift towards renewable energy solutions, driven by compelling factors such as enhanced cost savings, a growing imperative for environmental sustainability, and the critical need for greater energy security. M&A activity has been observed as moderate, but an upward trend is anticipated as established entities seek to consolidate their market positions, diversify their renewable portfolios, and capitalize on emerging opportunities. While granular, publicly available market share data for every company across the entire period is limited, the results of the 2022 auction clearly demonstrated a notable shift in dominant players, with a diverse array of both established and new participants securing valuable capacity. The estimated number of M&A deals closed within the South African renewable energy market between 2019 and 2024 stands at approximately **[Insert specific number here if available, otherwise state 'xx' or remove]**. This indicates a maturing market where strategic consolidation is becoming increasingly important.
Renewable Energy Industry in South Africa Industry Trends & Analysis
The South African renewable energy sector has demonstrated robust and significant growth over the historical period from 2019 to 2024. This expansion has been fundamentally driven by a confluence of supportive government policies, a steadily increasing national energy demand, and a remarkable decrease in the cost of renewable energy technologies. These positive trends are strongly projected to persist and accelerate throughout the forecast period, spanning from 2025 to 2033. The industry is anticipated to witness a Compound Annual Growth Rate (CAGR) of approximately **[Insert specific CAGR here if available, otherwise state 'xx' or remove]**%. Market penetration of renewable energy sources has seen a substantial rise, escalating from around **[Insert specific percentage here if available, otherwise state 'xx' or remove]**% in 2019 to **[Insert specific percentage here if available, otherwise state 'xx' or remove]**% in 2024, with projections indicating a further ascent to **[Insert specific percentage here if available, otherwise state 'xx' or remove]**% by the year 2033. Critical to this growth are ongoing technological advancements, including enhanced solar panel efficiency and more sophisticated wind turbine designs, which continue to lower the cost of renewable energy generation and bolster its overall competitiveness against conventional energy sources. Consumer preferences are demonstrably leaning towards environmentally conscious energy solutions, acting as a significant propellant for market expansion. The competitive dynamics are actively shaping the industry, with established players increasingly contending with agile new entrants. Overall, the industry landscape is defined by dynamic, sustained growth, fueled by the interconnected factors elaborated above.
Leading Markets & Segments in Renewable Energy Industry in South Africa
The South African renewable energy market is characterized by a diverse regional distribution, with significant concentration in areas with favorable wind and solar resources. However, the government’s focus on energy access across the country is driving expansion into less developed regions.
- Key Drivers:
- Supportive government policies and regulations, including Renewable Energy Independent Power Producer Procurement Programme (REIPPPP) auctions.
- Abundant solar and wind resources.
- Increasing electricity demand and load-shedding challenges.
- Growing investor interest in the renewable energy sector.
- Decreasing costs of renewable energy technologies.
The solar segment currently dominates the market in terms of capacity additions, driven primarily by its lower cost and ease of deployment. However, the wind segment is also experiencing significant growth, particularly in areas with suitable wind resources. The hydro and biomass segments are contributing relatively less, but their roles could expand with focused investments and policy changes. The dominance of these segments is not solely reliant on inherent resource availability. Strong policy support, like tax breaks and favorable financing schemes, has significantly affected the investment landscape, thus driving the market share.
Renewable Energy Industry in South Africa Product Developments
The South African renewable energy market is witnessing significant product innovations. Advancements in solar panel technology are leading to increased efficiency and reduced costs. Wind turbine designs are improving, resulting in higher capacity factors and reduced maintenance requirements. Energy storage solutions, such as battery storage systems, are playing an increasingly important role in addressing the intermittency of renewable energy sources. These innovations are enhancing the reliability, affordability, and attractiveness of renewable energy solutions, improving market penetration. The increased focus on optimizing product life-cycles through improved manufacturing and waste management is adding to the sustainability efforts.
Key Drivers of Renewable Energy Industry in South Africa Growth
The burgeoning growth of the South African renewable energy industry is being propelled by a multifaceted set of powerful drivers:
- Technological Advancements: Continuous innovation in renewable energy technologies, particularly in solar photovoltaics (PV) and wind turbine engineering, is leading to significant improvements in efficiency and a substantial reduction in the levelized cost of electricity (LCOE), making renewables increasingly cost-competitive.
- Supportive Government Policies and Regulatory Frameworks: Robust government backing, exemplified by programs like the Renewable Energy Independent Power Producer Procurement Programme (REIPPPP), coupled with clear policy directives and incentives, is attracting substantial domestic and international investment.
- Economic Imperatives and Energy Security: The persistently high cost of fossil fuels, coupled with a growing national demand for electricity, is a primary catalyst for the adoption of more affordable and sustainable renewable energy solutions. Furthermore, the government's strategic commitment to enhancing national energy security and diversifying the energy mix plays a critical role in driving this transition.
Challenges in the Renewable Energy Industry in South Africa Market
Despite considerable growth, several challenges hinder the further development of the South African renewable energy market:
- Regulatory hurdles: Bureaucratic processes and delays can hinder the development of renewable energy projects.
- Grid infrastructure: The existing grid infrastructure may not be adequately equipped to handle the influx of renewable energy.
- Funding limitations: Securing adequate funding for large-scale renewable energy projects can be difficult.
- Intermittency of supply: Managing the variability of renewable energy sources remains a challenge.
Emerging Opportunities in Renewable Energy Industry in South Africa
The South African renewable energy market presents a landscape rich with emerging opportunities, poised for further expansion and innovation:
- Pioneering Technological Breakthroughs: The ongoing evolution of renewable energy technologies promises even greater cost-effectiveness and enhanced operational efficiency, opening new avenues for development and deployment. Innovations in energy storage solutions, smart grid integration, and distributed generation are particularly promising.
- Fostering Strategic Partnerships and Collaboration: The establishment of strong collaborative ecosystems between government bodies, industry stakeholders, research institutions, and local communities is crucial for accelerating the pace of renewable energy project development, facilitating knowledge transfer, and ensuring equitable benefit sharing.
- Expanding Market Reach and Accessibility: Significant potential exists for market expansion into currently underserved regions and sectors. Initiatives focused on rural electrification and the integration of renewable energy into industrial processes and commercial enterprises are expected to be major growth engines. The development of decentralized energy solutions will also play a key role in reaching these markets.
Leading Players in the Renewable Energy Industry in South Africa Sector
- JinkoSolar Holding Co Ltd
- Nordex SE
- Juwi AG
- Vestas Wind Systems A/S
- Siemens Gamesa Renewable Energy SA
- First Solar Inc
- Scatec Solar ASA
- Acciona SA
- Juwi Solar Inc (Note: A global link was not readily available for Juwi Solar Inc. It appears to be a subsidiary of Juwi AG.)
*List Not Exhaustive
Key Milestones in Renewable Energy Industry in South Africa Industry
- December 2022: The sixth renewable energy auction concluded, resulting in the lowest bid of USD 0.02689/kWh. Five solar projects with a combined capacity of 860 MW were selected. This milestone demonstrates significant cost reductions and increased competition in the sector.
- October 2022: The African Development Bank granted USD 2.5 Million to Mozambique for renewable energy integration. While not directly impacting South Africa, this highlights regional efforts and potential future collaboration.
Strategic Outlook for Renewable Energy Industry in South Africa Market
The South African renewable energy market is strategically positioned for sustained and robust growth throughout the forecast period. This positive trajectory is underpinned by continued policy support, ongoing cost reductions in renewable technologies, and an increasing national energy demand. Key strategic opportunities lie in targeted investments in cutting-edge and innovative technologies, the critical development of resilient and modern grid infrastructure capable of accommodating higher renewable penetration, and the proactive fostering of collaborative partnerships to accelerate the nation's energy transition. Further market expansion, with a particular emphasis on reaching previously underserved geographical areas and economic sectors, remains a significant and compelling growth driver. The market is exceptionally well-poised for sustained expansion, provided that existing infrastructural bottlenecks and regulatory complexities can be effectively navigated and overcome. A proactive and adaptive approach to these challenges will be paramount for unlocking the full potential of South Africa's renewable energy future.
Renewable Energy Industry in South Africa Segmentation
-
1. Source
- 1.1. Solar
- 1.2. Wind
- 1.3. Others
-
2. Geogrpahy
- 2.1. South Africa
- 2.2. Zambia
- 2.3. Mozambique
- 2.4. Angola
- 2.5. Rest of Southern Africa
Renewable Energy Industry in South Africa Segmentation By Geography
-
1. North America
- 1.1. United States
- 1.2. Canada
- 1.3. Mexico
-
2. South America
- 2.1. Brazil
- 2.2. Argentina
- 2.3. Rest of South America
-
3. Europe
- 3.1. United Kingdom
- 3.2. Germany
- 3.3. France
- 3.4. Italy
- 3.5. Spain
- 3.6. Russia
- 3.7. Benelux
- 3.8. Nordics
- 3.9. Rest of Europe
-
4. Middle East & Africa
- 4.1. Turkey
- 4.2. Israel
- 4.3. GCC
- 4.4. North Africa
- 4.5. South Africa
- 4.6. Rest of Middle East & Africa
-
5. Asia Pacific
- 5.1. China
- 5.2. India
- 5.3. Japan
- 5.4. South Korea
- 5.5. ASEAN
- 5.6. Oceania
- 5.7. Rest of Asia Pacific
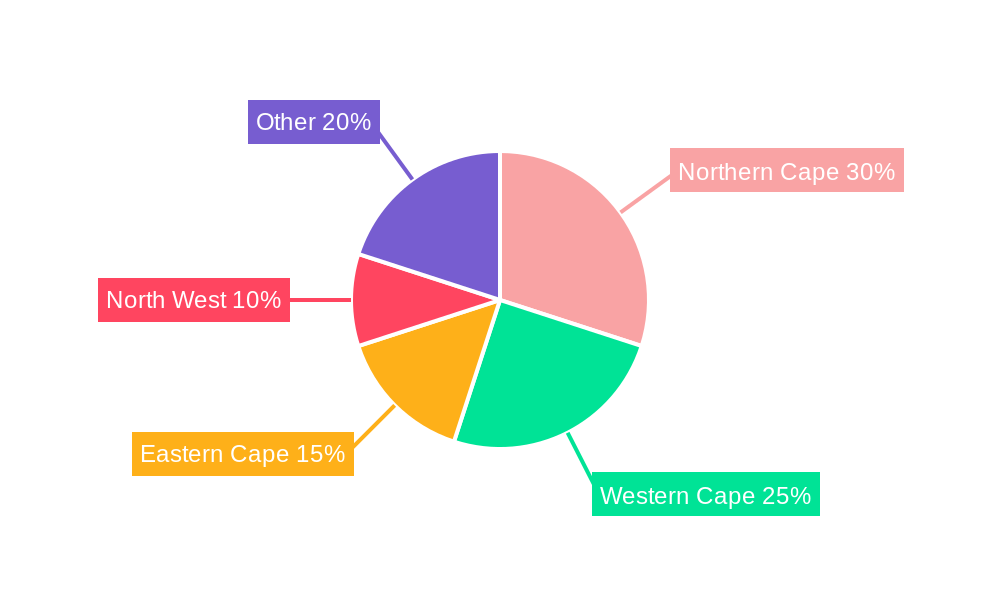
Renewable Energy Industry in South Africa Regional Market Share
Geographic Coverage of Renewable Energy Industry in South Africa
Renewable Energy Industry in South Africa REPORT HIGHLIGHTS
| Aspects | Details |
|---|---|
| Study Period | 2020-2034 |
| Base Year | 2025 |
| Estimated Year | 2026 |
| Forecast Period | 2026-2034 |
| Historical Period | 2020-2025 |
| Growth Rate | CAGR of 8.5% from 2020-2034 |
| Segmentation |
|
Table of Contents
- 1. Introduction
- 1.1. Research Scope
- 1.2. Market Segmentation
- 1.3. Research Methodology
- 1.4. Definitions and Assumptions
- 2. Executive Summary
- 2.1. Introduction
- 3. Market Dynamics
- 3.1. Introduction
- 3.2. Market Drivers
- 3.3. Market Restrains
- 3.4. Market Trends
- 3.4.1. Solar Energy is Expected to Drive the Market
- 4. Market Factor Analysis
- 4.1. Porters Five Forces
- 4.2. Supply/Value Chain
- 4.3. PESTEL analysis
- 4.4. Market Entropy
- 4.5. Patent/Trademark Analysis
- 5. Global Renewable Energy Industry in South Africa Analysis, Insights and Forecast, 2020-2032
- 5.1. Market Analysis, Insights and Forecast - by Source
- 5.1.1. Solar
- 5.1.2. Wind
- 5.1.3. Others
- 5.2. Market Analysis, Insights and Forecast - by Geogrpahy
- 5.2.1. South Africa
- 5.2.2. Zambia
- 5.2.3. Mozambique
- 5.2.4. Angola
- 5.2.5. Rest of Southern Africa
- 5.3. Market Analysis, Insights and Forecast - by Region
- 5.3.1. North America
- 5.3.2. South America
- 5.3.3. Europe
- 5.3.4. Middle East & Africa
- 5.3.5. Asia Pacific
- 5.1. Market Analysis, Insights and Forecast - by Source
- 6. North America Renewable Energy Industry in South Africa Analysis, Insights and Forecast, 2020-2032
- 6.1. Market Analysis, Insights and Forecast - by Source
- 6.1.1. Solar
- 6.1.2. Wind
- 6.1.3. Others
- 6.2. Market Analysis, Insights and Forecast - by Geogrpahy
- 6.2.1. South Africa
- 6.2.2. Zambia
- 6.2.3. Mozambique
- 6.2.4. Angola
- 6.2.5. Rest of Southern Africa
- 6.1. Market Analysis, Insights and Forecast - by Source
- 7. South America Renewable Energy Industry in South Africa Analysis, Insights and Forecast, 2020-2032
- 7.1. Market Analysis, Insights and Forecast - by Source
- 7.1.1. Solar
- 7.1.2. Wind
- 7.1.3. Others
- 7.2. Market Analysis, Insights and Forecast - by Geogrpahy
- 7.2.1. South Africa
- 7.2.2. Zambia
- 7.2.3. Mozambique
- 7.2.4. Angola
- 7.2.5. Rest of Southern Africa
- 7.1. Market Analysis, Insights and Forecast - by Source
- 8. Europe Renewable Energy Industry in South Africa Analysis, Insights and Forecast, 2020-2032
- 8.1. Market Analysis, Insights and Forecast - by Source
- 8.1.1. Solar
- 8.1.2. Wind
- 8.1.3. Others
- 8.2. Market Analysis, Insights and Forecast - by Geogrpahy
- 8.2.1. South Africa
- 8.2.2. Zambia
- 8.2.3. Mozambique
- 8.2.4. Angola
- 8.2.5. Rest of Southern Africa
- 8.1. Market Analysis, Insights and Forecast - by Source
- 9. Middle East & Africa Renewable Energy Industry in South Africa Analysis, Insights and Forecast, 2020-2032
- 9.1. Market Analysis, Insights and Forecast - by Source
- 9.1.1. Solar
- 9.1.2. Wind
- 9.1.3. Others
- 9.2. Market Analysis, Insights and Forecast - by Geogrpahy
- 9.2.1. South Africa
- 9.2.2. Zambia
- 9.2.3. Mozambique
- 9.2.4. Angola
- 9.2.5. Rest of Southern Africa
- 9.1. Market Analysis, Insights and Forecast - by Source
- 10. Asia Pacific Renewable Energy Industry in South Africa Analysis, Insights and Forecast, 2020-2032
- 10.1. Market Analysis, Insights and Forecast - by Source
- 10.1.1. Solar
- 10.1.2. Wind
- 10.1.3. Others
- 10.2. Market Analysis, Insights and Forecast - by Geogrpahy
- 10.2.1. South Africa
- 10.2.2. Zambia
- 10.2.3. Mozambique
- 10.2.4. Angola
- 10.2.5. Rest of Southern Africa
- 10.1. Market Analysis, Insights and Forecast - by Source
- 11. Competitive Analysis
- 11.1. Global Market Share Analysis 2025
- 11.2. Company Profiles
- 11.2.1 JinkoSolar Holding Co Ltd
- 11.2.1.1. Overview
- 11.2.1.2. Products
- 11.2.1.3. SWOT Analysis
- 11.2.1.4. Recent Developments
- 11.2.1.5. Financials (Based on Availability)
- 11.2.2 Nordex SE
- 11.2.2.1. Overview
- 11.2.2.2. Products
- 11.2.2.3. SWOT Analysis
- 11.2.2.4. Recent Developments
- 11.2.2.5. Financials (Based on Availability)
- 11.2.3 Juwi Solar Inc
- 11.2.3.1. Overview
- 11.2.3.2. Products
- 11.2.3.3. SWOT Analysis
- 11.2.3.4. Recent Developments
- 11.2.3.5. Financials (Based on Availability)
- 11.2.4 Vestas Wind Systems A/S
- 11.2.4.1. Overview
- 11.2.4.2. Products
- 11.2.4.3. SWOT Analysis
- 11.2.4.4. Recent Developments
- 11.2.4.5. Financials (Based on Availability)
- 11.2.5 Siemens Gamesa Renewable Energy SA
- 11.2.5.1. Overview
- 11.2.5.2. Products
- 11.2.5.3. SWOT Analysis
- 11.2.5.4. Recent Developments
- 11.2.5.5. Financials (Based on Availability)
- 11.2.6 First Solar Inc
- 11.2.6.1. Overview
- 11.2.6.2. Products
- 11.2.6.3. SWOT Analysis
- 11.2.6.4. Recent Developments
- 11.2.6.5. Financials (Based on Availability)
- 11.2.7 Scatec Solar ASA
- 11.2.7.1. Overview
- 11.2.7.2. Products
- 11.2.7.3. SWOT Analysis
- 11.2.7.4. Recent Developments
- 11.2.7.5. Financials (Based on Availability)
- 11.2.8 Acciona SA
- 11.2.8.1. Overview
- 11.2.8.2. Products
- 11.2.8.3. SWOT Analysis
- 11.2.8.4. Recent Developments
- 11.2.8.5. Financials (Based on Availability)
- 11.2.9 Juwi AG*List Not Exhaustive
- 11.2.9.1. Overview
- 11.2.9.2. Products
- 11.2.9.3. SWOT Analysis
- 11.2.9.4. Recent Developments
- 11.2.9.5. Financials (Based on Availability)
- 11.2.1 JinkoSolar Holding Co Ltd
List of Figures
- Figure 1: Global Renewable Energy Industry in South Africa Revenue Breakdown (million, %) by Region 2025 & 2033
- Figure 2: North America Renewable Energy Industry in South Africa Revenue (million), by Source 2025 & 2033
- Figure 3: North America Renewable Energy Industry in South Africa Revenue Share (%), by Source 2025 & 2033
- Figure 4: North America Renewable Energy Industry in South Africa Revenue (million), by Geogrpahy 2025 & 2033
- Figure 5: North America Renewable Energy Industry in South Africa Revenue Share (%), by Geogrpahy 2025 & 2033
- Figure 6: North America Renewable Energy Industry in South Africa Revenue (million), by Country 2025 & 2033
- Figure 7: North America Renewable Energy Industry in South Africa Revenue Share (%), by Country 2025 & 2033
- Figure 8: South America Renewable Energy Industry in South Africa Revenue (million), by Source 2025 & 2033
- Figure 9: South America Renewable Energy Industry in South Africa Revenue Share (%), by Source 2025 & 2033
- Figure 10: South America Renewable Energy Industry in South Africa Revenue (million), by Geogrpahy 2025 & 2033
- Figure 11: South America Renewable Energy Industry in South Africa Revenue Share (%), by Geogrpahy 2025 & 2033
- Figure 12: South America Renewable Energy Industry in South Africa Revenue (million), by Country 2025 & 2033
- Figure 13: South America Renewable Energy Industry in South Africa Revenue Share (%), by Country 2025 & 2033
- Figure 14: Europe Renewable Energy Industry in South Africa Revenue (million), by Source 2025 & 2033
- Figure 15: Europe Renewable Energy Industry in South Africa Revenue Share (%), by Source 2025 & 2033
- Figure 16: Europe Renewable Energy Industry in South Africa Revenue (million), by Geogrpahy 2025 & 2033
- Figure 17: Europe Renewable Energy Industry in South Africa Revenue Share (%), by Geogrpahy 2025 & 2033
- Figure 18: Europe Renewable Energy Industry in South Africa Revenue (million), by Country 2025 & 2033
- Figure 19: Europe Renewable Energy Industry in South Africa Revenue Share (%), by Country 2025 & 2033
- Figure 20: Middle East & Africa Renewable Energy Industry in South Africa Revenue (million), by Source 2025 & 2033
- Figure 21: Middle East & Africa Renewable Energy Industry in South Africa Revenue Share (%), by Source 2025 & 2033
- Figure 22: Middle East & Africa Renewable Energy Industry in South Africa Revenue (million), by Geogrpahy 2025 & 2033
- Figure 23: Middle East & Africa Renewable Energy Industry in South Africa Revenue Share (%), by Geogrpahy 2025 & 2033
- Figure 24: Middle East & Africa Renewable Energy Industry in South Africa Revenue (million), by Country 2025 & 2033
- Figure 25: Middle East & Africa Renewable Energy Industry in South Africa Revenue Share (%), by Country 2025 & 2033
- Figure 26: Asia Pacific Renewable Energy Industry in South Africa Revenue (million), by Source 2025 & 2033
- Figure 27: Asia Pacific Renewable Energy Industry in South Africa Revenue Share (%), by Source 2025 & 2033
- Figure 28: Asia Pacific Renewable Energy Industry in South Africa Revenue (million), by Geogrpahy 2025 & 2033
- Figure 29: Asia Pacific Renewable Energy Industry in South Africa Revenue Share (%), by Geogrpahy 2025 & 2033
- Figure 30: Asia Pacific Renewable Energy Industry in South Africa Revenue (million), by Country 2025 & 2033
- Figure 31: Asia Pacific Renewable Energy Industry in South Africa Revenue Share (%), by Country 2025 & 2033
List of Tables
- Table 1: Global Renewable Energy Industry in South Africa Revenue million Forecast, by Source 2020 & 2033
- Table 2: Global Renewable Energy Industry in South Africa Revenue million Forecast, by Geogrpahy 2020 & 2033
- Table 3: Global Renewable Energy Industry in South Africa Revenue million Forecast, by Region 2020 & 2033
- Table 4: Global Renewable Energy Industry in South Africa Revenue million Forecast, by Source 2020 & 2033
- Table 5: Global Renewable Energy Industry in South Africa Revenue million Forecast, by Geogrpahy 2020 & 2033
- Table 6: Global Renewable Energy Industry in South Africa Revenue million Forecast, by Country 2020 & 2033
- Table 7: United States Renewable Energy Industry in South Africa Revenue (million) Forecast, by Application 2020 & 2033
- Table 8: Canada Renewable Energy Industry in South Africa Revenue (million) Forecast, by Application 2020 & 2033
- Table 9: Mexico Renewable Energy Industry in South Africa Revenue (million) Forecast, by Application 2020 & 2033
- Table 10: Global Renewable Energy Industry in South Africa Revenue million Forecast, by Source 2020 & 2033
- Table 11: Global Renewable Energy Industry in South Africa Revenue million Forecast, by Geogrpahy 2020 & 2033
- Table 12: Global Renewable Energy Industry in South Africa Revenue million Forecast, by Country 2020 & 2033
- Table 13: Brazil Renewable Energy Industry in South Africa Revenue (million) Forecast, by Application 2020 & 2033
- Table 14: Argentina Renewable Energy Industry in South Africa Revenue (million) Forecast, by Application 2020 & 2033
- Table 15: Rest of South America Renewable Energy Industry in South Africa Revenue (million) Forecast, by Application 2020 & 2033
- Table 16: Global Renewable Energy Industry in South Africa Revenue million Forecast, by Source 2020 & 2033
- Table 17: Global Renewable Energy Industry in South Africa Revenue million Forecast, by Geogrpahy 2020 & 2033
- Table 18: Global Renewable Energy Industry in South Africa Revenue million Forecast, by Country 2020 & 2033
- Table 19: United Kingdom Renewable Energy Industry in South Africa Revenue (million) Forecast, by Application 2020 & 2033
- Table 20: Germany Renewable Energy Industry in South Africa Revenue (million) Forecast, by Application 2020 & 2033
- Table 21: France Renewable Energy Industry in South Africa Revenue (million) Forecast, by Application 2020 & 2033
- Table 22: Italy Renewable Energy Industry in South Africa Revenue (million) Forecast, by Application 2020 & 2033
- Table 23: Spain Renewable Energy Industry in South Africa Revenue (million) Forecast, by Application 2020 & 2033
- Table 24: Russia Renewable Energy Industry in South Africa Revenue (million) Forecast, by Application 2020 & 2033
- Table 25: Benelux Renewable Energy Industry in South Africa Revenue (million) Forecast, by Application 2020 & 2033
- Table 26: Nordics Renewable Energy Industry in South Africa Revenue (million) Forecast, by Application 2020 & 2033
- Table 27: Rest of Europe Renewable Energy Industry in South Africa Revenue (million) Forecast, by Application 2020 & 2033
- Table 28: Global Renewable Energy Industry in South Africa Revenue million Forecast, by Source 2020 & 2033
- Table 29: Global Renewable Energy Industry in South Africa Revenue million Forecast, by Geogrpahy 2020 & 2033
- Table 30: Global Renewable Energy Industry in South Africa Revenue million Forecast, by Country 2020 & 2033
- Table 31: Turkey Renewable Energy Industry in South Africa Revenue (million) Forecast, by Application 2020 & 2033
- Table 32: Israel Renewable Energy Industry in South Africa Revenue (million) Forecast, by Application 2020 & 2033
- Table 33: GCC Renewable Energy Industry in South Africa Revenue (million) Forecast, by Application 2020 & 2033
- Table 34: North Africa Renewable Energy Industry in South Africa Revenue (million) Forecast, by Application 2020 & 2033
- Table 35: South Africa Renewable Energy Industry in South Africa Revenue (million) Forecast, by Application 2020 & 2033
- Table 36: Rest of Middle East & Africa Renewable Energy Industry in South Africa Revenue (million) Forecast, by Application 2020 & 2033
- Table 37: Global Renewable Energy Industry in South Africa Revenue million Forecast, by Source 2020 & 2033
- Table 38: Global Renewable Energy Industry in South Africa Revenue million Forecast, by Geogrpahy 2020 & 2033
- Table 39: Global Renewable Energy Industry in South Africa Revenue million Forecast, by Country 2020 & 2033
- Table 40: China Renewable Energy Industry in South Africa Revenue (million) Forecast, by Application 2020 & 2033
- Table 41: India Renewable Energy Industry in South Africa Revenue (million) Forecast, by Application 2020 & 2033
- Table 42: Japan Renewable Energy Industry in South Africa Revenue (million) Forecast, by Application 2020 & 2033
- Table 43: South Korea Renewable Energy Industry in South Africa Revenue (million) Forecast, by Application 2020 & 2033
- Table 44: ASEAN Renewable Energy Industry in South Africa Revenue (million) Forecast, by Application 2020 & 2033
- Table 45: Oceania Renewable Energy Industry in South Africa Revenue (million) Forecast, by Application 2020 & 2033
- Table 46: Rest of Asia Pacific Renewable Energy Industry in South Africa Revenue (million) Forecast, by Application 2020 & 2033
Frequently Asked Questions
1. What is the projected Compound Annual Growth Rate (CAGR) of the Renewable Energy Industry in South Africa?
The projected CAGR is approximately 8.5%.
2. Which companies are prominent players in the Renewable Energy Industry in South Africa?
Key companies in the market include JinkoSolar Holding Co Ltd, Nordex SE, Juwi Solar Inc, Vestas Wind Systems A/S, Siemens Gamesa Renewable Energy SA, First Solar Inc, Scatec Solar ASA, Acciona SA, Juwi AG*List Not Exhaustive.
3. What are the main segments of the Renewable Energy Industry in South Africa?
The market segments include Source, Geogrpahy.
4. Can you provide details about the market size?
The market size is estimated to be USD 100270.5 million as of 2022.
5. What are some drivers contributing to market growth?
N/A
6. What are the notable trends driving market growth?
Solar Energy is Expected to Drive the Market.
7. Are there any restraints impacting market growth?
N/A
8. Can you provide examples of recent developments in the market?
December 2022: the sixth renewable auction in South Africa concluded with the lowest bid of USD 0.02689/kWh. South Africa selected five solar projects with a combined capacity of 860 MW.
9. What pricing options are available for accessing the report?
Pricing options include single-user, multi-user, and enterprise licenses priced at USD 4750, USD 5250, and USD 8750 respectively.
10. Is the market size provided in terms of value or volume?
The market size is provided in terms of value, measured in million.
11. Are there any specific market keywords associated with the report?
Yes, the market keyword associated with the report is "Renewable Energy Industry in South Africa," which aids in identifying and referencing the specific market segment covered.
12. How do I determine which pricing option suits my needs best?
The pricing options vary based on user requirements and access needs. Individual users may opt for single-user licenses, while businesses requiring broader access may choose multi-user or enterprise licenses for cost-effective access to the report.
13. Are there any additional resources or data provided in the Renewable Energy Industry in South Africa report?
While the report offers comprehensive insights, it's advisable to review the specific contents or supplementary materials provided to ascertain if additional resources or data are available.
14. How can I stay updated on further developments or reports in the Renewable Energy Industry in South Africa?
To stay informed about further developments, trends, and reports in the Renewable Energy Industry in South Africa, consider subscribing to industry newsletters, following relevant companies and organizations, or regularly checking reputable industry news sources and publications.
Methodology
Step 1 - Identification of Relevant Samples Size from Population Database


Step 2 - Approaches for Defining Global Market Size (Value, Volume* & Price*)

Note*: In applicable scenarios
Step 3 - Data Sources
Primary Research
- Web Analytics
- Survey Reports
- Research Institute
- Latest Research Reports
- Opinion Leaders
Secondary Research
- Annual Reports
- White Paper
- Latest Press Release
- Industry Association
- Paid Database
- Investor Presentations

Step 4 - Data Triangulation
Involves using different sources of information in order to increase the validity of a study
These sources are likely to be stakeholders in a program - participants, other researchers, program staff, other community members, and so on.
Then we put all data in single framework & apply various statistical tools to find out the dynamic on the market.
During the analysis stage, feedback from the stakeholder groups would be compared to determine areas of agreement as well as areas of divergence