

Key Insights
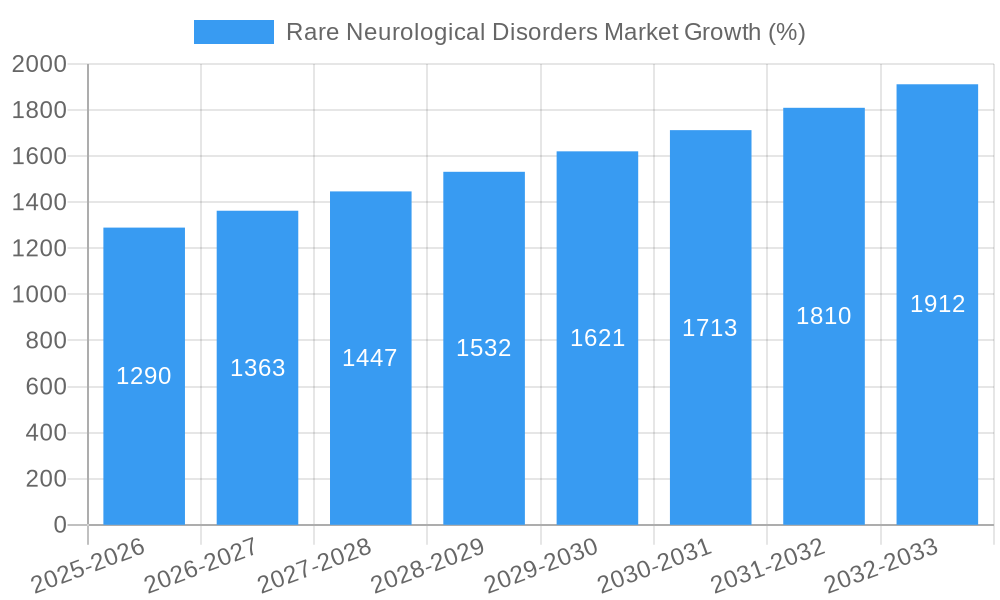
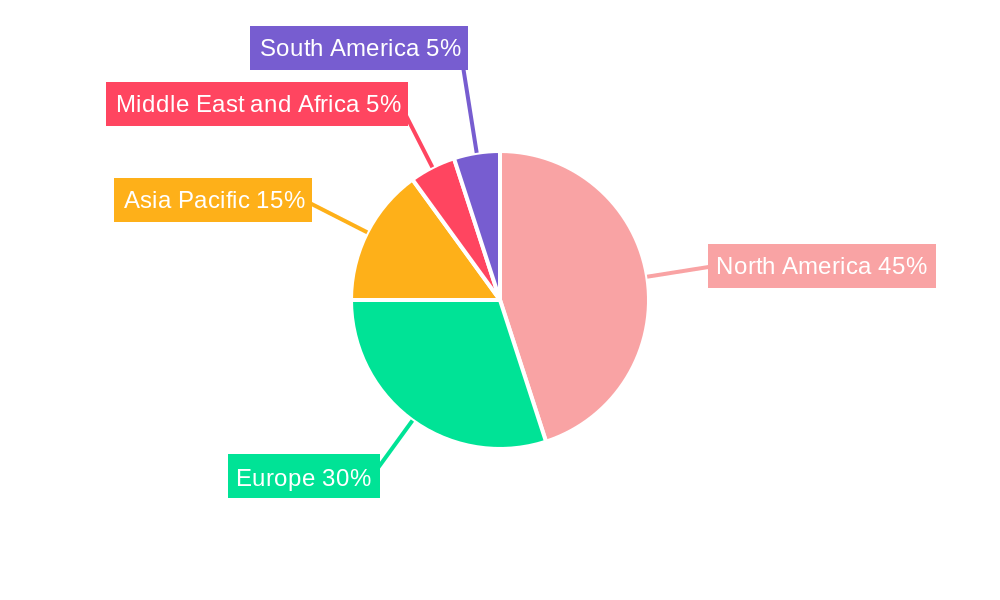
The Rare Neurological Disorders market is experiencing robust growth, projected to reach a substantial size by 2033, driven by several key factors. The market's Compound Annual Growth Rate (CAGR) of 8.60% from 2019-2024 indicates a consistently expanding demand for treatments. This growth is fueled by increasing prevalence of rare neurological disorders, advancements in diagnostic technologies leading to earlier and more accurate diagnoses, and a surge in research and development efforts focused on innovative therapies. The market is segmented by drug type (biologics and small molecules) and mode of administration (intravenous and oral), reflecting the diverse treatment approaches employed. Biologics, given their complex mechanisms and often targeted nature, likely command a higher price point and contribute significantly to market value. Similarly, intravenous administration, while often more costly, may be necessary for certain conditions, impacting overall market revenue. Competition is fierce, with major pharmaceutical players like Novartis, Biogen, and Roche vying for market share alongside smaller, specialized companies focusing on niche treatments. Geographical distribution shows a concentration in developed regions like North America and Europe, due to factors such as higher healthcare expenditure and greater access to advanced therapies; however, emerging markets are expected to witness significant growth in the coming years.
Market restraints include the high cost of developing and manufacturing treatments for rare disorders, often impacting patient accessibility. Regulatory hurdles and lengthy clinical trial processes also pose challenges. Despite these limitations, the significant unmet medical need coupled with continuous innovation in drug discovery and development strongly supports a positive outlook for long-term growth. The market is predicted to witness an expansion of treatment options across various rare neurological disorders, leading to improved patient outcomes and potentially higher market penetration. Furthermore, the increasing focus on personalized medicine and the development of targeted therapies tailored to specific genetic subtypes are anticipated to further propel market expansion.
Rare Neurological Disorders Market: A Comprehensive Report (2019-2033)
This comprehensive report provides an in-depth analysis of the Rare Neurological Disorders Market, offering invaluable insights for stakeholders across the pharmaceutical and biotechnology industries. The study period spans from 2019 to 2033, with 2025 serving as the base and estimated year. The report projects significant market growth, driven by factors detailed within. Download now to gain a competitive edge.
Rare Neurological Disorders Market Market Dynamics & Concentration
The Rare Neurological Disorders Market is characterized by a moderately concentrated landscape, with a few large pharmaceutical companies holding significant market share. However, the market exhibits considerable dynamism, fueled by ongoing innovation in drug development and a growing understanding of these complex conditions. The market share held by the top five players is estimated at xx%, indicating opportunities for both established players and emerging companies.
Market Concentration Metrics:
- Top 5 Players Market Share: xx%
- Average Market Share of Top 10 Players: xx%
- Number of M&A Deals (2019-2024): xx
Innovation Drivers:
- Advancements in gene therapy and personalized medicine.
- Increased investment in research and development (R&D).
- Growing understanding of disease mechanisms.
Regulatory Frameworks:
- Stringent regulatory approvals processes for new therapies.
- Orphan drug designations and incentives influencing market dynamics.
Product Substitutes & End-User Trends:
- Limited viable substitutes for many rare neurological disorder treatments.
- Growing patient advocacy and increased awareness driving demand.
- Shift toward personalized therapies tailored to specific patient populations.
M&A Activities: The market has witnessed a significant number of mergers and acquisitions (M&As) in recent years, reflecting the strategic importance of this sector for large pharmaceutical companies looking to expand their portfolios and capitalize on new treatment options.
Rare Neurological Disorders Market Industry Trends & Analysis
The Rare Neurological Disorders Market is projected to experience substantial growth, with a Compound Annual Growth Rate (CAGR) of xx% during the forecast period (2025-2033). This growth is driven by several key factors, including:
- Rising Prevalence: The increasing incidence of rare neurological disorders globally contributes significantly to market expansion.
- Technological Advancements: Breakthroughs in gene editing, targeted therapies, and improved diagnostic tools are driving innovation and treatment effectiveness.
- Increased Investment in R&D: Pharmaceutical companies are significantly investing in research to develop novel therapies, leading to a pipeline of promising treatments.
- Growing Awareness: Heightened public and professional awareness of rare neurological disorders is leading to earlier diagnosis and improved treatment accessibility.
- Favorable Regulatory Environment: Incentives offered to pharmaceutical companies through orphan drug designations are fostering development in this space.
- Market Penetration: The market penetration rate for effective treatments remains relatively low, signifying significant untapped potential.
Leading Markets & Segments in Rare Neurological Disorders Market
The North American region currently dominates the Rare Neurological Disorders Market, driven by factors such as high healthcare expenditure, advanced healthcare infrastructure, and robust regulatory frameworks. However, emerging markets in Asia-Pacific are demonstrating substantial growth potential.
By Drug Type:
- Biologics: This segment holds a larger market share due to their efficacy and complexity, commanding a higher price point and significant growth projections.
- Small Molecules: This segment offers advantages in terms of manufacturing and cost-effectiveness, making it increasingly competitive.
By Mode of Administration:
- Intravenous: This route is crucial for delivering complex biologics and ensuring rapid treatment effect.
- Oral: The preference for oral medication due to convenience drives considerable growth within this segment.
Key Drivers for Dominant Regions:
- North America: High healthcare spending, advanced research infrastructure, and favorable regulatory policies.
- Europe: Well-established healthcare systems and a strong regulatory framework.
- Asia-Pacific: Rapidly growing economies, expanding healthcare infrastructure, and a large patient population.
Rare Neurological Disorders Market Product Developments
Recent years have witnessed significant advancements in the development of targeted therapies, including gene therapies and novel small molecules. These innovations offer improved efficacy, enhanced safety profiles, and more convenient administration routes. This focus on precision medicine is further driven by the understanding that rare neurological disorders are often highly heterogeneous, requiring personalized approaches. The market is witnessing a shift towards more effective treatments that address underlying disease mechanisms rather than just managing symptoms.
Key Drivers of Rare Neurological Disorders Market Growth
Several factors are driving the expansion of the Rare Neurological Disorders Market:
- Technological advancements: Innovations in gene therapy, biomarker discovery, and drug delivery systems are key drivers.
- Economic factors: Increased healthcare spending and insurance coverage are boosting market growth.
- Regulatory support: Orphan drug designations and streamlined regulatory processes encourage R&D investment.
Challenges in the Rare Neurological Disorders Market Market
The market faces significant challenges, including:
- High R&D costs: Developing treatments for rare diseases is expensive and time-consuming.
- Limited patient populations: The small number of patients for each disorder makes clinical trials challenging.
- Regulatory hurdles: Strict regulations increase the complexity and cost of drug development and approval.
- Supply chain complexities: Ensuring consistent access to specialty drugs can be difficult.
Emerging Opportunities in Rare Neurological Disorders Market
Emerging opportunities lie in technological breakthroughs, specifically advancements in gene editing and personalized medicine, that are yielding more effective and targeted therapies. Strategic partnerships between pharmaceutical companies, academic institutions, and patient advocacy groups are fostering collaboration and accelerating innovation. Market expansion into emerging economies with substantial unmet medical needs also presents significant potential for growth.
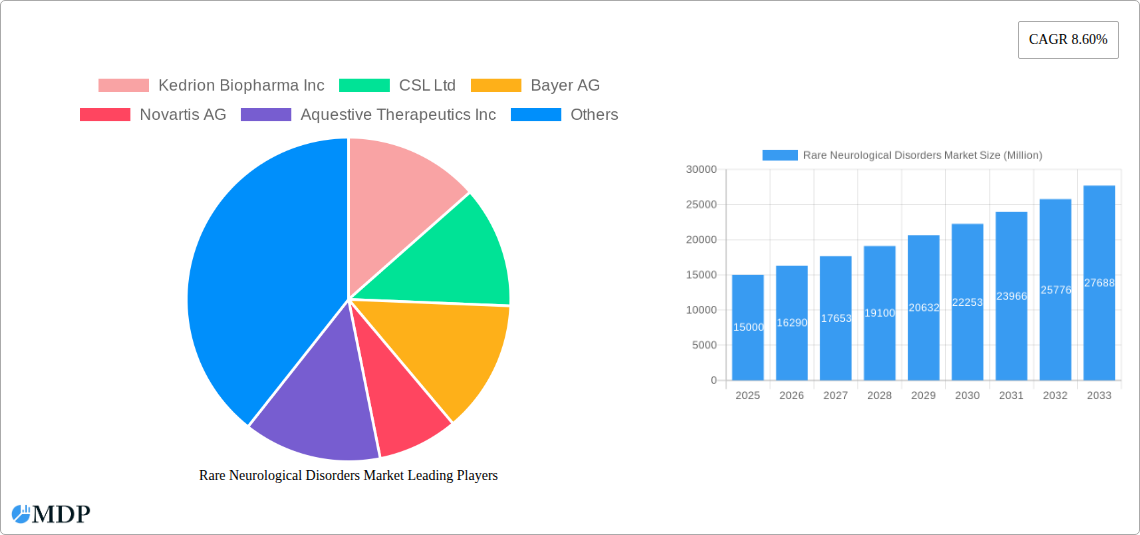
Leading Players in the Rare Neurological Disorders Market Sector
- Kedrion Biopharma Inc
- CSL Ltd
- Bayer AG
- Novartis AG
- Aquestive Therapeutics Inc
- US WorldMeds LLC (Solstice Neurosciences LLC)
- Merz Pharma GmbH & Co KGaA
- Teva Pharmaceutical Industries Ltd
- Merck & Co Inc (EMD Serono Inc )
- Biogen Inc
- F Hoffmann - La Roche Ltd
- Pfizer Inc
Key Milestones in Rare Neurological Disorders Market Industry
- July 2021: Roche launched Evrysdi in India for spinal muscular atrophy. This significantly expanded access to treatment in a large, underserved population, demonstrating the market's growing global reach.
- September 2021: NeuExcell Therapeutics and Spark Therapeutics collaborated on a gene therapy for Huntington's Disease. This collaboration highlights the increasing importance of gene therapy in treating rare neurological disorders and the potential for significant breakthroughs in the future.
Strategic Outlook for Rare Neurological Disorders Market Market
The Rare Neurological Disorders Market is poised for continued strong growth, driven by a confluence of factors including advancements in precision medicine, increased R&D investments, and expanding access to novel therapies. Strategic partnerships and acquisitions will play a pivotal role in shaping the market landscape, while continued investment in research will remain critical for driving future innovations. The market's long-term potential is significant, with substantial opportunities for companies that can effectively leverage these trends.
Rare Neurological Disorders Market Segmentation
-
1. Drug Type
- 1.1. Biologics
- 1.2. Small Molecules
-
2. Mode of Administration
- 2.1. Intravenous
- 2.2. Oral
Rare Neurological Disorders Market Segmentation By Geography
-
1. North America
- 1.1. United States
- 1.2. Canada
- 1.3. Mexico
-
2. Europe
- 2.1. Germany
- 2.2. United Kingdom
- 2.3. France
- 2.4. Italy
- 2.5. Spain
- 2.6. Rest of Europe
-
3. Asia Pacific
- 3.1. China
- 3.2. Japan
- 3.3. India
- 3.4. Australia
- 3.5. South Korea
- 3.6. Rest of Asia Pacific
-
4. Middle East and Africa
- 4.1. GCC
- 4.2. South Africa
- 4.3. Rest of Middle East and Africa
-
5. South America
- 5.1. Brazil
- 5.2. Argentina
- 5.3. Rest of South America
Rare Neurological Disorders Market REPORT HIGHLIGHTS
| Aspects | Details |
|---|---|
| Study Period | 2019-2033 |
| Base Year | 2024 |
| Estimated Year | 2025 |
| Forecast Period | 2025-2033 |
| Historical Period | 2019-2024 |
| Growth Rate | CAGR of 8.60% from 2019-2033 |
| Segmentation |
|
Table of Contents
- 1. Introduction
- 1.1. Research Scope
- 1.2. Market Segmentation
- 1.3. Research Methodology
- 1.4. Definitions and Assumptions
- 2. Executive Summary
- 2.1. Introduction
- 3. Market Dynamics
- 3.1. Introduction
- 3.2. Market Drivers
- 3.2.1. Increasing Prevalence of Rare Neurological Diseases; Promising Pipeline Drugs for Treatment of Rare Neurological Diseases; Favorable Government Policies Worldwide for Speeding up Diagnostic Processes
- 3.3. Market Restrains
- 3.3.1. High Cost of Rare Neurological Disease Treatment
- 3.4. Market Trends
- 3.4.1. The Small Molecules Segment is Expected to Hold a Major Share in the Rare Neurological Disease Treatment Market
- 4. Market Factor Analysis
- 4.1. Porters Five Forces
- 4.2. Supply/Value Chain
- 4.3. PESTEL analysis
- 4.4. Market Entropy
- 4.5. Patent/Trademark Analysis
- 5. Global Rare Neurological Disorders Market Analysis, Insights and Forecast, 2019-2031
- 5.1. Market Analysis, Insights and Forecast - by Drug Type
- 5.1.1. Biologics
- 5.1.2. Small Molecules
- 5.2. Market Analysis, Insights and Forecast - by Mode of Administration
- 5.2.1. Intravenous
- 5.2.2. Oral
- 5.3. Market Analysis, Insights and Forecast - by Region
- 5.3.1. North America
- 5.3.2. Europe
- 5.3.3. Asia Pacific
- 5.3.4. Middle East and Africa
- 5.3.5. South America
- 5.1. Market Analysis, Insights and Forecast - by Drug Type
- 6. North America Rare Neurological Disorders Market Analysis, Insights and Forecast, 2019-2031
- 6.1. Market Analysis, Insights and Forecast - by Drug Type
- 6.1.1. Biologics
- 6.1.2. Small Molecules
- 6.2. Market Analysis, Insights and Forecast - by Mode of Administration
- 6.2.1. Intravenous
- 6.2.2. Oral
- 6.1. Market Analysis, Insights and Forecast - by Drug Type
- 7. Europe Rare Neurological Disorders Market Analysis, Insights and Forecast, 2019-2031
- 7.1. Market Analysis, Insights and Forecast - by Drug Type
- 7.1.1. Biologics
- 7.1.2. Small Molecules
- 7.2. Market Analysis, Insights and Forecast - by Mode of Administration
- 7.2.1. Intravenous
- 7.2.2. Oral
- 7.1. Market Analysis, Insights and Forecast - by Drug Type
- 8. Asia Pacific Rare Neurological Disorders Market Analysis, Insights and Forecast, 2019-2031
- 8.1. Market Analysis, Insights and Forecast - by Drug Type
- 8.1.1. Biologics
- 8.1.2. Small Molecules
- 8.2. Market Analysis, Insights and Forecast - by Mode of Administration
- 8.2.1. Intravenous
- 8.2.2. Oral
- 8.1. Market Analysis, Insights and Forecast - by Drug Type
- 9. Middle East and Africa Rare Neurological Disorders Market Analysis, Insights and Forecast, 2019-2031
- 9.1. Market Analysis, Insights and Forecast - by Drug Type
- 9.1.1. Biologics
- 9.1.2. Small Molecules
- 9.2. Market Analysis, Insights and Forecast - by Mode of Administration
- 9.2.1. Intravenous
- 9.2.2. Oral
- 9.1. Market Analysis, Insights and Forecast - by Drug Type
- 10. South America Rare Neurological Disorders Market Analysis, Insights and Forecast, 2019-2031
- 10.1. Market Analysis, Insights and Forecast - by Drug Type
- 10.1.1. Biologics
- 10.1.2. Small Molecules
- 10.2. Market Analysis, Insights and Forecast - by Mode of Administration
- 10.2.1. Intravenous
- 10.2.2. Oral
- 10.1. Market Analysis, Insights and Forecast - by Drug Type
- 11. North America Rare Neurological Disorders Market Analysis, Insights and Forecast, 2019-2031
- 11.1. Market Analysis, Insights and Forecast - By Country/Sub-region
- 11.1.1 United States
- 11.1.2 Canada
- 11.1.3 Mexico
- 12. Europe Rare Neurological Disorders Market Analysis, Insights and Forecast, 2019-2031
- 12.1. Market Analysis, Insights and Forecast - By Country/Sub-region
- 12.1.1 Germany
- 12.1.2 United Kingdom
- 12.1.3 France
- 12.1.4 Italy
- 12.1.5 Spain
- 12.1.6 Rest of Europe
- 13. Asia Pacific Rare Neurological Disorders Market Analysis, Insights and Forecast, 2019-2031
- 13.1. Market Analysis, Insights and Forecast - By Country/Sub-region
- 13.1.1 China
- 13.1.2 Japan
- 13.1.3 India
- 13.1.4 Australia
- 13.1.5 South Korea
- 13.1.6 Rest of Asia Pacific
- 14. Middle East and Africa Rare Neurological Disorders Market Analysis, Insights and Forecast, 2019-2031
- 14.1. Market Analysis, Insights and Forecast - By Country/Sub-region
- 14.1.1 GCC
- 14.1.2 South Africa
- 14.1.3 Rest of Middle East and Africa
- 15. South America Rare Neurological Disorders Market Analysis, Insights and Forecast, 2019-2031
- 15.1. Market Analysis, Insights and Forecast - By Country/Sub-region
- 15.1.1 Brazil
- 15.1.2 Argentina
- 15.1.3 Rest of South America
- 16. Competitive Analysis
- 16.1. Global Market Share Analysis 2024
- 16.2. Company Profiles
- 16.2.1 Kedrion Biopharma Inc
- 16.2.1.1. Overview
- 16.2.1.2. Products
- 16.2.1.3. SWOT Analysis
- 16.2.1.4. Recent Developments
- 16.2.1.5. Financials (Based on Availability)
- 16.2.2 CSL Ltd
- 16.2.2.1. Overview
- 16.2.2.2. Products
- 16.2.2.3. SWOT Analysis
- 16.2.2.4. Recent Developments
- 16.2.2.5. Financials (Based on Availability)
- 16.2.3 Bayer AG
- 16.2.3.1. Overview
- 16.2.3.2. Products
- 16.2.3.3. SWOT Analysis
- 16.2.3.4. Recent Developments
- 16.2.3.5. Financials (Based on Availability)
- 16.2.4 Novartis AG
- 16.2.4.1. Overview
- 16.2.4.2. Products
- 16.2.4.3. SWOT Analysis
- 16.2.4.4. Recent Developments
- 16.2.4.5. Financials (Based on Availability)
- 16.2.5 Aquestive Therapeutics Inc
- 16.2.5.1. Overview
- 16.2.5.2. Products
- 16.2.5.3. SWOT Analysis
- 16.2.5.4. Recent Developments
- 16.2.5.5. Financials (Based on Availability)
- 16.2.6 US WorldMeds LLC (Solstice Neurosciences LLC)
- 16.2.6.1. Overview
- 16.2.6.2. Products
- 16.2.6.3. SWOT Analysis
- 16.2.6.4. Recent Developments
- 16.2.6.5. Financials (Based on Availability)
- 16.2.7 Merz Pharma GmbH & Co KGaA
- 16.2.7.1. Overview
- 16.2.7.2. Products
- 16.2.7.3. SWOT Analysis
- 16.2.7.4. Recent Developments
- 16.2.7.5. Financials (Based on Availability)
- 16.2.8 Teva Pharmaceutical Industries Ltd
- 16.2.8.1. Overview
- 16.2.8.2. Products
- 16.2.8.3. SWOT Analysis
- 16.2.8.4. Recent Developments
- 16.2.8.5. Financials (Based on Availability)
- 16.2.9 Merck & Co Inc (EMD Serono Inc )
- 16.2.9.1. Overview
- 16.2.9.2. Products
- 16.2.9.3. SWOT Analysis
- 16.2.9.4. Recent Developments
- 16.2.9.5. Financials (Based on Availability)
- 16.2.10 Biogen Inc
- 16.2.10.1. Overview
- 16.2.10.2. Products
- 16.2.10.3. SWOT Analysis
- 16.2.10.4. Recent Developments
- 16.2.10.5. Financials (Based on Availability)
- 16.2.11 F Hoffmann - La Roche Ltd
- 16.2.11.1. Overview
- 16.2.11.2. Products
- 16.2.11.3. SWOT Analysis
- 16.2.11.4. Recent Developments
- 16.2.11.5. Financials (Based on Availability)
- 16.2.12 Pfizer Inc
- 16.2.12.1. Overview
- 16.2.12.2. Products
- 16.2.12.3. SWOT Analysis
- 16.2.12.4. Recent Developments
- 16.2.12.5. Financials (Based on Availability)
- 16.2.1 Kedrion Biopharma Inc
List of Figures
- Figure 1: Global Rare Neurological Disorders Market Revenue Breakdown (Million, %) by Region 2024 & 2032
- Figure 2: Global Rare Neurological Disorders Market Volume Breakdown (K Unit, %) by Region 2024 & 2032
- Figure 3: North America Rare Neurological Disorders Market Revenue (Million), by Country 2024 & 2032
- Figure 4: North America Rare Neurological Disorders Market Volume (K Unit), by Country 2024 & 2032
- Figure 5: North America Rare Neurological Disorders Market Revenue Share (%), by Country 2024 & 2032
- Figure 6: North America Rare Neurological Disorders Market Volume Share (%), by Country 2024 & 2032
- Figure 7: Europe Rare Neurological Disorders Market Revenue (Million), by Country 2024 & 2032
- Figure 8: Europe Rare Neurological Disorders Market Volume (K Unit), by Country 2024 & 2032
- Figure 9: Europe Rare Neurological Disorders Market Revenue Share (%), by Country 2024 & 2032
- Figure 10: Europe Rare Neurological Disorders Market Volume Share (%), by Country 2024 & 2032
- Figure 11: Asia Pacific Rare Neurological Disorders Market Revenue (Million), by Country 2024 & 2032
- Figure 12: Asia Pacific Rare Neurological Disorders Market Volume (K Unit), by Country 2024 & 2032
- Figure 13: Asia Pacific Rare Neurological Disorders Market Revenue Share (%), by Country 2024 & 2032
- Figure 14: Asia Pacific Rare Neurological Disorders Market Volume Share (%), by Country 2024 & 2032
- Figure 15: Middle East and Africa Rare Neurological Disorders Market Revenue (Million), by Country 2024 & 2032
- Figure 16: Middle East and Africa Rare Neurological Disorders Market Volume (K Unit), by Country 2024 & 2032
- Figure 17: Middle East and Africa Rare Neurological Disorders Market Revenue Share (%), by Country 2024 & 2032
- Figure 18: Middle East and Africa Rare Neurological Disorders Market Volume Share (%), by Country 2024 & 2032
- Figure 19: South America Rare Neurological Disorders Market Revenue (Million), by Country 2024 & 2032
- Figure 20: South America Rare Neurological Disorders Market Volume (K Unit), by Country 2024 & 2032
- Figure 21: South America Rare Neurological Disorders Market Revenue Share (%), by Country 2024 & 2032
- Figure 22: South America Rare Neurological Disorders Market Volume Share (%), by Country 2024 & 2032
- Figure 23: North America Rare Neurological Disorders Market Revenue (Million), by Drug Type 2024 & 2032
- Figure 24: North America Rare Neurological Disorders Market Volume (K Unit), by Drug Type 2024 & 2032
- Figure 25: North America Rare Neurological Disorders Market Revenue Share (%), by Drug Type 2024 & 2032
- Figure 26: North America Rare Neurological Disorders Market Volume Share (%), by Drug Type 2024 & 2032
- Figure 27: North America Rare Neurological Disorders Market Revenue (Million), by Mode of Administration 2024 & 2032
- Figure 28: North America Rare Neurological Disorders Market Volume (K Unit), by Mode of Administration 2024 & 2032
- Figure 29: North America Rare Neurological Disorders Market Revenue Share (%), by Mode of Administration 2024 & 2032
- Figure 30: North America Rare Neurological Disorders Market Volume Share (%), by Mode of Administration 2024 & 2032
- Figure 31: North America Rare Neurological Disorders Market Revenue (Million), by Country 2024 & 2032
- Figure 32: North America Rare Neurological Disorders Market Volume (K Unit), by Country 2024 & 2032
- Figure 33: North America Rare Neurological Disorders Market Revenue Share (%), by Country 2024 & 2032
- Figure 34: North America Rare Neurological Disorders Market Volume Share (%), by Country 2024 & 2032
- Figure 35: Europe Rare Neurological Disorders Market Revenue (Million), by Drug Type 2024 & 2032
- Figure 36: Europe Rare Neurological Disorders Market Volume (K Unit), by Drug Type 2024 & 2032
- Figure 37: Europe Rare Neurological Disorders Market Revenue Share (%), by Drug Type 2024 & 2032
- Figure 38: Europe Rare Neurological Disorders Market Volume Share (%), by Drug Type 2024 & 2032
- Figure 39: Europe Rare Neurological Disorders Market Revenue (Million), by Mode of Administration 2024 & 2032
- Figure 40: Europe Rare Neurological Disorders Market Volume (K Unit), by Mode of Administration 2024 & 2032
- Figure 41: Europe Rare Neurological Disorders Market Revenue Share (%), by Mode of Administration 2024 & 2032
- Figure 42: Europe Rare Neurological Disorders Market Volume Share (%), by Mode of Administration 2024 & 2032
- Figure 43: Europe Rare Neurological Disorders Market Revenue (Million), by Country 2024 & 2032
- Figure 44: Europe Rare Neurological Disorders Market Volume (K Unit), by Country 2024 & 2032
- Figure 45: Europe Rare Neurological Disorders Market Revenue Share (%), by Country 2024 & 2032
- Figure 46: Europe Rare Neurological Disorders Market Volume Share (%), by Country 2024 & 2032
- Figure 47: Asia Pacific Rare Neurological Disorders Market Revenue (Million), by Drug Type 2024 & 2032
- Figure 48: Asia Pacific Rare Neurological Disorders Market Volume (K Unit), by Drug Type 2024 & 2032
- Figure 49: Asia Pacific Rare Neurological Disorders Market Revenue Share (%), by Drug Type 2024 & 2032
- Figure 50: Asia Pacific Rare Neurological Disorders Market Volume Share (%), by Drug Type 2024 & 2032
- Figure 51: Asia Pacific Rare Neurological Disorders Market Revenue (Million), by Mode of Administration 2024 & 2032
- Figure 52: Asia Pacific Rare Neurological Disorders Market Volume (K Unit), by Mode of Administration 2024 & 2032
- Figure 53: Asia Pacific Rare Neurological Disorders Market Revenue Share (%), by Mode of Administration 2024 & 2032
- Figure 54: Asia Pacific Rare Neurological Disorders Market Volume Share (%), by Mode of Administration 2024 & 2032
- Figure 55: Asia Pacific Rare Neurological Disorders Market Revenue (Million), by Country 2024 & 2032
- Figure 56: Asia Pacific Rare Neurological Disorders Market Volume (K Unit), by Country 2024 & 2032
- Figure 57: Asia Pacific Rare Neurological Disorders Market Revenue Share (%), by Country 2024 & 2032
- Figure 58: Asia Pacific Rare Neurological Disorders Market Volume Share (%), by Country 2024 & 2032
- Figure 59: Middle East and Africa Rare Neurological Disorders Market Revenue (Million), by Drug Type 2024 & 2032
- Figure 60: Middle East and Africa Rare Neurological Disorders Market Volume (K Unit), by Drug Type 2024 & 2032
- Figure 61: Middle East and Africa Rare Neurological Disorders Market Revenue Share (%), by Drug Type 2024 & 2032
- Figure 62: Middle East and Africa Rare Neurological Disorders Market Volume Share (%), by Drug Type 2024 & 2032
- Figure 63: Middle East and Africa Rare Neurological Disorders Market Revenue (Million), by Mode of Administration 2024 & 2032
- Figure 64: Middle East and Africa Rare Neurological Disorders Market Volume (K Unit), by Mode of Administration 2024 & 2032
- Figure 65: Middle East and Africa Rare Neurological Disorders Market Revenue Share (%), by Mode of Administration 2024 & 2032
- Figure 66: Middle East and Africa Rare Neurological Disorders Market Volume Share (%), by Mode of Administration 2024 & 2032
- Figure 67: Middle East and Africa Rare Neurological Disorders Market Revenue (Million), by Country 2024 & 2032
- Figure 68: Middle East and Africa Rare Neurological Disorders Market Volume (K Unit), by Country 2024 & 2032
- Figure 69: Middle East and Africa Rare Neurological Disorders Market Revenue Share (%), by Country 2024 & 2032
- Figure 70: Middle East and Africa Rare Neurological Disorders Market Volume Share (%), by Country 2024 & 2032
- Figure 71: South America Rare Neurological Disorders Market Revenue (Million), by Drug Type 2024 & 2032
- Figure 72: South America Rare Neurological Disorders Market Volume (K Unit), by Drug Type 2024 & 2032
- Figure 73: South America Rare Neurological Disorders Market Revenue Share (%), by Drug Type 2024 & 2032
- Figure 74: South America Rare Neurological Disorders Market Volume Share (%), by Drug Type 2024 & 2032
- Figure 75: South America Rare Neurological Disorders Market Revenue (Million), by Mode of Administration 2024 & 2032
- Figure 76: South America Rare Neurological Disorders Market Volume (K Unit), by Mode of Administration 2024 & 2032
- Figure 77: South America Rare Neurological Disorders Market Revenue Share (%), by Mode of Administration 2024 & 2032
- Figure 78: South America Rare Neurological Disorders Market Volume Share (%), by Mode of Administration 2024 & 2032
- Figure 79: South America Rare Neurological Disorders Market Revenue (Million), by Country 2024 & 2032
- Figure 80: South America Rare Neurological Disorders Market Volume (K Unit), by Country 2024 & 2032
- Figure 81: South America Rare Neurological Disorders Market Revenue Share (%), by Country 2024 & 2032
- Figure 82: South America Rare Neurological Disorders Market Volume Share (%), by Country 2024 & 2032
List of Tables
- Table 1: Global Rare Neurological Disorders Market Revenue Million Forecast, by Region 2019 & 2032
- Table 2: Global Rare Neurological Disorders Market Volume K Unit Forecast, by Region 2019 & 2032
- Table 3: Global Rare Neurological Disorders Market Revenue Million Forecast, by Drug Type 2019 & 2032
- Table 4: Global Rare Neurological Disorders Market Volume K Unit Forecast, by Drug Type 2019 & 2032
- Table 5: Global Rare Neurological Disorders Market Revenue Million Forecast, by Mode of Administration 2019 & 2032
- Table 6: Global Rare Neurological Disorders Market Volume K Unit Forecast, by Mode of Administration 2019 & 2032
- Table 7: Global Rare Neurological Disorders Market Revenue Million Forecast, by Region 2019 & 2032
- Table 8: Global Rare Neurological Disorders Market Volume K Unit Forecast, by Region 2019 & 2032
- Table 9: Global Rare Neurological Disorders Market Revenue Million Forecast, by Country 2019 & 2032
- Table 10: Global Rare Neurological Disorders Market Volume K Unit Forecast, by Country 2019 & 2032
- Table 11: United States Rare Neurological Disorders Market Revenue (Million) Forecast, by Application 2019 & 2032
- Table 12: United States Rare Neurological Disorders Market Volume (K Unit) Forecast, by Application 2019 & 2032
- Table 13: Canada Rare Neurological Disorders Market Revenue (Million) Forecast, by Application 2019 & 2032
- Table 14: Canada Rare Neurological Disorders Market Volume (K Unit) Forecast, by Application 2019 & 2032
- Table 15: Mexico Rare Neurological Disorders Market Revenue (Million) Forecast, by Application 2019 & 2032
- Table 16: Mexico Rare Neurological Disorders Market Volume (K Unit) Forecast, by Application 2019 & 2032
- Table 17: Global Rare Neurological Disorders Market Revenue Million Forecast, by Country 2019 & 2032
- Table 18: Global Rare Neurological Disorders Market Volume K Unit Forecast, by Country 2019 & 2032
- Table 19: Germany Rare Neurological Disorders Market Revenue (Million) Forecast, by Application 2019 & 2032
- Table 20: Germany Rare Neurological Disorders Market Volume (K Unit) Forecast, by Application 2019 & 2032
- Table 21: United Kingdom Rare Neurological Disorders Market Revenue (Million) Forecast, by Application 2019 & 2032
- Table 22: United Kingdom Rare Neurological Disorders Market Volume (K Unit) Forecast, by Application 2019 & 2032
- Table 23: France Rare Neurological Disorders Market Revenue (Million) Forecast, by Application 2019 & 2032
- Table 24: France Rare Neurological Disorders Market Volume (K Unit) Forecast, by Application 2019 & 2032
- Table 25: Italy Rare Neurological Disorders Market Revenue (Million) Forecast, by Application 2019 & 2032
- Table 26: Italy Rare Neurological Disorders Market Volume (K Unit) Forecast, by Application 2019 & 2032
- Table 27: Spain Rare Neurological Disorders Market Revenue (Million) Forecast, by Application 2019 & 2032
- Table 28: Spain Rare Neurological Disorders Market Volume (K Unit) Forecast, by Application 2019 & 2032
- Table 29: Rest of Europe Rare Neurological Disorders Market Revenue (Million) Forecast, by Application 2019 & 2032
- Table 30: Rest of Europe Rare Neurological Disorders Market Volume (K Unit) Forecast, by Application 2019 & 2032
- Table 31: Global Rare Neurological Disorders Market Revenue Million Forecast, by Country 2019 & 2032
- Table 32: Global Rare Neurological Disorders Market Volume K Unit Forecast, by Country 2019 & 2032
- Table 33: China Rare Neurological Disorders Market Revenue (Million) Forecast, by Application 2019 & 2032
- Table 34: China Rare Neurological Disorders Market Volume (K Unit) Forecast, by Application 2019 & 2032
- Table 35: Japan Rare Neurological Disorders Market Revenue (Million) Forecast, by Application 2019 & 2032
- Table 36: Japan Rare Neurological Disorders Market Volume (K Unit) Forecast, by Application 2019 & 2032
- Table 37: India Rare Neurological Disorders Market Revenue (Million) Forecast, by Application 2019 & 2032
- Table 38: India Rare Neurological Disorders Market Volume (K Unit) Forecast, by Application 2019 & 2032
- Table 39: Australia Rare Neurological Disorders Market Revenue (Million) Forecast, by Application 2019 & 2032
- Table 40: Australia Rare Neurological Disorders Market Volume (K Unit) Forecast, by Application 2019 & 2032
- Table 41: South Korea Rare Neurological Disorders Market Revenue (Million) Forecast, by Application 2019 & 2032
- Table 42: South Korea Rare Neurological Disorders Market Volume (K Unit) Forecast, by Application 2019 & 2032
- Table 43: Rest of Asia Pacific Rare Neurological Disorders Market Revenue (Million) Forecast, by Application 2019 & 2032
- Table 44: Rest of Asia Pacific Rare Neurological Disorders Market Volume (K Unit) Forecast, by Application 2019 & 2032
- Table 45: Global Rare Neurological Disorders Market Revenue Million Forecast, by Country 2019 & 2032
- Table 46: Global Rare Neurological Disorders Market Volume K Unit Forecast, by Country 2019 & 2032
- Table 47: GCC Rare Neurological Disorders Market Revenue (Million) Forecast, by Application 2019 & 2032
- Table 48: GCC Rare Neurological Disorders Market Volume (K Unit) Forecast, by Application 2019 & 2032
- Table 49: South Africa Rare Neurological Disorders Market Revenue (Million) Forecast, by Application 2019 & 2032
- Table 50: South Africa Rare Neurological Disorders Market Volume (K Unit) Forecast, by Application 2019 & 2032
- Table 51: Rest of Middle East and Africa Rare Neurological Disorders Market Revenue (Million) Forecast, by Application 2019 & 2032
- Table 52: Rest of Middle East and Africa Rare Neurological Disorders Market Volume (K Unit) Forecast, by Application 2019 & 2032
- Table 53: Global Rare Neurological Disorders Market Revenue Million Forecast, by Country 2019 & 2032
- Table 54: Global Rare Neurological Disorders Market Volume K Unit Forecast, by Country 2019 & 2032
- Table 55: Brazil Rare Neurological Disorders Market Revenue (Million) Forecast, by Application 2019 & 2032
- Table 56: Brazil Rare Neurological Disorders Market Volume (K Unit) Forecast, by Application 2019 & 2032
- Table 57: Argentina Rare Neurological Disorders Market Revenue (Million) Forecast, by Application 2019 & 2032
- Table 58: Argentina Rare Neurological Disorders Market Volume (K Unit) Forecast, by Application 2019 & 2032
- Table 59: Rest of South America Rare Neurological Disorders Market Revenue (Million) Forecast, by Application 2019 & 2032
- Table 60: Rest of South America Rare Neurological Disorders Market Volume (K Unit) Forecast, by Application 2019 & 2032
- Table 61: Global Rare Neurological Disorders Market Revenue Million Forecast, by Drug Type 2019 & 2032
- Table 62: Global Rare Neurological Disorders Market Volume K Unit Forecast, by Drug Type 2019 & 2032
- Table 63: Global Rare Neurological Disorders Market Revenue Million Forecast, by Mode of Administration 2019 & 2032
- Table 64: Global Rare Neurological Disorders Market Volume K Unit Forecast, by Mode of Administration 2019 & 2032
- Table 65: Global Rare Neurological Disorders Market Revenue Million Forecast, by Country 2019 & 2032
- Table 66: Global Rare Neurological Disorders Market Volume K Unit Forecast, by Country 2019 & 2032
- Table 67: United States Rare Neurological Disorders Market Revenue (Million) Forecast, by Application 2019 & 2032
- Table 68: United States Rare Neurological Disorders Market Volume (K Unit) Forecast, by Application 2019 & 2032
- Table 69: Canada Rare Neurological Disorders Market Revenue (Million) Forecast, by Application 2019 & 2032
- Table 70: Canada Rare Neurological Disorders Market Volume (K Unit) Forecast, by Application 2019 & 2032
- Table 71: Mexico Rare Neurological Disorders Market Revenue (Million) Forecast, by Application 2019 & 2032
- Table 72: Mexico Rare Neurological Disorders Market Volume (K Unit) Forecast, by Application 2019 & 2032
- Table 73: Global Rare Neurological Disorders Market Revenue Million Forecast, by Drug Type 2019 & 2032
- Table 74: Global Rare Neurological Disorders Market Volume K Unit Forecast, by Drug Type 2019 & 2032
- Table 75: Global Rare Neurological Disorders Market Revenue Million Forecast, by Mode of Administration 2019 & 2032
- Table 76: Global Rare Neurological Disorders Market Volume K Unit Forecast, by Mode of Administration 2019 & 2032
- Table 77: Global Rare Neurological Disorders Market Revenue Million Forecast, by Country 2019 & 2032
- Table 78: Global Rare Neurological Disorders Market Volume K Unit Forecast, by Country 2019 & 2032
- Table 79: Germany Rare Neurological Disorders Market Revenue (Million) Forecast, by Application 2019 & 2032
- Table 80: Germany Rare Neurological Disorders Market Volume (K Unit) Forecast, by Application 2019 & 2032
- Table 81: United Kingdom Rare Neurological Disorders Market Revenue (Million) Forecast, by Application 2019 & 2032
- Table 82: United Kingdom Rare Neurological Disorders Market Volume (K Unit) Forecast, by Application 2019 & 2032
- Table 83: France Rare Neurological Disorders Market Revenue (Million) Forecast, by Application 2019 & 2032
- Table 84: France Rare Neurological Disorders Market Volume (K Unit) Forecast, by Application 2019 & 2032
- Table 85: Italy Rare Neurological Disorders Market Revenue (Million) Forecast, by Application 2019 & 2032
- Table 86: Italy Rare Neurological Disorders Market Volume (K Unit) Forecast, by Application 2019 & 2032
- Table 87: Spain Rare Neurological Disorders Market Revenue (Million) Forecast, by Application 2019 & 2032
- Table 88: Spain Rare Neurological Disorders Market Volume (K Unit) Forecast, by Application 2019 & 2032
- Table 89: Rest of Europe Rare Neurological Disorders Market Revenue (Million) Forecast, by Application 2019 & 2032
- Table 90: Rest of Europe Rare Neurological Disorders Market Volume (K Unit) Forecast, by Application 2019 & 2032
- Table 91: Global Rare Neurological Disorders Market Revenue Million Forecast, by Drug Type 2019 & 2032
- Table 92: Global Rare Neurological Disorders Market Volume K Unit Forecast, by Drug Type 2019 & 2032
- Table 93: Global Rare Neurological Disorders Market Revenue Million Forecast, by Mode of Administration 2019 & 2032
- Table 94: Global Rare Neurological Disorders Market Volume K Unit Forecast, by Mode of Administration 2019 & 2032
- Table 95: Global Rare Neurological Disorders Market Revenue Million Forecast, by Country 2019 & 2032
- Table 96: Global Rare Neurological Disorders Market Volume K Unit Forecast, by Country 2019 & 2032
- Table 97: China Rare Neurological Disorders Market Revenue (Million) Forecast, by Application 2019 & 2032
- Table 98: China Rare Neurological Disorders Market Volume (K Unit) Forecast, by Application 2019 & 2032
- Table 99: Japan Rare Neurological Disorders Market Revenue (Million) Forecast, by Application 2019 & 2032
- Table 100: Japan Rare Neurological Disorders Market Volume (K Unit) Forecast, by Application 2019 & 2032
- Table 101: India Rare Neurological Disorders Market Revenue (Million) Forecast, by Application 2019 & 2032
- Table 102: India Rare Neurological Disorders Market Volume (K Unit) Forecast, by Application 2019 & 2032
- Table 103: Australia Rare Neurological Disorders Market Revenue (Million) Forecast, by Application 2019 & 2032
- Table 104: Australia Rare Neurological Disorders Market Volume (K Unit) Forecast, by Application 2019 & 2032
- Table 105: South Korea Rare Neurological Disorders Market Revenue (Million) Forecast, by Application 2019 & 2032
- Table 106: South Korea Rare Neurological Disorders Market Volume (K Unit) Forecast, by Application 2019 & 2032
- Table 107: Rest of Asia Pacific Rare Neurological Disorders Market Revenue (Million) Forecast, by Application 2019 & 2032
- Table 108: Rest of Asia Pacific Rare Neurological Disorders Market Volume (K Unit) Forecast, by Application 2019 & 2032
- Table 109: Global Rare Neurological Disorders Market Revenue Million Forecast, by Drug Type 2019 & 2032
- Table 110: Global Rare Neurological Disorders Market Volume K Unit Forecast, by Drug Type 2019 & 2032
- Table 111: Global Rare Neurological Disorders Market Revenue Million Forecast, by Mode of Administration 2019 & 2032
- Table 112: Global Rare Neurological Disorders Market Volume K Unit Forecast, by Mode of Administration 2019 & 2032
- Table 113: Global Rare Neurological Disorders Market Revenue Million Forecast, by Country 2019 & 2032
- Table 114: Global Rare Neurological Disorders Market Volume K Unit Forecast, by Country 2019 & 2032
- Table 115: GCC Rare Neurological Disorders Market Revenue (Million) Forecast, by Application 2019 & 2032
- Table 116: GCC Rare Neurological Disorders Market Volume (K Unit) Forecast, by Application 2019 & 2032
- Table 117: South Africa Rare Neurological Disorders Market Revenue (Million) Forecast, by Application 2019 & 2032
- Table 118: South Africa Rare Neurological Disorders Market Volume (K Unit) Forecast, by Application 2019 & 2032
- Table 119: Rest of Middle East and Africa Rare Neurological Disorders Market Revenue (Million) Forecast, by Application 2019 & 2032
- Table 120: Rest of Middle East and Africa Rare Neurological Disorders Market Volume (K Unit) Forecast, by Application 2019 & 2032
- Table 121: Global Rare Neurological Disorders Market Revenue Million Forecast, by Drug Type 2019 & 2032
- Table 122: Global Rare Neurological Disorders Market Volume K Unit Forecast, by Drug Type 2019 & 2032
- Table 123: Global Rare Neurological Disorders Market Revenue Million Forecast, by Mode of Administration 2019 & 2032
- Table 124: Global Rare Neurological Disorders Market Volume K Unit Forecast, by Mode of Administration 2019 & 2032
- Table 125: Global Rare Neurological Disorders Market Revenue Million Forecast, by Country 2019 & 2032
- Table 126: Global Rare Neurological Disorders Market Volume K Unit Forecast, by Country 2019 & 2032
- Table 127: Brazil Rare Neurological Disorders Market Revenue (Million) Forecast, by Application 2019 & 2032
- Table 128: Brazil Rare Neurological Disorders Market Volume (K Unit) Forecast, by Application 2019 & 2032
- Table 129: Argentina Rare Neurological Disorders Market Revenue (Million) Forecast, by Application 2019 & 2032
- Table 130: Argentina Rare Neurological Disorders Market Volume (K Unit) Forecast, by Application 2019 & 2032
- Table 131: Rest of South America Rare Neurological Disorders Market Revenue (Million) Forecast, by Application 2019 & 2032
- Table 132: Rest of South America Rare Neurological Disorders Market Volume (K Unit) Forecast, by Application 2019 & 2032
Frequently Asked Questions
1. What is the projected Compound Annual Growth Rate (CAGR) of the Rare Neurological Disorders Market?
The projected CAGR is approximately 8.60%.
2. Which companies are prominent players in the Rare Neurological Disorders Market?
Key companies in the market include Kedrion Biopharma Inc, CSL Ltd, Bayer AG, Novartis AG, Aquestive Therapeutics Inc, US WorldMeds LLC (Solstice Neurosciences LLC), Merz Pharma GmbH & Co KGaA, Teva Pharmaceutical Industries Ltd, Merck & Co Inc (EMD Serono Inc ), Biogen Inc, F Hoffmann - La Roche Ltd, Pfizer Inc.
3. What are the main segments of the Rare Neurological Disorders Market?
The market segments include Drug Type, Mode of Administration.
4. Can you provide details about the market size?
The market size is estimated to be USD XX Million as of 2022.
5. What are some drivers contributing to market growth?
Increasing Prevalence of Rare Neurological Diseases; Promising Pipeline Drugs for Treatment of Rare Neurological Diseases; Favorable Government Policies Worldwide for Speeding up Diagnostic Processes.
6. What are the notable trends driving market growth?
The Small Molecules Segment is Expected to Hold a Major Share in the Rare Neurological Disease Treatment Market.
7. Are there any restraints impacting market growth?
High Cost of Rare Neurological Disease Treatment.
8. Can you provide examples of recent developments in the market?
September 2021: NeuExcell Therapeutics and Spark Therapeutics entered a gene therapy collaboration to develop a safe and effective treatment for patients with Huntington's Disease (HD).
9. What pricing options are available for accessing the report?
Pricing options include single-user, multi-user, and enterprise licenses priced at USD 4750, USD 5250, and USD 8750 respectively.
10. Is the market size provided in terms of value or volume?
The market size is provided in terms of value, measured in Million and volume, measured in K Unit.
11. Are there any specific market keywords associated with the report?
Yes, the market keyword associated with the report is "Rare Neurological Disorders Market," which aids in identifying and referencing the specific market segment covered.
12. How do I determine which pricing option suits my needs best?
The pricing options vary based on user requirements and access needs. Individual users may opt for single-user licenses, while businesses requiring broader access may choose multi-user or enterprise licenses for cost-effective access to the report.
13. Are there any additional resources or data provided in the Rare Neurological Disorders Market report?
While the report offers comprehensive insights, it's advisable to review the specific contents or supplementary materials provided to ascertain if additional resources or data are available.
14. How can I stay updated on further developments or reports in the Rare Neurological Disorders Market?
To stay informed about further developments, trends, and reports in the Rare Neurological Disorders Market, consider subscribing to industry newsletters, following relevant companies and organizations, or regularly checking reputable industry news sources and publications.
Methodology
Step 1 - Identification of Relevant Samples Size from Population Database


Step 2 - Approaches for Defining Global Market Size (Value, Volume* & Price*)

Note*: In applicable scenarios
Step 3 - Data Sources
Primary Research
- Web Analytics
- Survey Reports
- Research Institute
- Latest Research Reports
- Opinion Leaders
Secondary Research
- Annual Reports
- White Paper
- Latest Press Release
- Industry Association
- Paid Database
- Investor Presentations

Step 4 - Data Triangulation
Involves using different sources of information in order to increase the validity of a study
These sources are likely to be stakeholders in a program - participants, other researchers, program staff, other community members, and so on.
Then we put all data in single framework & apply various statistical tools to find out the dynamic on the market.
During the analysis stage, feedback from the stakeholder groups would be compared to determine areas of agreement as well as areas of divergence
