

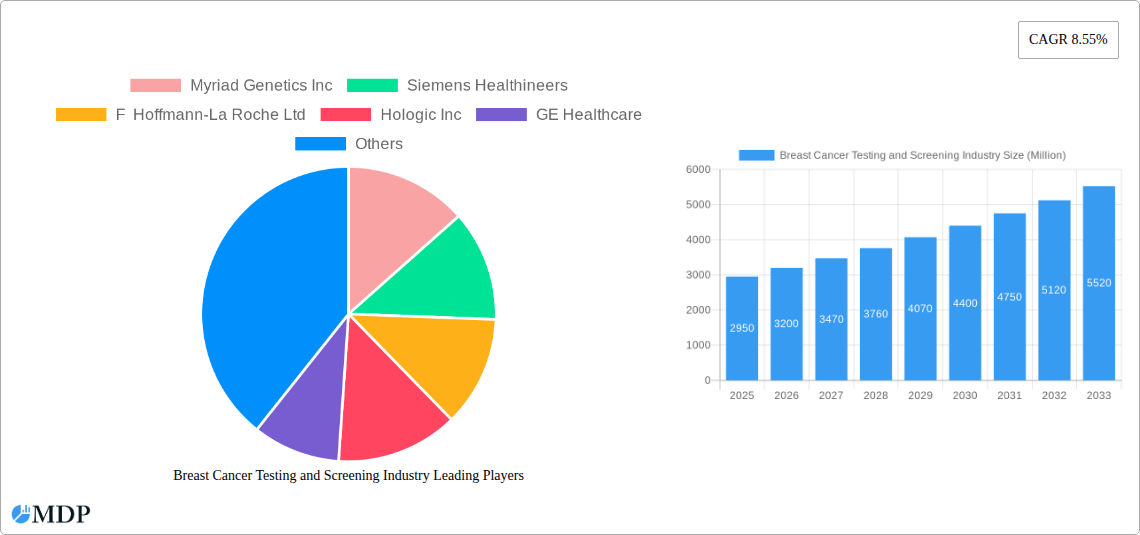
Key Insights
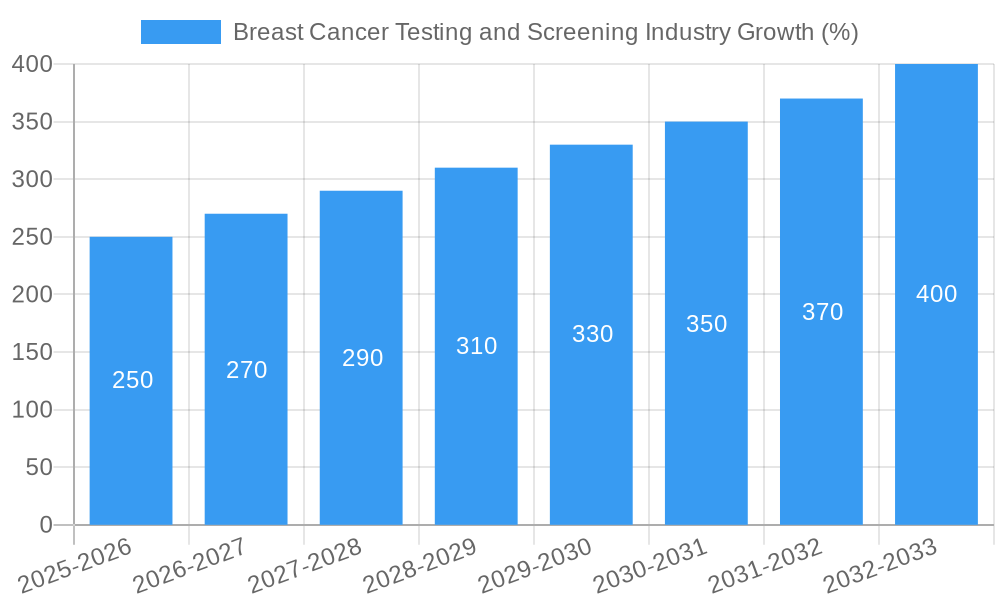
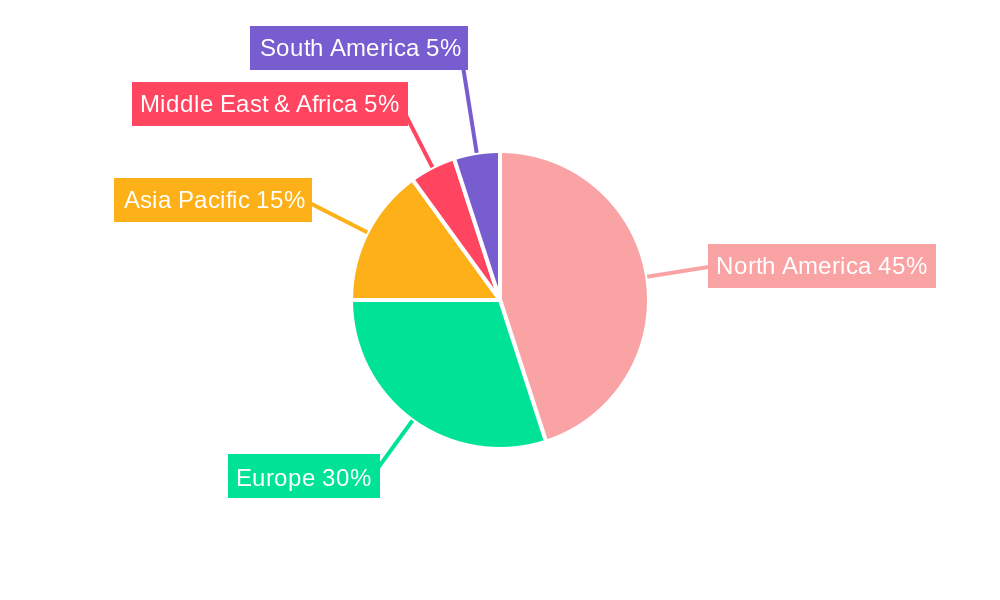
The global breast cancer testing and screening market, valued at $2.95 billion in 2025, is projected to experience robust growth, driven by increasing breast cancer incidence, advancements in diagnostic technologies, and rising awareness about early detection. The Compound Annual Growth Rate (CAGR) of 8.55% from 2025 to 2033 indicates a significant expansion of this market over the forecast period. Key growth drivers include the adoption of advanced genomic tests offering personalized risk assessment and treatment strategies, the increasing utilization of sophisticated imaging technologies like mammography, MRI, and ultrasound for early detection, and growing government initiatives promoting breast cancer screening programs. The market segmentation reveals a significant contribution from both genomic tests, providing detailed genetic information for risk stratification, and imaging tests, offering visual assessment of breast tissue. Leading companies such as Myriad Genetics, Siemens Healthineers, Roche, and Hologic are actively driving innovation, expanding their product portfolios, and strategically investing in research and development to maintain their market positions. Geographic analysis shows substantial market shares for North America and Europe, reflecting higher healthcare expenditure and technological advancements in these regions. However, the Asia-Pacific region is expected to demonstrate significant growth potential due to rising healthcare awareness, increasing disposable incomes, and expanding healthcare infrastructure. The market's growth is expected to be somewhat restrained by high costs associated with advanced testing and screening procedures, particularly in low- and middle-income countries, and by concerns regarding the potential for overdiagnosis and overtreatment. Nevertheless, the overall outlook for the breast cancer testing and screening market remains exceptionally positive, fueled by the persistent need for early detection and effective management of this prevalent disease.
The continued advancements in diagnostic technologies, including liquid biopsies and artificial intelligence-powered image analysis, are further bolstering the market's growth trajectory. Moreover, the ongoing development of targeted therapies tailored to specific genetic profiles is expected to increase the demand for comprehensive genomic testing. Competition among market players is intensifying, leading to ongoing innovation and the development of cost-effective solutions. The increasing integration of telehealth and remote diagnostics will also play a significant role in expanding access to breast cancer testing and screening, particularly in underserved populations. Furthermore, the rising focus on personalized medicine and the growing adoption of preventive healthcare measures are expected to further enhance market growth. However, challenges such as regulatory hurdles, reimbursement issues, and the need for standardized guidelines across different regions remain significant considerations for market players.
Breast Cancer Testing and Screening Industry: A Comprehensive Market Report (2019-2033)
This in-depth report provides a comprehensive analysis of the global Breast Cancer Testing and Screening market, projecting a market value of $XX Million by 2033. The study covers the period from 2019 to 2033, with 2025 serving as the base and estimated year. This report is crucial for stakeholders, investors, and industry professionals seeking actionable insights into this rapidly evolving sector.
Breast Cancer Testing and Screening Industry Market Dynamics & Concentration
The global breast cancer testing and screening market exhibits a moderately concentrated landscape, with several key players holding significant market share. Myriad Genetics Inc, Siemens Healthineers, F Hoffmann-La Roche Ltd, Hologic Inc, GE Healthcare, Koninklijke Philips N.V., Carestream Health, Quest Diagnostics Incorporated, NanoString Technologies Inc, and Fujifilm Holdings Corporation are among the leading companies shaping the industry. The market share of these players fluctuates based on technological advancements, regulatory approvals, and strategic acquisitions. Innovation is a key driver, with companies continuously developing more sensitive and specific tests, such as genomic tests and advanced imaging technologies. Stringent regulatory frameworks, including those set by the FDA and other global bodies, significantly influence market dynamics. The presence of substitute technologies (e.g., alternative screening methods) and evolving end-user preferences (e.g., increasing adoption of minimally invasive procedures) also impact market growth. Mergers and acquisitions (M&A) activity, while not exceptionally high, plays a significant role in shaping the competitive landscape, with an estimated xx M&A deals annually in the period 2019-2024. The average market share of the top 5 companies is estimated to be around xx%.
Breast Cancer Testing and Screening Industry Industry Trends & Analysis
The breast cancer testing and screening market is experiencing robust growth, projected to reach a Compound Annual Growth Rate (CAGR) of xx% during the forecast period (2025-2033). This growth is fueled by several factors, including the rising prevalence of breast cancer globally, increased awareness about early detection and prevention, technological advancements leading to more accurate and less invasive testing methods, and favorable reimbursement policies in many countries. Technological disruptions, particularly in genomic testing and AI-powered image analysis, are transforming the industry, enhancing diagnostic accuracy and efficiency. Consumer preferences are shifting towards personalized medicine approaches, driving demand for tailored risk assessment and treatment strategies. The competitive landscape is highly dynamic, with companies vying for market share through product innovation, strategic partnerships, and expansion into new markets. Market penetration of genomic tests is estimated at xx% in 2025, while the penetration of imaging tests is projected at xx%.
Leading Markets & Segments in Breast Cancer Testing and Screening Industry
The North American market currently holds the dominant position in the global breast cancer testing and screening industry, driven by factors such as high healthcare expenditure, advanced healthcare infrastructure, and a robust regulatory framework. Within the "By Test" segmentation:
- Genomic Tests: The high growth in this segment is fueled by the increasing understanding of the genetic basis of breast cancer and the development of sophisticated tests that can assess individual risk profiles. Technological advancements in next-generation sequencing are further enhancing the accuracy and affordability of these tests.
- Imaging Tests: This segment continues to dominate, with mammograms remaining the gold standard for breast cancer screening. However, newer imaging techniques, like tomosynthesis and MRI, are gaining traction due to improved detection rates and reduced false positives.
Key Drivers for North American Dominance:
- Advanced healthcare infrastructure and technological capabilities.
- High healthcare spending and insurance coverage.
- Stringent regulatory frameworks that ensure high quality and safety standards.
- High level of awareness and early detection programs.
Breast Cancer Testing and Screening Industry Product Developments
Recent product innovations emphasize improved accuracy, reduced invasiveness, and personalized medicine approaches. Advancements in genomic testing allow for more precise risk assessment, facilitating tailored screening and prevention strategies. New imaging technologies, including AI-powered image analysis, enhance the detection of subtle abnormalities, leading to earlier diagnosis and improved patient outcomes. These developments contribute to better patient care and a more efficient healthcare system, driving market growth. The focus is on integrating these advanced technologies into user-friendly platforms, ensuring wider accessibility and adoption.
Key Drivers of Breast Cancer Testing and Screening Industry Growth
Several factors contribute to the sustained growth of the breast cancer testing and screening industry. Technological advancements, leading to more accurate and efficient diagnostic tools, are at the forefront. Rising breast cancer prevalence necessitates increased screening efforts. Favorable reimbursement policies from governments and insurance providers increase accessibility. Furthermore, growing awareness about breast cancer and the benefits of early detection among the population drives market growth. Government initiatives promoting preventive healthcare and early detection programs further stimulate market expansion.
Challenges in the Breast Cancer Testing and Screening Industry Market
The industry faces challenges, including high costs associated with advanced testing technologies and their potential to create access disparities. Regulatory hurdles and lengthy approval processes can delay product launches. Supply chain disruptions, especially in the procurement of specialized reagents and equipment, can affect market stability. Furthermore, intense competition among established players and emerging companies creates pricing pressures and impacts profitability. The average cost of genomic testing is approximately $XX Million, and imaging tests contribute to a significant portion of overall healthcare expenditures.
Emerging Opportunities in Breast Cancer Testing and Screening Industry
Long-term growth is fueled by technological advancements like liquid biopsies and advanced imaging techniques. Strategic partnerships between diagnostic companies and healthcare providers are expanding market reach. Expansion into emerging economies with rising healthcare spending presents significant growth potential. Personalized medicine approaches that integrate genomic testing with imaging techniques will further drive market expansion. The development of AI-powered diagnostic tools has potential to revolutionize breast cancer detection, improving accuracy and efficiency.
Leading Players in the Breast Cancer Testing and Screening Industry Sector
- Myriad Genetics Inc
- Siemens Healthineers
- F Hoffmann-La Roche Ltd
- Hologic Inc
- GE Healthcare
- Koninklijke Philips N.V.
- Carestream Health
- Quest Diagnostics Incorporated
- NanoString Technologies Inc
- Fujifilm Holdings Corporation
Key Milestones in Breast Cancer Testing and Screening Industry Industry
- June 2022: Biomerica, Inc. partnered with Walmart to distribute the Aware Breast Self Exam device, enhancing accessibility to self-examination tools.
- March 2022: LifeCell launched the Breast Screen Panel, a comprehensive genetic screening test for assessing breast cancer risk. This expands the options available for risk assessment and early detection.
Strategic Outlook for Breast Cancer Testing and Screening Industry Market
The future of the breast cancer testing and screening market is promising, driven by technological innovation, increasing awareness, and rising healthcare spending globally. Strategic partnerships, expansion into emerging markets, and the development of personalized medicine approaches will be key drivers of growth. Companies that invest in research and development, adopt advanced technologies, and build strong distribution networks will be best positioned to capitalize on the market's long-term potential. The focus on early detection and preventive measures will continue to be a central theme, ensuring market expansion in the coming years.
Breast Cancer Testing and Screening Industry Segmentation
-
1. Test
-
1.1. Genomic Tests
- 1.1.1. DNA sequencing and testing
- 1.1.2. Gene expression profiling
-
1.2. Imaging Test
- 1.2.1. Mammograms
- 1.2.2. Ultrasound
- 1.2.3. MRI
- 1.2.4. Tomography
- 1.2.5. Other Imaging Tests
-
1.1. Genomic Tests
Breast Cancer Testing and Screening Industry Segmentation By Geography
-
1. North America
- 1.1. United States
- 1.2. Canada
- 1.3. Mexico
-
2. Europe
- 2.1. Germany
- 2.2. United Kindgom
- 2.3. France
- 2.4. Italy
- 2.5. Spain
- 2.6. Rest of Europe
-
3. Asia Pacific
- 3.1. China
- 3.2. Japan
- 3.3. India
- 3.4. Australia
- 3.5. South Korea
- 3.6. Rest of Asia Pacific
- 4. Middle East
-
5. GCC
- 5.1. South Africa
- 5.2. Rest of Middle East
-
6. South America
- 6.1. Brazil
- 6.2. Argentina
- 6.3. Rest of South America
Breast Cancer Testing and Screening Industry REPORT HIGHLIGHTS
| Aspects | Details |
|---|---|
| Study Period | 2019-2033 |
| Base Year | 2024 |
| Estimated Year | 2025 |
| Forecast Period | 2025-2033 |
| Historical Period | 2019-2024 |
| Growth Rate | CAGR of 8.55% from 2019-2033 |
| Segmentation |
|
Table of Contents
- 1. Introduction
- 1.1. Research Scope
- 1.2. Market Segmentation
- 1.3. Research Methodology
- 1.4. Definitions and Assumptions
- 2. Executive Summary
- 2.1. Introduction
- 3. Market Dynamics
- 3.1. Introduction
- 3.2. Market Drivers
- 3.2.1. Increasing Awareness about Early Detection of Breast Cancer; Growing Incidence of Breast Cancer; Increasing Government Initiatives and Support
- 3.3. Market Restrains
- 3.3.1. Controversies Related to Mammography; High Cost of Screening Tests in the Developing Countries
- 3.4. Market Trends
- 3.4.1. Mammograms segment is Expected to Dominate in the Breast Cancer Screening Test Market
- 4. Market Factor Analysis
- 4.1. Porters Five Forces
- 4.2. Supply/Value Chain
- 4.3. PESTEL analysis
- 4.4. Market Entropy
- 4.5. Patent/Trademark Analysis
- 5. Global Breast Cancer Testing and Screening Industry Analysis, Insights and Forecast, 2019-2031
- 5.1. Market Analysis, Insights and Forecast - by Test
- 5.1.1. Genomic Tests
- 5.1.1.1. DNA sequencing and testing
- 5.1.1.2. Gene expression profiling
- 5.1.2. Imaging Test
- 5.1.2.1. Mammograms
- 5.1.2.2. Ultrasound
- 5.1.2.3. MRI
- 5.1.2.4. Tomography
- 5.1.2.5. Other Imaging Tests
- 5.1.1. Genomic Tests
- 5.2. Market Analysis, Insights and Forecast - by Region
- 5.2.1. North America
- 5.2.2. Europe
- 5.2.3. Asia Pacific
- 5.2.4. Middle East
- 5.2.5. GCC
- 5.2.6. South America
- 5.1. Market Analysis, Insights and Forecast - by Test
- 6. North America Breast Cancer Testing and Screening Industry Analysis, Insights and Forecast, 2019-2031
- 6.1. Market Analysis, Insights and Forecast - by Test
- 6.1.1. Genomic Tests
- 6.1.1.1. DNA sequencing and testing
- 6.1.1.2. Gene expression profiling
- 6.1.2. Imaging Test
- 6.1.2.1. Mammograms
- 6.1.2.2. Ultrasound
- 6.1.2.3. MRI
- 6.1.2.4. Tomography
- 6.1.2.5. Other Imaging Tests
- 6.1.1. Genomic Tests
- 6.1. Market Analysis, Insights and Forecast - by Test
- 7. Europe Breast Cancer Testing and Screening Industry Analysis, Insights and Forecast, 2019-2031
- 7.1. Market Analysis, Insights and Forecast - by Test
- 7.1.1. Genomic Tests
- 7.1.1.1. DNA sequencing and testing
- 7.1.1.2. Gene expression profiling
- 7.1.2. Imaging Test
- 7.1.2.1. Mammograms
- 7.1.2.2. Ultrasound
- 7.1.2.3. MRI
- 7.1.2.4. Tomography
- 7.1.2.5. Other Imaging Tests
- 7.1.1. Genomic Tests
- 7.1. Market Analysis, Insights and Forecast - by Test
- 8. Asia Pacific Breast Cancer Testing and Screening Industry Analysis, Insights and Forecast, 2019-2031
- 8.1. Market Analysis, Insights and Forecast - by Test
- 8.1.1. Genomic Tests
- 8.1.1.1. DNA sequencing and testing
- 8.1.1.2. Gene expression profiling
- 8.1.2. Imaging Test
- 8.1.2.1. Mammograms
- 8.1.2.2. Ultrasound
- 8.1.2.3. MRI
- 8.1.2.4. Tomography
- 8.1.2.5. Other Imaging Tests
- 8.1.1. Genomic Tests
- 8.1. Market Analysis, Insights and Forecast - by Test
- 9. Middle East Breast Cancer Testing and Screening Industry Analysis, Insights and Forecast, 2019-2031
- 9.1. Market Analysis, Insights and Forecast - by Test
- 9.1.1. Genomic Tests
- 9.1.1.1. DNA sequencing and testing
- 9.1.1.2. Gene expression profiling
- 9.1.2. Imaging Test
- 9.1.2.1. Mammograms
- 9.1.2.2. Ultrasound
- 9.1.2.3. MRI
- 9.1.2.4. Tomography
- 9.1.2.5. Other Imaging Tests
- 9.1.1. Genomic Tests
- 9.1. Market Analysis, Insights and Forecast - by Test
- 10. GCC Breast Cancer Testing and Screening Industry Analysis, Insights and Forecast, 2019-2031
- 10.1. Market Analysis, Insights and Forecast - by Test
- 10.1.1. Genomic Tests
- 10.1.1.1. DNA sequencing and testing
- 10.1.1.2. Gene expression profiling
- 10.1.2. Imaging Test
- 10.1.2.1. Mammograms
- 10.1.2.2. Ultrasound
- 10.1.2.3. MRI
- 10.1.2.4. Tomography
- 10.1.2.5. Other Imaging Tests
- 10.1.1. Genomic Tests
- 10.1. Market Analysis, Insights and Forecast - by Test
- 11. South America Breast Cancer Testing and Screening Industry Analysis, Insights and Forecast, 2019-2031
- 11.1. Market Analysis, Insights and Forecast - by Test
- 11.1.1. Genomic Tests
- 11.1.1.1. DNA sequencing and testing
- 11.1.1.2. Gene expression profiling
- 11.1.2. Imaging Test
- 11.1.2.1. Mammograms
- 11.1.2.2. Ultrasound
- 11.1.2.3. MRI
- 11.1.2.4. Tomography
- 11.1.2.5. Other Imaging Tests
- 11.1.1. Genomic Tests
- 11.1. Market Analysis, Insights and Forecast - by Test
- 12. North America Breast Cancer Testing and Screening Industry Analysis, Insights and Forecast, 2019-2031
- 12.1. Market Analysis, Insights and Forecast - By Country/Sub-region
- 12.1.1 United States
- 12.1.2 Canada
- 12.1.3 Mexico
- 13. Europe Breast Cancer Testing and Screening Industry Analysis, Insights and Forecast, 2019-2031
- 13.1. Market Analysis, Insights and Forecast - By Country/Sub-region
- 13.1.1 Germany
- 13.1.2 United Kindgom
- 13.1.3 France
- 13.1.4 Italy
- 13.1.5 Spain
- 13.1.6 Rest of Europe
- 14. Asia Pacific Breast Cancer Testing and Screening Industry Analysis, Insights and Forecast, 2019-2031
- 14.1. Market Analysis, Insights and Forecast - By Country/Sub-region
- 14.1.1 China
- 14.1.2 Japan
- 14.1.3 India
- 14.1.4 Australia
- 14.1.5 South Korea
- 14.1.6 Rest of Asia Pacific
- 15. Middle East Breast Cancer Testing and Screening Industry Analysis, Insights and Forecast, 2019-2031
- 15.1. Market Analysis, Insights and Forecast - By Country/Sub-region
- 15.1.1.
- 16. GCC Breast Cancer Testing and Screening Industry Analysis, Insights and Forecast, 2019-2031
- 16.1. Market Analysis, Insights and Forecast - By Country/Sub-region
- 16.1.1 South Africa
- 16.1.2 Rest of Middle East
- 17. South America Breast Cancer Testing and Screening Industry Analysis, Insights and Forecast, 2019-2031
- 17.1. Market Analysis, Insights and Forecast - By Country/Sub-region
- 17.1.1 Brazil
- 17.1.2 Argentina
- 17.1.3 Rest of South America
- 18. Competitive Analysis
- 18.1. Global Market Share Analysis 2024
- 18.2. Company Profiles
- 18.2.1 Myriad Genetics Inc
- 18.2.1.1. Overview
- 18.2.1.2. Products
- 18.2.1.3. SWOT Analysis
- 18.2.1.4. Recent Developments
- 18.2.1.5. Financials (Based on Availability)
- 18.2.2 Siemens Healthineers
- 18.2.2.1. Overview
- 18.2.2.2. Products
- 18.2.2.3. SWOT Analysis
- 18.2.2.4. Recent Developments
- 18.2.2.5. Financials (Based on Availability)
- 18.2.3 F Hoffmann-La Roche Ltd
- 18.2.3.1. Overview
- 18.2.3.2. Products
- 18.2.3.3. SWOT Analysis
- 18.2.3.4. Recent Developments
- 18.2.3.5. Financials (Based on Availability)
- 18.2.4 Hologic Inc
- 18.2.4.1. Overview
- 18.2.4.2. Products
- 18.2.4.3. SWOT Analysis
- 18.2.4.4. Recent Developments
- 18.2.4.5. Financials (Based on Availability)
- 18.2.5 GE Healthcare
- 18.2.5.1. Overview
- 18.2.5.2. Products
- 18.2.5.3. SWOT Analysis
- 18.2.5.4. Recent Developments
- 18.2.5.5. Financials (Based on Availability)
- 18.2.6 Koninklijke Philips N V
- 18.2.6.1. Overview
- 18.2.6.2. Products
- 18.2.6.3. SWOT Analysis
- 18.2.6.4. Recent Developments
- 18.2.6.5. Financials (Based on Availability)
- 18.2.7 Carestream Health
- 18.2.7.1. Overview
- 18.2.7.2. Products
- 18.2.7.3. SWOT Analysis
- 18.2.7.4. Recent Developments
- 18.2.7.5. Financials (Based on Availability)
- 18.2.8 Quest Diagnostics Incorporated*List Not Exhaustive
- 18.2.8.1. Overview
- 18.2.8.2. Products
- 18.2.8.3. SWOT Analysis
- 18.2.8.4. Recent Developments
- 18.2.8.5. Financials (Based on Availability)
- 18.2.9 NanoString Technologies Inc
- 18.2.9.1. Overview
- 18.2.9.2. Products
- 18.2.9.3. SWOT Analysis
- 18.2.9.4. Recent Developments
- 18.2.9.5. Financials (Based on Availability)
- 18.2.10 Fujifilm Holdings Corporation
- 18.2.10.1. Overview
- 18.2.10.2. Products
- 18.2.10.3. SWOT Analysis
- 18.2.10.4. Recent Developments
- 18.2.10.5. Financials (Based on Availability)
- 18.2.1 Myriad Genetics Inc
List of Figures
- Figure 1: Global Breast Cancer Testing and Screening Industry Revenue Breakdown (Million, %) by Region 2024 & 2032
- Figure 2: Global Breast Cancer Testing and Screening Industry Volume Breakdown (K Unit, %) by Region 2024 & 2032
- Figure 3: North America Breast Cancer Testing and Screening Industry Revenue (Million), by Country 2024 & 2032
- Figure 4: North America Breast Cancer Testing and Screening Industry Volume (K Unit), by Country 2024 & 2032
- Figure 5: North America Breast Cancer Testing and Screening Industry Revenue Share (%), by Country 2024 & 2032
- Figure 6: North America Breast Cancer Testing and Screening Industry Volume Share (%), by Country 2024 & 2032
- Figure 7: Europe Breast Cancer Testing and Screening Industry Revenue (Million), by Country 2024 & 2032
- Figure 8: Europe Breast Cancer Testing and Screening Industry Volume (K Unit), by Country 2024 & 2032
- Figure 9: Europe Breast Cancer Testing and Screening Industry Revenue Share (%), by Country 2024 & 2032
- Figure 10: Europe Breast Cancer Testing and Screening Industry Volume Share (%), by Country 2024 & 2032
- Figure 11: Asia Pacific Breast Cancer Testing and Screening Industry Revenue (Million), by Country 2024 & 2032
- Figure 12: Asia Pacific Breast Cancer Testing and Screening Industry Volume (K Unit), by Country 2024 & 2032
- Figure 13: Asia Pacific Breast Cancer Testing and Screening Industry Revenue Share (%), by Country 2024 & 2032
- Figure 14: Asia Pacific Breast Cancer Testing and Screening Industry Volume Share (%), by Country 2024 & 2032
- Figure 15: Middle East Breast Cancer Testing and Screening Industry Revenue (Million), by Country 2024 & 2032
- Figure 16: Middle East Breast Cancer Testing and Screening Industry Volume (K Unit), by Country 2024 & 2032
- Figure 17: Middle East Breast Cancer Testing and Screening Industry Revenue Share (%), by Country 2024 & 2032
- Figure 18: Middle East Breast Cancer Testing and Screening Industry Volume Share (%), by Country 2024 & 2032
- Figure 19: GCC Breast Cancer Testing and Screening Industry Revenue (Million), by Country 2024 & 2032
- Figure 20: GCC Breast Cancer Testing and Screening Industry Volume (K Unit), by Country 2024 & 2032
- Figure 21: GCC Breast Cancer Testing and Screening Industry Revenue Share (%), by Country 2024 & 2032
- Figure 22: GCC Breast Cancer Testing and Screening Industry Volume Share (%), by Country 2024 & 2032
- Figure 23: South America Breast Cancer Testing and Screening Industry Revenue (Million), by Country 2024 & 2032
- Figure 24: South America Breast Cancer Testing and Screening Industry Volume (K Unit), by Country 2024 & 2032
- Figure 25: South America Breast Cancer Testing and Screening Industry Revenue Share (%), by Country 2024 & 2032
- Figure 26: South America Breast Cancer Testing and Screening Industry Volume Share (%), by Country 2024 & 2032
- Figure 27: North America Breast Cancer Testing and Screening Industry Revenue (Million), by Test 2024 & 2032
- Figure 28: North America Breast Cancer Testing and Screening Industry Volume (K Unit), by Test 2024 & 2032
- Figure 29: North America Breast Cancer Testing and Screening Industry Revenue Share (%), by Test 2024 & 2032
- Figure 30: North America Breast Cancer Testing and Screening Industry Volume Share (%), by Test 2024 & 2032
- Figure 31: North America Breast Cancer Testing and Screening Industry Revenue (Million), by Country 2024 & 2032
- Figure 32: North America Breast Cancer Testing and Screening Industry Volume (K Unit), by Country 2024 & 2032
- Figure 33: North America Breast Cancer Testing and Screening Industry Revenue Share (%), by Country 2024 & 2032
- Figure 34: North America Breast Cancer Testing and Screening Industry Volume Share (%), by Country 2024 & 2032
- Figure 35: Europe Breast Cancer Testing and Screening Industry Revenue (Million), by Test 2024 & 2032
- Figure 36: Europe Breast Cancer Testing and Screening Industry Volume (K Unit), by Test 2024 & 2032
- Figure 37: Europe Breast Cancer Testing and Screening Industry Revenue Share (%), by Test 2024 & 2032
- Figure 38: Europe Breast Cancer Testing and Screening Industry Volume Share (%), by Test 2024 & 2032
- Figure 39: Europe Breast Cancer Testing and Screening Industry Revenue (Million), by Country 2024 & 2032
- Figure 40: Europe Breast Cancer Testing and Screening Industry Volume (K Unit), by Country 2024 & 2032
- Figure 41: Europe Breast Cancer Testing and Screening Industry Revenue Share (%), by Country 2024 & 2032
- Figure 42: Europe Breast Cancer Testing and Screening Industry Volume Share (%), by Country 2024 & 2032
- Figure 43: Asia Pacific Breast Cancer Testing and Screening Industry Revenue (Million), by Test 2024 & 2032
- Figure 44: Asia Pacific Breast Cancer Testing and Screening Industry Volume (K Unit), by Test 2024 & 2032
- Figure 45: Asia Pacific Breast Cancer Testing and Screening Industry Revenue Share (%), by Test 2024 & 2032
- Figure 46: Asia Pacific Breast Cancer Testing and Screening Industry Volume Share (%), by Test 2024 & 2032
- Figure 47: Asia Pacific Breast Cancer Testing and Screening Industry Revenue (Million), by Country 2024 & 2032
- Figure 48: Asia Pacific Breast Cancer Testing and Screening Industry Volume (K Unit), by Country 2024 & 2032
- Figure 49: Asia Pacific Breast Cancer Testing and Screening Industry Revenue Share (%), by Country 2024 & 2032
- Figure 50: Asia Pacific Breast Cancer Testing and Screening Industry Volume Share (%), by Country 2024 & 2032
- Figure 51: Middle East Breast Cancer Testing and Screening Industry Revenue (Million), by Test 2024 & 2032
- Figure 52: Middle East Breast Cancer Testing and Screening Industry Volume (K Unit), by Test 2024 & 2032
- Figure 53: Middle East Breast Cancer Testing and Screening Industry Revenue Share (%), by Test 2024 & 2032
- Figure 54: Middle East Breast Cancer Testing and Screening Industry Volume Share (%), by Test 2024 & 2032
- Figure 55: Middle East Breast Cancer Testing and Screening Industry Revenue (Million), by Country 2024 & 2032
- Figure 56: Middle East Breast Cancer Testing and Screening Industry Volume (K Unit), by Country 2024 & 2032
- Figure 57: Middle East Breast Cancer Testing and Screening Industry Revenue Share (%), by Country 2024 & 2032
- Figure 58: Middle East Breast Cancer Testing and Screening Industry Volume Share (%), by Country 2024 & 2032
- Figure 59: GCC Breast Cancer Testing and Screening Industry Revenue (Million), by Test 2024 & 2032
- Figure 60: GCC Breast Cancer Testing and Screening Industry Volume (K Unit), by Test 2024 & 2032
- Figure 61: GCC Breast Cancer Testing and Screening Industry Revenue Share (%), by Test 2024 & 2032
- Figure 62: GCC Breast Cancer Testing and Screening Industry Volume Share (%), by Test 2024 & 2032
- Figure 63: GCC Breast Cancer Testing and Screening Industry Revenue (Million), by Country 2024 & 2032
- Figure 64: GCC Breast Cancer Testing and Screening Industry Volume (K Unit), by Country 2024 & 2032
- Figure 65: GCC Breast Cancer Testing and Screening Industry Revenue Share (%), by Country 2024 & 2032
- Figure 66: GCC Breast Cancer Testing and Screening Industry Volume Share (%), by Country 2024 & 2032
- Figure 67: South America Breast Cancer Testing and Screening Industry Revenue (Million), by Test 2024 & 2032
- Figure 68: South America Breast Cancer Testing and Screening Industry Volume (K Unit), by Test 2024 & 2032
- Figure 69: South America Breast Cancer Testing and Screening Industry Revenue Share (%), by Test 2024 & 2032
- Figure 70: South America Breast Cancer Testing and Screening Industry Volume Share (%), by Test 2024 & 2032
- Figure 71: South America Breast Cancer Testing and Screening Industry Revenue (Million), by Country 2024 & 2032
- Figure 72: South America Breast Cancer Testing and Screening Industry Volume (K Unit), by Country 2024 & 2032
- Figure 73: South America Breast Cancer Testing and Screening Industry Revenue Share (%), by Country 2024 & 2032
- Figure 74: South America Breast Cancer Testing and Screening Industry Volume Share (%), by Country 2024 & 2032
List of Tables
- Table 1: Global Breast Cancer Testing and Screening Industry Revenue Million Forecast, by Region 2019 & 2032
- Table 2: Global Breast Cancer Testing and Screening Industry Volume K Unit Forecast, by Region 2019 & 2032
- Table 3: Global Breast Cancer Testing and Screening Industry Revenue Million Forecast, by Test 2019 & 2032
- Table 4: Global Breast Cancer Testing and Screening Industry Volume K Unit Forecast, by Test 2019 & 2032
- Table 5: Global Breast Cancer Testing and Screening Industry Revenue Million Forecast, by Region 2019 & 2032
- Table 6: Global Breast Cancer Testing and Screening Industry Volume K Unit Forecast, by Region 2019 & 2032
- Table 7: Global Breast Cancer Testing and Screening Industry Revenue Million Forecast, by Country 2019 & 2032
- Table 8: Global Breast Cancer Testing and Screening Industry Volume K Unit Forecast, by Country 2019 & 2032
- Table 9: United States Breast Cancer Testing and Screening Industry Revenue (Million) Forecast, by Application 2019 & 2032
- Table 10: United States Breast Cancer Testing and Screening Industry Volume (K Unit) Forecast, by Application 2019 & 2032
- Table 11: Canada Breast Cancer Testing and Screening Industry Revenue (Million) Forecast, by Application 2019 & 2032
- Table 12: Canada Breast Cancer Testing and Screening Industry Volume (K Unit) Forecast, by Application 2019 & 2032
- Table 13: Mexico Breast Cancer Testing and Screening Industry Revenue (Million) Forecast, by Application 2019 & 2032
- Table 14: Mexico Breast Cancer Testing and Screening Industry Volume (K Unit) Forecast, by Application 2019 & 2032
- Table 15: Global Breast Cancer Testing and Screening Industry Revenue Million Forecast, by Country 2019 & 2032
- Table 16: Global Breast Cancer Testing and Screening Industry Volume K Unit Forecast, by Country 2019 & 2032
- Table 17: Germany Breast Cancer Testing and Screening Industry Revenue (Million) Forecast, by Application 2019 & 2032
- Table 18: Germany Breast Cancer Testing and Screening Industry Volume (K Unit) Forecast, by Application 2019 & 2032
- Table 19: United Kindgom Breast Cancer Testing and Screening Industry Revenue (Million) Forecast, by Application 2019 & 2032
- Table 20: United Kindgom Breast Cancer Testing and Screening Industry Volume (K Unit) Forecast, by Application 2019 & 2032
- Table 21: France Breast Cancer Testing and Screening Industry Revenue (Million) Forecast, by Application 2019 & 2032
- Table 22: France Breast Cancer Testing and Screening Industry Volume (K Unit) Forecast, by Application 2019 & 2032
- Table 23: Italy Breast Cancer Testing and Screening Industry Revenue (Million) Forecast, by Application 2019 & 2032
- Table 24: Italy Breast Cancer Testing and Screening Industry Volume (K Unit) Forecast, by Application 2019 & 2032
- Table 25: Spain Breast Cancer Testing and Screening Industry Revenue (Million) Forecast, by Application 2019 & 2032
- Table 26: Spain Breast Cancer Testing and Screening Industry Volume (K Unit) Forecast, by Application 2019 & 2032
- Table 27: Rest of Europe Breast Cancer Testing and Screening Industry Revenue (Million) Forecast, by Application 2019 & 2032
- Table 28: Rest of Europe Breast Cancer Testing and Screening Industry Volume (K Unit) Forecast, by Application 2019 & 2032
- Table 29: Global Breast Cancer Testing and Screening Industry Revenue Million Forecast, by Country 2019 & 2032
- Table 30: Global Breast Cancer Testing and Screening Industry Volume K Unit Forecast, by Country 2019 & 2032
- Table 31: China Breast Cancer Testing and Screening Industry Revenue (Million) Forecast, by Application 2019 & 2032
- Table 32: China Breast Cancer Testing and Screening Industry Volume (K Unit) Forecast, by Application 2019 & 2032
- Table 33: Japan Breast Cancer Testing and Screening Industry Revenue (Million) Forecast, by Application 2019 & 2032
- Table 34: Japan Breast Cancer Testing and Screening Industry Volume (K Unit) Forecast, by Application 2019 & 2032
- Table 35: India Breast Cancer Testing and Screening Industry Revenue (Million) Forecast, by Application 2019 & 2032
- Table 36: India Breast Cancer Testing and Screening Industry Volume (K Unit) Forecast, by Application 2019 & 2032
- Table 37: Australia Breast Cancer Testing and Screening Industry Revenue (Million) Forecast, by Application 2019 & 2032
- Table 38: Australia Breast Cancer Testing and Screening Industry Volume (K Unit) Forecast, by Application 2019 & 2032
- Table 39: South Korea Breast Cancer Testing and Screening Industry Revenue (Million) Forecast, by Application 2019 & 2032
- Table 40: South Korea Breast Cancer Testing and Screening Industry Volume (K Unit) Forecast, by Application 2019 & 2032
- Table 41: Rest of Asia Pacific Breast Cancer Testing and Screening Industry Revenue (Million) Forecast, by Application 2019 & 2032
- Table 42: Rest of Asia Pacific Breast Cancer Testing and Screening Industry Volume (K Unit) Forecast, by Application 2019 & 2032
- Table 43: Global Breast Cancer Testing and Screening Industry Revenue Million Forecast, by Country 2019 & 2032
- Table 44: Global Breast Cancer Testing and Screening Industry Volume K Unit Forecast, by Country 2019 & 2032
- Table 45: Breast Cancer Testing and Screening Industry Revenue (Million) Forecast, by Application 2019 & 2032
- Table 46: Breast Cancer Testing and Screening Industry Volume (K Unit) Forecast, by Application 2019 & 2032
- Table 47: Global Breast Cancer Testing and Screening Industry Revenue Million Forecast, by Country 2019 & 2032
- Table 48: Global Breast Cancer Testing and Screening Industry Volume K Unit Forecast, by Country 2019 & 2032
- Table 49: South Africa Breast Cancer Testing and Screening Industry Revenue (Million) Forecast, by Application 2019 & 2032
- Table 50: South Africa Breast Cancer Testing and Screening Industry Volume (K Unit) Forecast, by Application 2019 & 2032
- Table 51: Rest of Middle East Breast Cancer Testing and Screening Industry Revenue (Million) Forecast, by Application 2019 & 2032
- Table 52: Rest of Middle East Breast Cancer Testing and Screening Industry Volume (K Unit) Forecast, by Application 2019 & 2032
- Table 53: Global Breast Cancer Testing and Screening Industry Revenue Million Forecast, by Country 2019 & 2032
- Table 54: Global Breast Cancer Testing and Screening Industry Volume K Unit Forecast, by Country 2019 & 2032
- Table 55: Brazil Breast Cancer Testing and Screening Industry Revenue (Million) Forecast, by Application 2019 & 2032
- Table 56: Brazil Breast Cancer Testing and Screening Industry Volume (K Unit) Forecast, by Application 2019 & 2032
- Table 57: Argentina Breast Cancer Testing and Screening Industry Revenue (Million) Forecast, by Application 2019 & 2032
- Table 58: Argentina Breast Cancer Testing and Screening Industry Volume (K Unit) Forecast, by Application 2019 & 2032
- Table 59: Rest of South America Breast Cancer Testing and Screening Industry Revenue (Million) Forecast, by Application 2019 & 2032
- Table 60: Rest of South America Breast Cancer Testing and Screening Industry Volume (K Unit) Forecast, by Application 2019 & 2032
- Table 61: Global Breast Cancer Testing and Screening Industry Revenue Million Forecast, by Test 2019 & 2032
- Table 62: Global Breast Cancer Testing and Screening Industry Volume K Unit Forecast, by Test 2019 & 2032
- Table 63: Global Breast Cancer Testing and Screening Industry Revenue Million Forecast, by Country 2019 & 2032
- Table 64: Global Breast Cancer Testing and Screening Industry Volume K Unit Forecast, by Country 2019 & 2032
- Table 65: United States Breast Cancer Testing and Screening Industry Revenue (Million) Forecast, by Application 2019 & 2032
- Table 66: United States Breast Cancer Testing and Screening Industry Volume (K Unit) Forecast, by Application 2019 & 2032
- Table 67: Canada Breast Cancer Testing and Screening Industry Revenue (Million) Forecast, by Application 2019 & 2032
- Table 68: Canada Breast Cancer Testing and Screening Industry Volume (K Unit) Forecast, by Application 2019 & 2032
- Table 69: Mexico Breast Cancer Testing and Screening Industry Revenue (Million) Forecast, by Application 2019 & 2032
- Table 70: Mexico Breast Cancer Testing and Screening Industry Volume (K Unit) Forecast, by Application 2019 & 2032
- Table 71: Global Breast Cancer Testing and Screening Industry Revenue Million Forecast, by Test 2019 & 2032
- Table 72: Global Breast Cancer Testing and Screening Industry Volume K Unit Forecast, by Test 2019 & 2032
- Table 73: Global Breast Cancer Testing and Screening Industry Revenue Million Forecast, by Country 2019 & 2032
- Table 74: Global Breast Cancer Testing and Screening Industry Volume K Unit Forecast, by Country 2019 & 2032
- Table 75: Germany Breast Cancer Testing and Screening Industry Revenue (Million) Forecast, by Application 2019 & 2032
- Table 76: Germany Breast Cancer Testing and Screening Industry Volume (K Unit) Forecast, by Application 2019 & 2032
- Table 77: United Kindgom Breast Cancer Testing and Screening Industry Revenue (Million) Forecast, by Application 2019 & 2032
- Table 78: United Kindgom Breast Cancer Testing and Screening Industry Volume (K Unit) Forecast, by Application 2019 & 2032
- Table 79: France Breast Cancer Testing and Screening Industry Revenue (Million) Forecast, by Application 2019 & 2032
- Table 80: France Breast Cancer Testing and Screening Industry Volume (K Unit) Forecast, by Application 2019 & 2032
- Table 81: Italy Breast Cancer Testing and Screening Industry Revenue (Million) Forecast, by Application 2019 & 2032
- Table 82: Italy Breast Cancer Testing and Screening Industry Volume (K Unit) Forecast, by Application 2019 & 2032
- Table 83: Spain Breast Cancer Testing and Screening Industry Revenue (Million) Forecast, by Application 2019 & 2032
- Table 84: Spain Breast Cancer Testing and Screening Industry Volume (K Unit) Forecast, by Application 2019 & 2032
- Table 85: Rest of Europe Breast Cancer Testing and Screening Industry Revenue (Million) Forecast, by Application 2019 & 2032
- Table 86: Rest of Europe Breast Cancer Testing and Screening Industry Volume (K Unit) Forecast, by Application 2019 & 2032
- Table 87: Global Breast Cancer Testing and Screening Industry Revenue Million Forecast, by Test 2019 & 2032
- Table 88: Global Breast Cancer Testing and Screening Industry Volume K Unit Forecast, by Test 2019 & 2032
- Table 89: Global Breast Cancer Testing and Screening Industry Revenue Million Forecast, by Country 2019 & 2032
- Table 90: Global Breast Cancer Testing and Screening Industry Volume K Unit Forecast, by Country 2019 & 2032
- Table 91: China Breast Cancer Testing and Screening Industry Revenue (Million) Forecast, by Application 2019 & 2032
- Table 92: China Breast Cancer Testing and Screening Industry Volume (K Unit) Forecast, by Application 2019 & 2032
- Table 93: Japan Breast Cancer Testing and Screening Industry Revenue (Million) Forecast, by Application 2019 & 2032
- Table 94: Japan Breast Cancer Testing and Screening Industry Volume (K Unit) Forecast, by Application 2019 & 2032
- Table 95: India Breast Cancer Testing and Screening Industry Revenue (Million) Forecast, by Application 2019 & 2032
- Table 96: India Breast Cancer Testing and Screening Industry Volume (K Unit) Forecast, by Application 2019 & 2032
- Table 97: Australia Breast Cancer Testing and Screening Industry Revenue (Million) Forecast, by Application 2019 & 2032
- Table 98: Australia Breast Cancer Testing and Screening Industry Volume (K Unit) Forecast, by Application 2019 & 2032
- Table 99: South Korea Breast Cancer Testing and Screening Industry Revenue (Million) Forecast, by Application 2019 & 2032
- Table 100: South Korea Breast Cancer Testing and Screening Industry Volume (K Unit) Forecast, by Application 2019 & 2032
- Table 101: Rest of Asia Pacific Breast Cancer Testing and Screening Industry Revenue (Million) Forecast, by Application 2019 & 2032
- Table 102: Rest of Asia Pacific Breast Cancer Testing and Screening Industry Volume (K Unit) Forecast, by Application 2019 & 2032
- Table 103: Global Breast Cancer Testing and Screening Industry Revenue Million Forecast, by Test 2019 & 2032
- Table 104: Global Breast Cancer Testing and Screening Industry Volume K Unit Forecast, by Test 2019 & 2032
- Table 105: Global Breast Cancer Testing and Screening Industry Revenue Million Forecast, by Country 2019 & 2032
- Table 106: Global Breast Cancer Testing and Screening Industry Volume K Unit Forecast, by Country 2019 & 2032
- Table 107: Global Breast Cancer Testing and Screening Industry Revenue Million Forecast, by Test 2019 & 2032
- Table 108: Global Breast Cancer Testing and Screening Industry Volume K Unit Forecast, by Test 2019 & 2032
- Table 109: Global Breast Cancer Testing and Screening Industry Revenue Million Forecast, by Country 2019 & 2032
- Table 110: Global Breast Cancer Testing and Screening Industry Volume K Unit Forecast, by Country 2019 & 2032
- Table 111: South Africa Breast Cancer Testing and Screening Industry Revenue (Million) Forecast, by Application 2019 & 2032
- Table 112: South Africa Breast Cancer Testing and Screening Industry Volume (K Unit) Forecast, by Application 2019 & 2032
- Table 113: Rest of Middle East Breast Cancer Testing and Screening Industry Revenue (Million) Forecast, by Application 2019 & 2032
- Table 114: Rest of Middle East Breast Cancer Testing and Screening Industry Volume (K Unit) Forecast, by Application 2019 & 2032
- Table 115: Global Breast Cancer Testing and Screening Industry Revenue Million Forecast, by Test 2019 & 2032
- Table 116: Global Breast Cancer Testing and Screening Industry Volume K Unit Forecast, by Test 2019 & 2032
- Table 117: Global Breast Cancer Testing and Screening Industry Revenue Million Forecast, by Country 2019 & 2032
- Table 118: Global Breast Cancer Testing and Screening Industry Volume K Unit Forecast, by Country 2019 & 2032
- Table 119: Brazil Breast Cancer Testing and Screening Industry Revenue (Million) Forecast, by Application 2019 & 2032
- Table 120: Brazil Breast Cancer Testing and Screening Industry Volume (K Unit) Forecast, by Application 2019 & 2032
- Table 121: Argentina Breast Cancer Testing and Screening Industry Revenue (Million) Forecast, by Application 2019 & 2032
- Table 122: Argentina Breast Cancer Testing and Screening Industry Volume (K Unit) Forecast, by Application 2019 & 2032
- Table 123: Rest of South America Breast Cancer Testing and Screening Industry Revenue (Million) Forecast, by Application 2019 & 2032
- Table 124: Rest of South America Breast Cancer Testing and Screening Industry Volume (K Unit) Forecast, by Application 2019 & 2032
Frequently Asked Questions
1. What is the projected Compound Annual Growth Rate (CAGR) of the Breast Cancer Testing and Screening Industry?
The projected CAGR is approximately 8.55%.
2. Which companies are prominent players in the Breast Cancer Testing and Screening Industry?
Key companies in the market include Myriad Genetics Inc, Siemens Healthineers, F Hoffmann-La Roche Ltd, Hologic Inc, GE Healthcare, Koninklijke Philips N V, Carestream Health, Quest Diagnostics Incorporated*List Not Exhaustive, NanoString Technologies Inc, Fujifilm Holdings Corporation.
3. What are the main segments of the Breast Cancer Testing and Screening Industry?
The market segments include Test.
4. Can you provide details about the market size?
The market size is estimated to be USD 2.95 Million as of 2022.
5. What are some drivers contributing to market growth?
Increasing Awareness about Early Detection of Breast Cancer; Growing Incidence of Breast Cancer; Increasing Government Initiatives and Support.
6. What are the notable trends driving market growth?
Mammograms segment is Expected to Dominate in the Breast Cancer Screening Test Market.
7. Are there any restraints impacting market growth?
Controversies Related to Mammography; High Cost of Screening Tests in the Developing Countries.
8. Can you provide examples of recent developments in the market?
In June 2022, Biomerica, Inc. entered a general merchandise supplier agreement with Walmart. The Aware Breast Self Exam device will be sold in Walmart's retail system.
9. What pricing options are available for accessing the report?
Pricing options include single-user, multi-user, and enterprise licenses priced at USD 4750, USD 5250, and USD 8750 respectively.
10. Is the market size provided in terms of value or volume?
The market size is provided in terms of value, measured in Million and volume, measured in K Unit.
11. Are there any specific market keywords associated with the report?
Yes, the market keyword associated with the report is "Breast Cancer Testing and Screening Industry," which aids in identifying and referencing the specific market segment covered.
12. How do I determine which pricing option suits my needs best?
The pricing options vary based on user requirements and access needs. Individual users may opt for single-user licenses, while businesses requiring broader access may choose multi-user or enterprise licenses for cost-effective access to the report.
13. Are there any additional resources or data provided in the Breast Cancer Testing and Screening Industry report?
While the report offers comprehensive insights, it's advisable to review the specific contents or supplementary materials provided to ascertain if additional resources or data are available.
14. How can I stay updated on further developments or reports in the Breast Cancer Testing and Screening Industry?
To stay informed about further developments, trends, and reports in the Breast Cancer Testing and Screening Industry, consider subscribing to industry newsletters, following relevant companies and organizations, or regularly checking reputable industry news sources and publications.
Methodology
Step 1 - Identification of Relevant Samples Size from Population Database


Step 2 - Approaches for Defining Global Market Size (Value, Volume* & Price*)

Note*: In applicable scenarios
Step 3 - Data Sources
Primary Research
- Web Analytics
- Survey Reports
- Research Institute
- Latest Research Reports
- Opinion Leaders
Secondary Research
- Annual Reports
- White Paper
- Latest Press Release
- Industry Association
- Paid Database
- Investor Presentations

Step 4 - Data Triangulation
Involves using different sources of information in order to increase the validity of a study
These sources are likely to be stakeholders in a program - participants, other researchers, program staff, other community members, and so on.
Then we put all data in single framework & apply various statistical tools to find out the dynamic on the market.
During the analysis stage, feedback from the stakeholder groups would be compared to determine areas of agreement as well as areas of divergence
