

Key Insights
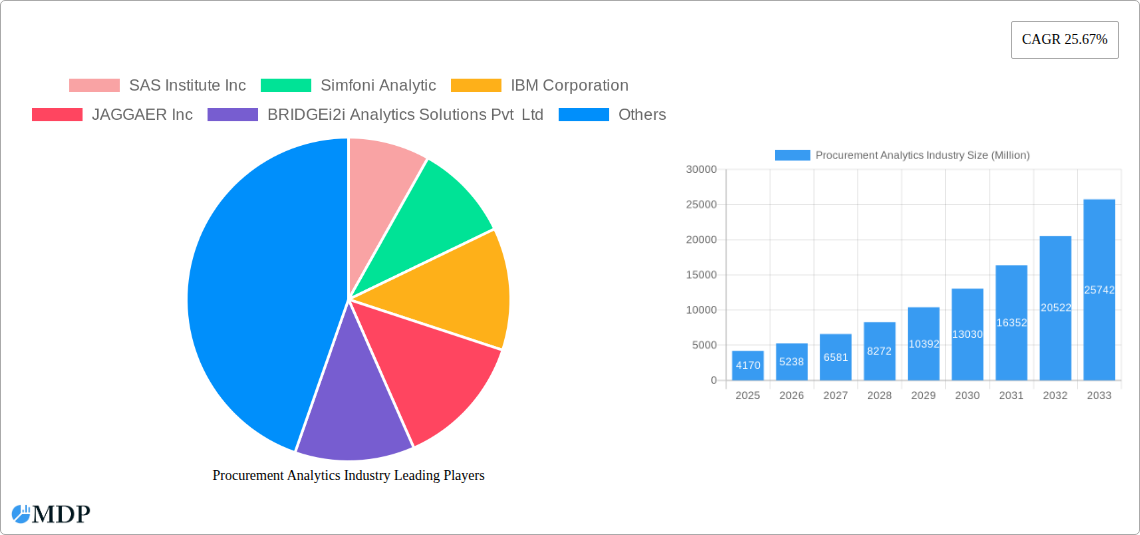
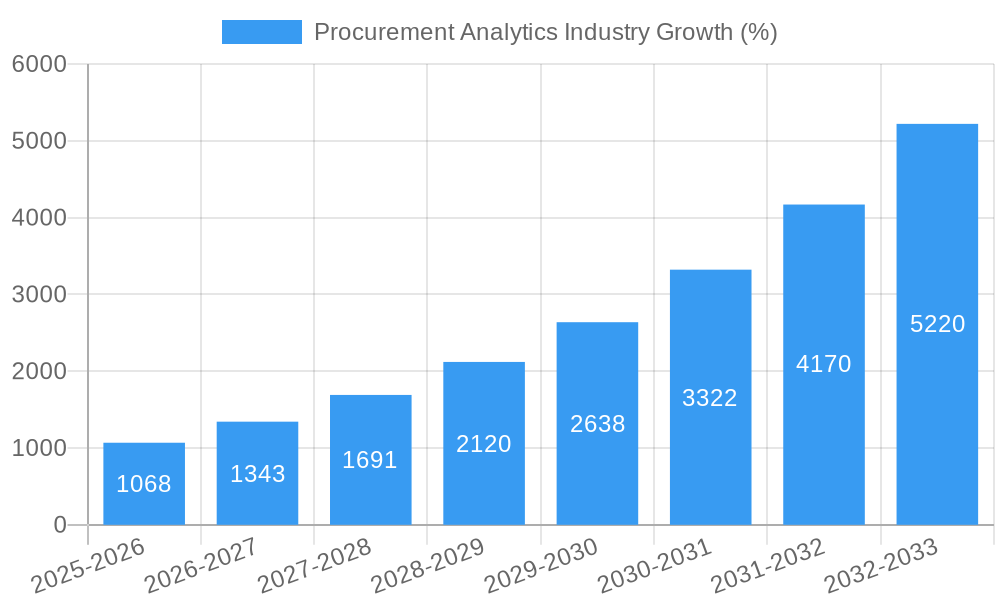
The Procurement Analytics market, valued at $4.17 billion in 2025, is experiencing robust growth, projected to expand at a Compound Annual Growth Rate (CAGR) of 25.67% from 2025 to 2033. This rapid expansion is fueled by several key drivers. The increasing need for enhanced supply chain visibility and resilience in the face of global disruptions is a major factor. Businesses are increasingly leveraging procurement analytics to optimize spending, mitigate risks, and improve forecasting accuracy, leading to significant cost savings and operational efficiencies. The shift towards cloud-based solutions further accelerates adoption, offering scalability, accessibility, and reduced infrastructure costs. Specific applications like spend analytics, risk analytics, and supply chain analytics are experiencing particularly strong demand, driven by the need for data-driven decision-making across various industries. The manufacturing, transportation & logistics, and retail & e-commerce sectors are currently leading adopters, although increasing penetration into BFSI and IT & Telecommunication sectors is anticipated.
The market segmentation reveals a strong preference for cloud-based deployments, reflecting the broader industry trend towards cloud adoption. Software solutions dominate the market share due to their flexibility and integration capabilities, while services play a vital role in implementation, customization, and ongoing support. While the market presents significant opportunities, challenges remain. Data integration complexities, the need for skilled professionals to interpret analytics, and concerns regarding data security are potential restraints. However, continuous advancements in technology and the growing awareness of the benefits of data-driven procurement are expected to overcome these hurdles and maintain the market's impressive growth trajectory throughout the forecast period. Competitors like SAS Institute Inc, IBM, and Oracle are aggressively innovating and expanding their offerings to capture this expanding market share.
Procurement Analytics Market Report: 2019-2033 Forecast
Unlocking Trillion-Dollar Opportunities in Procurement Optimization: A Comprehensive Market Analysis
This comprehensive report provides an in-depth analysis of the Procurement Analytics market, projecting a market valuation of $XX Million by 2033. Covering the period from 2019 to 2033, with a base year of 2025, this report offers crucial insights for stakeholders across the industry, including software providers, service companies, and end-users. Benefit from detailed segmentation analysis, competitive landscape mapping, and future growth predictions to make informed strategic decisions.
Procurement Analytics Industry Market Dynamics & Concentration
The global Procurement Analytics market, valued at $XX Million in 2025, is experiencing significant growth driven by increasing adoption of cloud-based solutions and a rising focus on digital transformation within organizations. Market concentration is moderate, with several key players holding substantial market share. However, the landscape is dynamic, with ongoing mergers and acquisitions (M&A) activity shaping the competitive landscape. In the last five years, approximately xx M&A deals were recorded.
- Market Share: While precise market share data for each player requires proprietary research, leading companies such as SAP SE, Oracle Corporation, and IBM Corporation hold significant market share. Smaller companies like BRIDGEi2i Analytics Solutions Pvt Ltd and Rosslyn Data Technologies PLC are experiencing substantial growth.
- Innovation Drivers: Advancements in Artificial Intelligence (AI), Machine Learning (ML), and Big Data analytics are key innovation drivers, enhancing predictive capabilities and automating procurement processes. Regulatory changes mandating greater transparency and accountability in procurement practices also fuel market growth.
- Regulatory Frameworks: Government regulations concerning data privacy (e.g., GDPR) and transparency in public procurement influence market dynamics and drive demand for compliant solutions.
- Product Substitutes: While direct substitutes are limited, legacy procurement systems pose competitive challenges. The value proposition of Procurement Analytics lies in its ability to offer enhanced data-driven insights, automation, and cost optimization.
- End-User Trends: The increasing adoption of digital technologies across various industries (Manufacturing, BFSI, Retail and E-commerce) is a significant end-user trend. Organizations are increasingly realizing the ROI of advanced analytics and automation for supply chain optimization.
- M&A Activities: The Procurement Analytics landscape sees frequent M&A activity, driven by companies seeking to expand their product portfolio, acquire key technologies, and enhance their market presence.
Procurement Analytics Industry Industry Trends & Analysis
The Procurement Analytics market is experiencing robust growth, with a Compound Annual Growth Rate (CAGR) of XX% projected during the forecast period (2025-2033). This growth is driven by several key factors:
- Increased focus on cost optimization and efficiency: Organizations across sectors are actively seeking ways to streamline their procurement processes and reduce operational costs. Procurement analytics plays a crucial role in this endeavor by providing data-driven insights into spending patterns, supplier performance, and contract compliance.
- Growing adoption of cloud-based solutions: Cloud deployment offers scalability, flexibility, and cost-effectiveness, leading to wider adoption of procurement analytics software.
- Technological advancements in AI and ML: These technologies are transforming procurement analytics by enabling better predictive capabilities, automated decision-making, and real-time insights.
- Rising need for risk mitigation and supply chain resilience: The increasing complexity and volatility of global supply chains necessitate effective risk management strategies. Procurement analytics helps identify and mitigate potential disruptions and ensures business continuity.
- Enhanced data visibility and transparency: Advanced analytics solutions provide a unified view of procurement data, enabling improved decision-making and enhanced collaboration across departments. Market penetration for cloud-based solutions is estimated to reach XX% by 2033.
Leading Markets & Segments in Procurement Analytics Industry
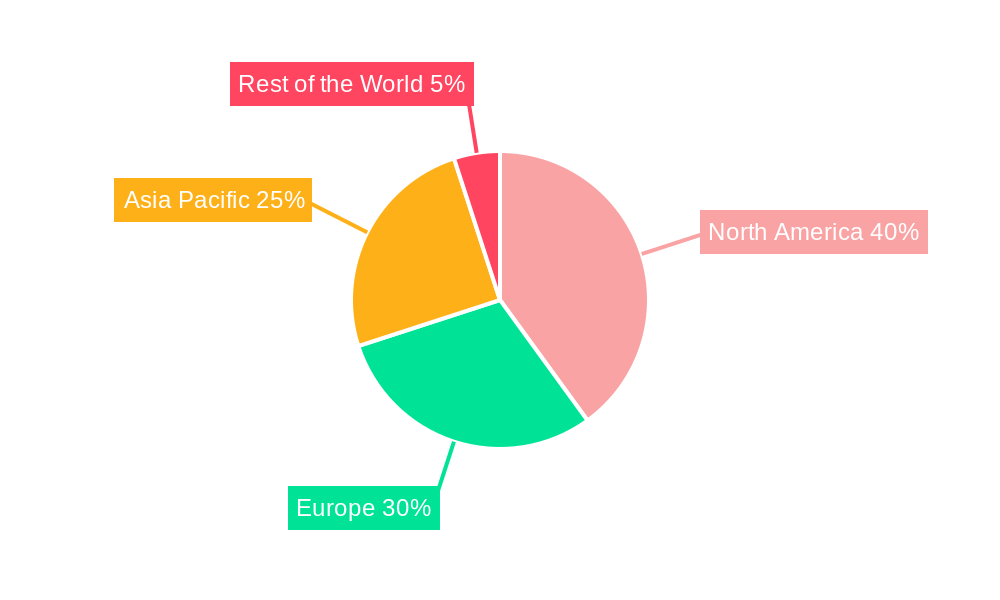
The North American region currently dominates the Procurement Analytics market, followed by Europe and Asia-Pacific. However, rapid growth is anticipated in emerging economies due to increasing digitalization and infrastructure development.
- By Type: The software segment currently holds the largest market share, driven by the increasing demand for sophisticated analytics and automation capabilities. However, the services segment is expected to experience faster growth due to the increasing need for implementation and consulting services.
- By Deployment Type: The cloud deployment model is rapidly gaining traction, primarily due to its scalability, accessibility, and reduced upfront investment costs. On-premise deployment still retains a significant market share, particularly among large enterprises with stringent data security requirements.
- By Application: Spend Analytics and Supply Chain Analytics are the most widely adopted applications, followed by Risk Analytics and Contract Management. Demand forecasting is an area of growing interest among companies seeking to optimize their inventory management.
- By End-User: The manufacturing sector is a major adopter of Procurement Analytics solutions, followed by the retail and e-commerce and BFSI sectors. The IT & Telecommunication sector is also exhibiting strong growth due to the increasing reliance on digital platforms and global supply chains.
Key Drivers: Economic policies promoting digital transformation, increasing government investments in infrastructure, and the growing adoption of Industry 4.0 principles across various sectors are significant growth drivers for leading regions and segments.
Procurement Analytics Industry Product Developments
Recent product innovations have focused on integrating AI and ML capabilities into Procurement Analytics platforms to enhance predictive modeling, automate decision-making, and improve overall efficiency. This includes improved dashboards, streamlined reporting, and enhanced integration with other enterprise systems. These advances are improving market fit by offering more tailored and user-friendly solutions.
Key Drivers of Procurement Analytics Industry Growth
The growth of the Procurement Analytics industry is primarily fueled by the following factors:
- Technological advancements: The continuous development and integration of AI, ML, and Big Data analytics into procurement software solutions are improving the efficiency, accuracy, and capabilities of these platforms.
- Economic factors: The increasing need for cost optimization, efficiency improvements, and competitive advantages in today’s global economy is driving the adoption of procurement analytics solutions.
- Regulatory pressures: Government regulations concerning transparency, compliance, and data security are forcing organizations to adopt advanced analytics solutions to ensure adherence to various standards.
Challenges in the Procurement Analytics Industry Market
Several challenges impede market growth:
- High implementation costs: Deploying and integrating advanced analytics solutions can require significant upfront investment and ongoing maintenance expenses.
- Data integration complexities: Consolidating and integrating data from multiple disparate sources can be challenging, requiring specialized expertise and sophisticated tools.
- Lack of skilled professionals: A shortage of professionals with the skills needed to effectively implement and manage Procurement Analytics systems presents a significant challenge. This shortage impacts the market's growth potential by roughly XX%.
Emerging Opportunities in Procurement Analytics Industry
The future of Procurement Analytics is bright, with numerous opportunities arising from technological advancements, strategic partnerships, and market expansions. Advanced AI capabilities, including predictive modeling for risk management and supply chain optimization, present particularly exciting growth avenues. Strategic partnerships between analytics providers and procurement software vendors can lead to innovative solutions, creating new market opportunities and expanding the addressable market.
Leading Players in the Procurement Analytics Industry Sector
- SAS Institute Inc
- Simfoni Analytic
- IBM Corporation
- JAGGAER Inc
- BRIDGEi2i Analytics Solutions Pvt Ltd
- Rosslyn Data Technologies PLC
- Zycus Inc
- Oracle Corporation
- SAP SE
- Genpact Limited
Key Milestones in Procurement Analytics Industry Industry
- October 2023: SAP announced that Tata Projects Limited is leveraging RISE with SAP solutions for business transformation, highlighting the increasing adoption of cloud-based solutions in large enterprises.
- August 2022: SAS Institute Inc.'s partnership with SingleStore improved data access and scalability for its analytics platform, strengthening its competitive position in the market.
Strategic Outlook for Procurement Analytics Industry Market
The Procurement Analytics market is poised for substantial growth, driven by continuous innovation, increasing digital adoption, and the growing need for supply chain resilience. Strategic partnerships, expansion into new markets, and the development of innovative solutions using AI and ML will be key to unlocking the full potential of this dynamic market. Companies focusing on user-friendly interfaces and seamless data integration will have a significant advantage in the market.
Procurement Analytics Industry Segmentation
-
1. Type
- 1.1. Software
- 1.2. Services
-
2. Deployment Type
- 2.1. On-Premise
- 2.2. Cloud
-
3. Application
- 3.1. Supply Chain Analytics
- 3.2. Risk Analytics
- 3.3. Spend Analytics
- 3.4. Demand Forecasting
- 3.5. Contract Management
-
4. End-User
- 4.1. Manufacturing
- 4.2. Transportation & Logistic
- 4.3. Retail and E-commerce
- 4.4. BFSI
- 4.5. IT & Telecommunication
- 4.6. Other End-Users (Education, Healthcare)
Procurement Analytics Industry Segmentation By Geography
- 1. North America
- 2. Europe
- 3. Asia Pacific
- 4. Rest of the World
Procurement Analytics Industry REPORT HIGHLIGHTS
| Aspects | Details |
|---|---|
| Study Period | 2019-2033 |
| Base Year | 2024 |
| Estimated Year | 2025 |
| Forecast Period | 2025-2033 |
| Historical Period | 2019-2024 |
| Growth Rate | CAGR of 25.67% from 2019-2033 |
| Segmentation |
|
Table of Contents
- 1. Introduction
- 1.1. Research Scope
- 1.2. Market Segmentation
- 1.3. Research Methodology
- 1.4. Definitions and Assumptions
- 2. Executive Summary
- 2.1. Introduction
- 3. Market Dynamics
- 3.1. Introduction
- 3.2. Market Drivers
- 3.2.1. Rising Adoption in Procurement Process in Industries; Rising Demand for Cloud Based Analytical Solutions
- 3.3. Market Restrains
- 3.3.1. Lack of Trained and Skilled Analytical Professionals; Growing Data Breaches Cases
- 3.4. Market Trends
- 3.4.1. Retail and E-commerce Sector to Witness the Growth
- 4. Market Factor Analysis
- 4.1. Porters Five Forces
- 4.2. Supply/Value Chain
- 4.3. PESTEL analysis
- 4.4. Market Entropy
- 4.5. Patent/Trademark Analysis
- 5. Global Procurement Analytics Industry Analysis, Insights and Forecast, 2019-2031
- 5.1. Market Analysis, Insights and Forecast - by Type
- 5.1.1. Software
- 5.1.2. Services
- 5.2. Market Analysis, Insights and Forecast - by Deployment Type
- 5.2.1. On-Premise
- 5.2.2. Cloud
- 5.3. Market Analysis, Insights and Forecast - by Application
- 5.3.1. Supply Chain Analytics
- 5.3.2. Risk Analytics
- 5.3.3. Spend Analytics
- 5.3.4. Demand Forecasting
- 5.3.5. Contract Management
- 5.4. Market Analysis, Insights and Forecast - by End-User
- 5.4.1. Manufacturing
- 5.4.2. Transportation & Logistic
- 5.4.3. Retail and E-commerce
- 5.4.4. BFSI
- 5.4.5. IT & Telecommunication
- 5.4.6. Other End-Users (Education, Healthcare)
- 5.5. Market Analysis, Insights and Forecast - by Region
- 5.5.1. North America
- 5.5.2. Europe
- 5.5.3. Asia Pacific
- 5.5.4. Rest of the World
- 5.1. Market Analysis, Insights and Forecast - by Type
- 6. North America Procurement Analytics Industry Analysis, Insights and Forecast, 2019-2031
- 6.1. Market Analysis, Insights and Forecast - by Type
- 6.1.1. Software
- 6.1.2. Services
- 6.2. Market Analysis, Insights and Forecast - by Deployment Type
- 6.2.1. On-Premise
- 6.2.2. Cloud
- 6.3. Market Analysis, Insights and Forecast - by Application
- 6.3.1. Supply Chain Analytics
- 6.3.2. Risk Analytics
- 6.3.3. Spend Analytics
- 6.3.4. Demand Forecasting
- 6.3.5. Contract Management
- 6.4. Market Analysis, Insights and Forecast - by End-User
- 6.4.1. Manufacturing
- 6.4.2. Transportation & Logistic
- 6.4.3. Retail and E-commerce
- 6.4.4. BFSI
- 6.4.5. IT & Telecommunication
- 6.4.6. Other End-Users (Education, Healthcare)
- 6.1. Market Analysis, Insights and Forecast - by Type
- 7. Europe Procurement Analytics Industry Analysis, Insights and Forecast, 2019-2031
- 7.1. Market Analysis, Insights and Forecast - by Type
- 7.1.1. Software
- 7.1.2. Services
- 7.2. Market Analysis, Insights and Forecast - by Deployment Type
- 7.2.1. On-Premise
- 7.2.2. Cloud
- 7.3. Market Analysis, Insights and Forecast - by Application
- 7.3.1. Supply Chain Analytics
- 7.3.2. Risk Analytics
- 7.3.3. Spend Analytics
- 7.3.4. Demand Forecasting
- 7.3.5. Contract Management
- 7.4. Market Analysis, Insights and Forecast - by End-User
- 7.4.1. Manufacturing
- 7.4.2. Transportation & Logistic
- 7.4.3. Retail and E-commerce
- 7.4.4. BFSI
- 7.4.5. IT & Telecommunication
- 7.4.6. Other End-Users (Education, Healthcare)
- 7.1. Market Analysis, Insights and Forecast - by Type
- 8. Asia Pacific Procurement Analytics Industry Analysis, Insights and Forecast, 2019-2031
- 8.1. Market Analysis, Insights and Forecast - by Type
- 8.1.1. Software
- 8.1.2. Services
- 8.2. Market Analysis, Insights and Forecast - by Deployment Type
- 8.2.1. On-Premise
- 8.2.2. Cloud
- 8.3. Market Analysis, Insights and Forecast - by Application
- 8.3.1. Supply Chain Analytics
- 8.3.2. Risk Analytics
- 8.3.3. Spend Analytics
- 8.3.4. Demand Forecasting
- 8.3.5. Contract Management
- 8.4. Market Analysis, Insights and Forecast - by End-User
- 8.4.1. Manufacturing
- 8.4.2. Transportation & Logistic
- 8.4.3. Retail and E-commerce
- 8.4.4. BFSI
- 8.4.5. IT & Telecommunication
- 8.4.6. Other End-Users (Education, Healthcare)
- 8.1. Market Analysis, Insights and Forecast - by Type
- 9. Rest of the World Procurement Analytics Industry Analysis, Insights and Forecast, 2019-2031
- 9.1. Market Analysis, Insights and Forecast - by Type
- 9.1.1. Software
- 9.1.2. Services
- 9.2. Market Analysis, Insights and Forecast - by Deployment Type
- 9.2.1. On-Premise
- 9.2.2. Cloud
- 9.3. Market Analysis, Insights and Forecast - by Application
- 9.3.1. Supply Chain Analytics
- 9.3.2. Risk Analytics
- 9.3.3. Spend Analytics
- 9.3.4. Demand Forecasting
- 9.3.5. Contract Management
- 9.4. Market Analysis, Insights and Forecast - by End-User
- 9.4.1. Manufacturing
- 9.4.2. Transportation & Logistic
- 9.4.3. Retail and E-commerce
- 9.4.4. BFSI
- 9.4.5. IT & Telecommunication
- 9.4.6. Other End-Users (Education, Healthcare)
- 9.1. Market Analysis, Insights and Forecast - by Type
- 10. North America Procurement Analytics Industry Analysis, Insights and Forecast, 2019-2031
- 10.1. Market Analysis, Insights and Forecast - By Country/Sub-region
- 10.1.1.
- 11. Europe Procurement Analytics Industry Analysis, Insights and Forecast, 2019-2031
- 11.1. Market Analysis, Insights and Forecast - By Country/Sub-region
- 11.1.1.
- 12. Asia Pacific Procurement Analytics Industry Analysis, Insights and Forecast, 2019-2031
- 12.1. Market Analysis, Insights and Forecast - By Country/Sub-region
- 12.1.1.
- 13. Rest of the World Procurement Analytics Industry Analysis, Insights and Forecast, 2019-2031
- 13.1. Market Analysis, Insights and Forecast - By Country/Sub-region
- 13.1.1.
- 14. Competitive Analysis
- 14.1. Global Market Share Analysis 2024
- 14.2. Company Profiles
- 14.2.1 SAS Institute Inc
- 14.2.1.1. Overview
- 14.2.1.2. Products
- 14.2.1.3. SWOT Analysis
- 14.2.1.4. Recent Developments
- 14.2.1.5. Financials (Based on Availability)
- 14.2.2 Simfoni Analytic
- 14.2.2.1. Overview
- 14.2.2.2. Products
- 14.2.2.3. SWOT Analysis
- 14.2.2.4. Recent Developments
- 14.2.2.5. Financials (Based on Availability)
- 14.2.3 IBM Corporation
- 14.2.3.1. Overview
- 14.2.3.2. Products
- 14.2.3.3. SWOT Analysis
- 14.2.3.4. Recent Developments
- 14.2.3.5. Financials (Based on Availability)
- 14.2.4 JAGGAER Inc
- 14.2.4.1. Overview
- 14.2.4.2. Products
- 14.2.4.3. SWOT Analysis
- 14.2.4.4. Recent Developments
- 14.2.4.5. Financials (Based on Availability)
- 14.2.5 BRIDGEi2i Analytics Solutions Pvt Ltd
- 14.2.5.1. Overview
- 14.2.5.2. Products
- 14.2.5.3. SWOT Analysis
- 14.2.5.4. Recent Developments
- 14.2.5.5. Financials (Based on Availability)
- 14.2.6 Rosslyn Data Technologies PLC
- 14.2.6.1. Overview
- 14.2.6.2. Products
- 14.2.6.3. SWOT Analysis
- 14.2.6.4. Recent Developments
- 14.2.6.5. Financials (Based on Availability)
- 14.2.7 Zycus Inc
- 14.2.7.1. Overview
- 14.2.7.2. Products
- 14.2.7.3. SWOT Analysis
- 14.2.7.4. Recent Developments
- 14.2.7.5. Financials (Based on Availability)
- 14.2.8 Oracle Corporation
- 14.2.8.1. Overview
- 14.2.8.2. Products
- 14.2.8.3. SWOT Analysis
- 14.2.8.4. Recent Developments
- 14.2.8.5. Financials (Based on Availability)
- 14.2.9 SAP SE
- 14.2.9.1. Overview
- 14.2.9.2. Products
- 14.2.9.3. SWOT Analysis
- 14.2.9.4. Recent Developments
- 14.2.9.5. Financials (Based on Availability)
- 14.2.10 Genpact Limited
- 14.2.10.1. Overview
- 14.2.10.2. Products
- 14.2.10.3. SWOT Analysis
- 14.2.10.4. Recent Developments
- 14.2.10.5. Financials (Based on Availability)
- 14.2.1 SAS Institute Inc
List of Figures
- Figure 1: Global Procurement Analytics Industry Revenue Breakdown (Million, %) by Region 2024 & 2032
- Figure 2: North America Procurement Analytics Industry Revenue (Million), by Country 2024 & 2032
- Figure 3: North America Procurement Analytics Industry Revenue Share (%), by Country 2024 & 2032
- Figure 4: Europe Procurement Analytics Industry Revenue (Million), by Country 2024 & 2032
- Figure 5: Europe Procurement Analytics Industry Revenue Share (%), by Country 2024 & 2032
- Figure 6: Asia Pacific Procurement Analytics Industry Revenue (Million), by Country 2024 & 2032
- Figure 7: Asia Pacific Procurement Analytics Industry Revenue Share (%), by Country 2024 & 2032
- Figure 8: Rest of the World Procurement Analytics Industry Revenue (Million), by Country 2024 & 2032
- Figure 9: Rest of the World Procurement Analytics Industry Revenue Share (%), by Country 2024 & 2032
- Figure 10: North America Procurement Analytics Industry Revenue (Million), by Type 2024 & 2032
- Figure 11: North America Procurement Analytics Industry Revenue Share (%), by Type 2024 & 2032
- Figure 12: North America Procurement Analytics Industry Revenue (Million), by Deployment Type 2024 & 2032
- Figure 13: North America Procurement Analytics Industry Revenue Share (%), by Deployment Type 2024 & 2032
- Figure 14: North America Procurement Analytics Industry Revenue (Million), by Application 2024 & 2032
- Figure 15: North America Procurement Analytics Industry Revenue Share (%), by Application 2024 & 2032
- Figure 16: North America Procurement Analytics Industry Revenue (Million), by End-User 2024 & 2032
- Figure 17: North America Procurement Analytics Industry Revenue Share (%), by End-User 2024 & 2032
- Figure 18: North America Procurement Analytics Industry Revenue (Million), by Country 2024 & 2032
- Figure 19: North America Procurement Analytics Industry Revenue Share (%), by Country 2024 & 2032
- Figure 20: Europe Procurement Analytics Industry Revenue (Million), by Type 2024 & 2032
- Figure 21: Europe Procurement Analytics Industry Revenue Share (%), by Type 2024 & 2032
- Figure 22: Europe Procurement Analytics Industry Revenue (Million), by Deployment Type 2024 & 2032
- Figure 23: Europe Procurement Analytics Industry Revenue Share (%), by Deployment Type 2024 & 2032
- Figure 24: Europe Procurement Analytics Industry Revenue (Million), by Application 2024 & 2032
- Figure 25: Europe Procurement Analytics Industry Revenue Share (%), by Application 2024 & 2032
- Figure 26: Europe Procurement Analytics Industry Revenue (Million), by End-User 2024 & 2032
- Figure 27: Europe Procurement Analytics Industry Revenue Share (%), by End-User 2024 & 2032
- Figure 28: Europe Procurement Analytics Industry Revenue (Million), by Country 2024 & 2032
- Figure 29: Europe Procurement Analytics Industry Revenue Share (%), by Country 2024 & 2032
- Figure 30: Asia Pacific Procurement Analytics Industry Revenue (Million), by Type 2024 & 2032
- Figure 31: Asia Pacific Procurement Analytics Industry Revenue Share (%), by Type 2024 & 2032
- Figure 32: Asia Pacific Procurement Analytics Industry Revenue (Million), by Deployment Type 2024 & 2032
- Figure 33: Asia Pacific Procurement Analytics Industry Revenue Share (%), by Deployment Type 2024 & 2032
- Figure 34: Asia Pacific Procurement Analytics Industry Revenue (Million), by Application 2024 & 2032
- Figure 35: Asia Pacific Procurement Analytics Industry Revenue Share (%), by Application 2024 & 2032
- Figure 36: Asia Pacific Procurement Analytics Industry Revenue (Million), by End-User 2024 & 2032
- Figure 37: Asia Pacific Procurement Analytics Industry Revenue Share (%), by End-User 2024 & 2032
- Figure 38: Asia Pacific Procurement Analytics Industry Revenue (Million), by Country 2024 & 2032
- Figure 39: Asia Pacific Procurement Analytics Industry Revenue Share (%), by Country 2024 & 2032
- Figure 40: Rest of the World Procurement Analytics Industry Revenue (Million), by Type 2024 & 2032
- Figure 41: Rest of the World Procurement Analytics Industry Revenue Share (%), by Type 2024 & 2032
- Figure 42: Rest of the World Procurement Analytics Industry Revenue (Million), by Deployment Type 2024 & 2032
- Figure 43: Rest of the World Procurement Analytics Industry Revenue Share (%), by Deployment Type 2024 & 2032
- Figure 44: Rest of the World Procurement Analytics Industry Revenue (Million), by Application 2024 & 2032
- Figure 45: Rest of the World Procurement Analytics Industry Revenue Share (%), by Application 2024 & 2032
- Figure 46: Rest of the World Procurement Analytics Industry Revenue (Million), by End-User 2024 & 2032
- Figure 47: Rest of the World Procurement Analytics Industry Revenue Share (%), by End-User 2024 & 2032
- Figure 48: Rest of the World Procurement Analytics Industry Revenue (Million), by Country 2024 & 2032
- Figure 49: Rest of the World Procurement Analytics Industry Revenue Share (%), by Country 2024 & 2032
List of Tables
- Table 1: Global Procurement Analytics Industry Revenue Million Forecast, by Region 2019 & 2032
- Table 2: Global Procurement Analytics Industry Revenue Million Forecast, by Type 2019 & 2032
- Table 3: Global Procurement Analytics Industry Revenue Million Forecast, by Deployment Type 2019 & 2032
- Table 4: Global Procurement Analytics Industry Revenue Million Forecast, by Application 2019 & 2032
- Table 5: Global Procurement Analytics Industry Revenue Million Forecast, by End-User 2019 & 2032
- Table 6: Global Procurement Analytics Industry Revenue Million Forecast, by Region 2019 & 2032
- Table 7: Global Procurement Analytics Industry Revenue Million Forecast, by Country 2019 & 2032
- Table 8: Procurement Analytics Industry Revenue (Million) Forecast, by Application 2019 & 2032
- Table 9: Global Procurement Analytics Industry Revenue Million Forecast, by Country 2019 & 2032
- Table 10: Procurement Analytics Industry Revenue (Million) Forecast, by Application 2019 & 2032
- Table 11: Global Procurement Analytics Industry Revenue Million Forecast, by Country 2019 & 2032
- Table 12: Procurement Analytics Industry Revenue (Million) Forecast, by Application 2019 & 2032
- Table 13: Global Procurement Analytics Industry Revenue Million Forecast, by Country 2019 & 2032
- Table 14: Procurement Analytics Industry Revenue (Million) Forecast, by Application 2019 & 2032
- Table 15: Global Procurement Analytics Industry Revenue Million Forecast, by Type 2019 & 2032
- Table 16: Global Procurement Analytics Industry Revenue Million Forecast, by Deployment Type 2019 & 2032
- Table 17: Global Procurement Analytics Industry Revenue Million Forecast, by Application 2019 & 2032
- Table 18: Global Procurement Analytics Industry Revenue Million Forecast, by End-User 2019 & 2032
- Table 19: Global Procurement Analytics Industry Revenue Million Forecast, by Country 2019 & 2032
- Table 20: Global Procurement Analytics Industry Revenue Million Forecast, by Type 2019 & 2032
- Table 21: Global Procurement Analytics Industry Revenue Million Forecast, by Deployment Type 2019 & 2032
- Table 22: Global Procurement Analytics Industry Revenue Million Forecast, by Application 2019 & 2032
- Table 23: Global Procurement Analytics Industry Revenue Million Forecast, by End-User 2019 & 2032
- Table 24: Global Procurement Analytics Industry Revenue Million Forecast, by Country 2019 & 2032
- Table 25: Global Procurement Analytics Industry Revenue Million Forecast, by Type 2019 & 2032
- Table 26: Global Procurement Analytics Industry Revenue Million Forecast, by Deployment Type 2019 & 2032
- Table 27: Global Procurement Analytics Industry Revenue Million Forecast, by Application 2019 & 2032
- Table 28: Global Procurement Analytics Industry Revenue Million Forecast, by End-User 2019 & 2032
- Table 29: Global Procurement Analytics Industry Revenue Million Forecast, by Country 2019 & 2032
- Table 30: Global Procurement Analytics Industry Revenue Million Forecast, by Type 2019 & 2032
- Table 31: Global Procurement Analytics Industry Revenue Million Forecast, by Deployment Type 2019 & 2032
- Table 32: Global Procurement Analytics Industry Revenue Million Forecast, by Application 2019 & 2032
- Table 33: Global Procurement Analytics Industry Revenue Million Forecast, by End-User 2019 & 2032
- Table 34: Global Procurement Analytics Industry Revenue Million Forecast, by Country 2019 & 2032
Frequently Asked Questions
1. What is the projected Compound Annual Growth Rate (CAGR) of the Procurement Analytics Industry?
The projected CAGR is approximately 25.67%.
2. Which companies are prominent players in the Procurement Analytics Industry?
Key companies in the market include SAS Institute Inc, Simfoni Analytic, IBM Corporation, JAGGAER Inc, BRIDGEi2i Analytics Solutions Pvt Ltd, Rosslyn Data Technologies PLC, Zycus Inc, Oracle Corporation, SAP SE, Genpact Limited.
3. What are the main segments of the Procurement Analytics Industry?
The market segments include Type, Deployment Type, Application, End-User.
4. Can you provide details about the market size?
The market size is estimated to be USD 4.17 Million as of 2022.
5. What are some drivers contributing to market growth?
Rising Adoption in Procurement Process in Industries; Rising Demand for Cloud Based Analytical Solutions.
6. What are the notable trends driving market growth?
Retail and E-commerce Sector to Witness the Growth.
7. Are there any restraints impacting market growth?
Lack of Trained and Skilled Analytical Professionals; Growing Data Breaches Cases.
8. Can you provide examples of recent developments in the market?
October 2023: SAP announced that Tata Projects Limited, one of India's fastest-growing technology, engineering, procurement, and construction companies, is accelerating its business transformation journey by leveraging the RISE with SAP solutions and surrounding cloud solutions.
9. What pricing options are available for accessing the report?
Pricing options include single-user, multi-user, and enterprise licenses priced at USD 4750, USD 5250, and USD 8750 respectively.
10. Is the market size provided in terms of value or volume?
The market size is provided in terms of value, measured in Million.
11. Are there any specific market keywords associated with the report?
Yes, the market keyword associated with the report is "Procurement Analytics Industry," which aids in identifying and referencing the specific market segment covered.
12. How do I determine which pricing option suits my needs best?
The pricing options vary based on user requirements and access needs. Individual users may opt for single-user licenses, while businesses requiring broader access may choose multi-user or enterprise licenses for cost-effective access to the report.
13. Are there any additional resources or data provided in the Procurement Analytics Industry report?
While the report offers comprehensive insights, it's advisable to review the specific contents or supplementary materials provided to ascertain if additional resources or data are available.
14. How can I stay updated on further developments or reports in the Procurement Analytics Industry?
To stay informed about further developments, trends, and reports in the Procurement Analytics Industry, consider subscribing to industry newsletters, following relevant companies and organizations, or regularly checking reputable industry news sources and publications.
Methodology
Step 1 - Identification of Relevant Samples Size from Population Database


Step 2 - Approaches for Defining Global Market Size (Value, Volume* & Price*)

Note*: In applicable scenarios
Step 3 - Data Sources
Primary Research
- Web Analytics
- Survey Reports
- Research Institute
- Latest Research Reports
- Opinion Leaders
Secondary Research
- Annual Reports
- White Paper
- Latest Press Release
- Industry Association
- Paid Database
- Investor Presentations

Step 4 - Data Triangulation
Involves using different sources of information in order to increase the validity of a study
These sources are likely to be stakeholders in a program - participants, other researchers, program staff, other community members, and so on.
Then we put all data in single framework & apply various statistical tools to find out the dynamic on the market.
During the analysis stage, feedback from the stakeholder groups would be compared to determine areas of agreement as well as areas of divergence
