

Key Insights
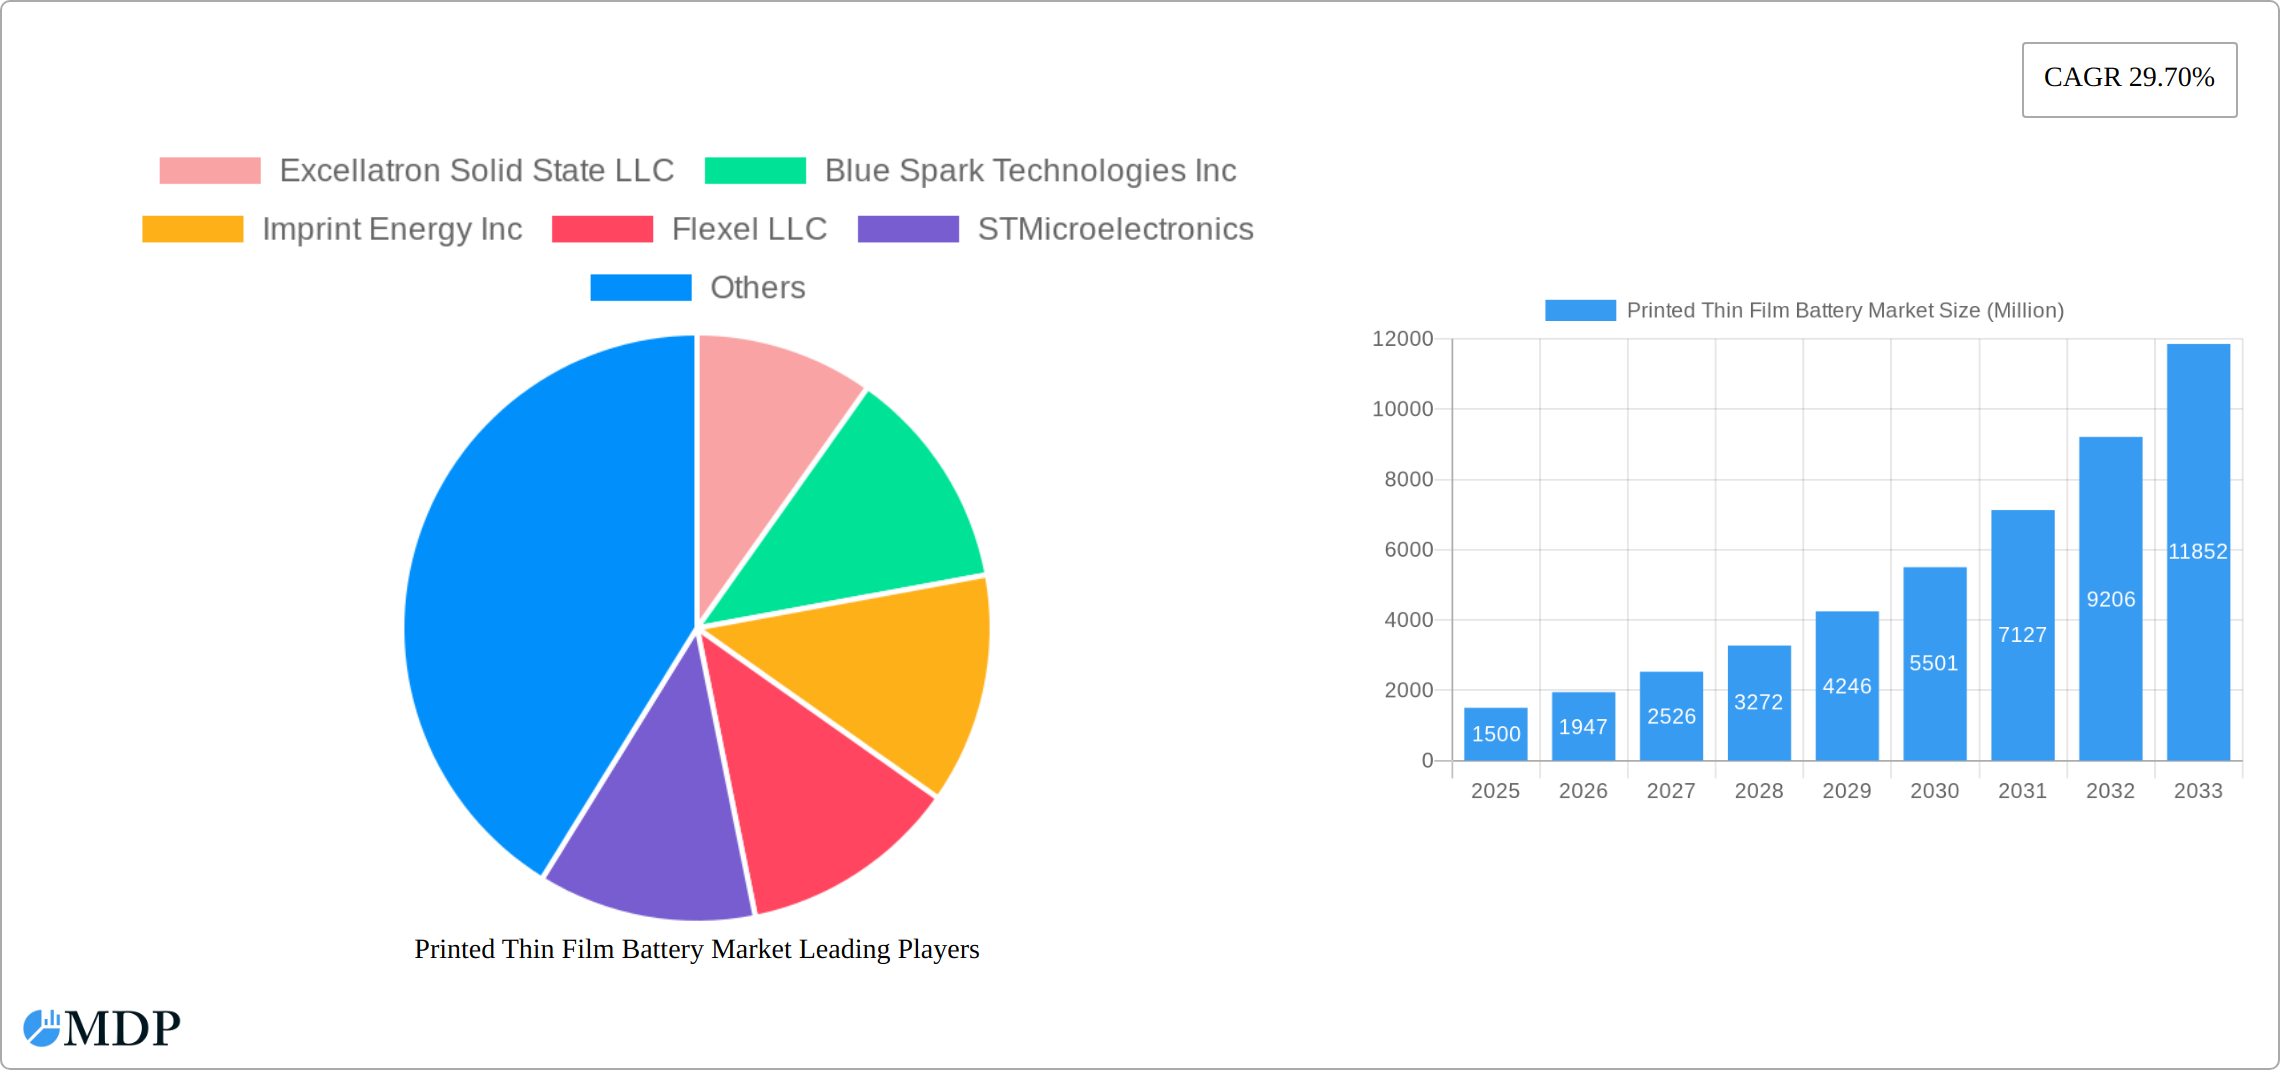
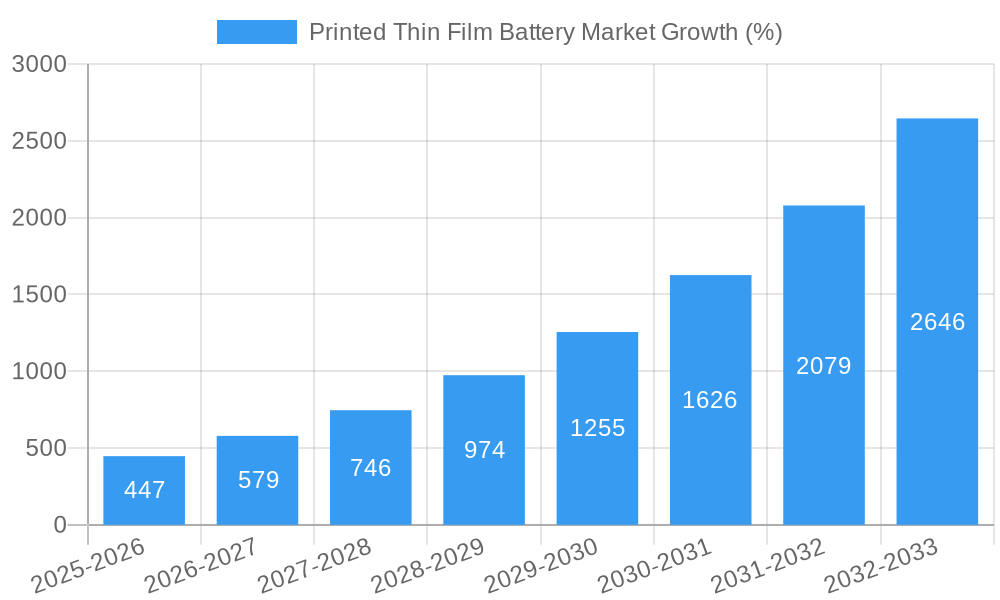
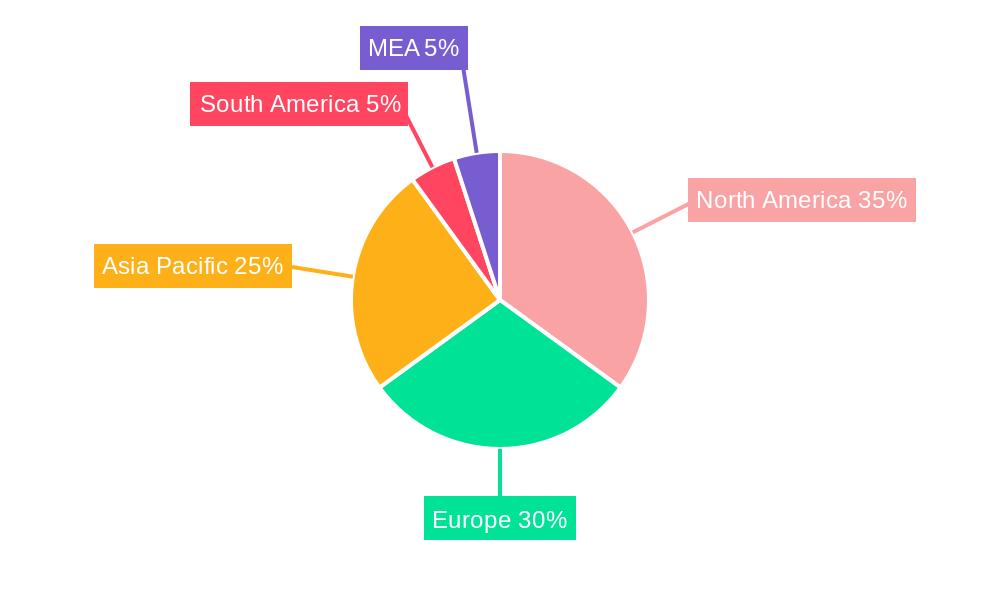
The printed thin film battery market is experiencing robust growth, projected to reach a substantial market size with a Compound Annual Growth Rate (CAGR) of 29.70% from 2025 to 2033. This expansion is fueled by several key drivers. The increasing demand for flexible and lightweight power sources in consumer electronics, particularly wearable technology and smart packaging, is a major catalyst. Furthermore, the burgeoning energy harvesting sector, seeking efficient and integrated power solutions, significantly contributes to market growth. Advancements in materials science and printing technologies are enabling the production of higher-capacity, longer-lasting, and more cost-effective thin film batteries, further bolstering market expansion. While challenges such as limited energy density compared to traditional batteries and scalability concerns exist, ongoing research and development efforts are actively addressing these limitations. The market segmentation by application (consumer electronics, energy harvesting, wearable technology, etc.) and chargeability (rechargeable, non-rechargeable) highlights diverse application opportunities and technological developments influencing the market trajectory. Regional analysis reveals strong growth across North America, Europe, and Asia-Pacific, driven by technological advancements and increasing adoption across various sectors.
The competitive landscape features a mix of established players and emerging companies, fostering innovation and driving market competitiveness. Companies like Excellatron Solid State LLC, Blue Spark Technologies Inc., and others are actively contributing to the growth of this dynamic market through their research, development, and commercialization efforts. The forecast period (2025-2033) suggests a continued upward trend, driven by sustained technological advancements, increasing consumer demand for miniaturized and flexible electronics, and the expanding adoption of thin-film batteries in diverse applications across various industries. The market's trajectory is heavily influenced by the continued development of more energy-dense and cost-effective thin-film battery technologies, coupled with the integration of these batteries into increasingly sophisticated electronic devices. Addressing scalability and manufacturing challenges will remain crucial for maximizing market potential in the coming years.
Printed Thin Film Battery Market: A Comprehensive Report (2019-2033)
This comprehensive report provides an in-depth analysis of the Printed Thin Film Battery market, offering valuable insights for stakeholders across the value chain. Covering the period 2019-2033, with a focus on 2025, this research delves into market dynamics, industry trends, leading players, and future growth opportunities. Maximize your understanding of this rapidly evolving sector with data-driven analysis and actionable recommendations.
Printed Thin Film Battery Market Market Dynamics & Concentration
The Printed Thin Film Battery market is experiencing significant dynamism, driven by innovation, evolving regulatory landscapes, and increasing demand from diverse end-user sectors. Market concentration is currently moderate, with several key players vying for market share. However, the landscape is expected to evolve with further consolidation through mergers and acquisitions (M&A). The study period (2019-2024) witnessed approximately xx M&A deals, contributing to an estimated xx% increase in market concentration. Key innovation drivers include advancements in materials science, leading to improved energy density and lifespan. Furthermore, stringent environmental regulations are pushing the adoption of sustainable battery technologies, benefiting printed thin film batteries. The presence of substitute technologies, such as traditional lithium-ion batteries, poses a challenge, necessitating continuous innovation to maintain competitiveness. End-user trends show a rising preference for flexible, lightweight, and cost-effective energy solutions, aligning perfectly with the advantages of printed thin film batteries.
- Market Share: The top five players currently hold an estimated xx% of the market share.
- M&A Activity: The number of M&A deals is projected to increase by xx% during the forecast period (2025-2033).
- Innovation Drivers: Advancements in materials science, printing techniques, and energy storage capabilities are key drivers.
- Regulatory Framework: Government initiatives promoting sustainable energy and electronics manufacturing are driving market growth.
Printed Thin Film Battery Market Industry Trends & Analysis
The Printed Thin Film Battery market is projected to witness robust growth, with a Compound Annual Growth Rate (CAGR) of xx% during the forecast period (2025-2033). This growth is primarily fueled by the increasing demand for flexible and lightweight energy storage solutions in various applications, such as consumer electronics and wearable technology. Technological disruptions, particularly in printing techniques and material science, are enhancing battery performance and reducing manufacturing costs. Consumer preferences are shifting towards eco-friendly and sustainable products, further boosting the adoption of printed thin film batteries. Competitive dynamics are intense, with established players and new entrants vying for market share through product innovation and strategic partnerships. Market penetration is expected to reach xx% by 2033, indicating significant growth potential.
Leading Markets & Segments in Printed Thin Film Battery Market
The consumer electronics segment is currently the dominant application area for printed thin film batteries, accounting for approximately xx% of the market in 2025. This is driven by the increasing demand for portable and flexible electronic devices. The rechargeable segment dominates the market by chargeability type, with an estimated xx% share in 2025.
Key Drivers for Consumer Electronics:
- Growing demand for flexible and wearable electronics.
- Cost-effectiveness compared to traditional batteries.
- Advancements in printing technology enabling mass production.
Key Drivers for Rechargeable segment:
- Increasing demand for reusable energy storage solutions.
- Improved charging cycles and longer lifespan compared to non-rechargeable counterparts.
Dominance Analysis: The Asia-Pacific region is projected to be the leading market due to the high concentration of electronics manufacturing and supportive government policies. Specifically, China and South Korea are expected to experience significant growth due to their established electronic manufacturing hubs and government initiatives promoting innovation in energy storage technologies.
Printed Thin Film Battery Market Product Developments
Recent product developments have focused on enhancing energy density, improving cycle life, and broadening the range of applications. Innovations in materials science, such as the use of advanced electrode materials and electrolytes, are leading to significant improvements in battery performance. New printing techniques are also being developed to improve manufacturing efficiency and reduce costs. These developments are enabling the integration of printed thin film batteries into a wider range of products, from smart packaging to medical devices, enhancing their market fit and competitive advantage.
Key Drivers of Printed Thin Film Battery Market Growth
The growth of the printed thin film battery market is primarily driven by several factors: The increasing demand for flexible and wearable electronics, coupled with advancements in materials science and printing technologies leading to improved battery performance and reduced production costs. Government initiatives promoting the adoption of sustainable energy solutions further accelerate market growth.
Challenges in the Printed Thin Film Battery Market Market
The market faces challenges, including the relatively high cost of production compared to traditional batteries, inconsistencies in battery performance, and potential safety concerns. Supply chain disruptions can impact production, and intense competition from established battery manufacturers could hinder market penetration. These factors, while not insurmountable, require continuous technological advancement and strategic planning for sustainable growth.
Emerging Opportunities in Printed Thin Film Battery Market
Significant opportunities exist in expanding into new applications like smart packaging and medical devices, further technological breakthroughs like solid-state batteries which enhance performance and safety. Strategic partnerships between battery manufacturers and end-product companies can accelerate market penetration. Market expansion into developing economies with high growth potential in consumer electronics further drives opportunities.
Leading Players in the Printed Thin Film Battery Market Sector
- Excellatron Solid State LLC
- Blue Spark Technologies Inc
- Imprint Energy Inc
- Flexel LLC
- STMicroelectronics
- Ilika Plc
- NEC Energy Solutions Inc
- Jiangsu Enfucell Flexible Electronics Co Ltd
- Jenax Inc
- Protoflex Corporation
- Brightvolt Inc
- Enfucell OY Ltd
- Printed Energy Pty Ltd
- Panasonic Corporation
- Cymbet Corporation Inc
Key Milestones in Printed Thin Film Battery Market Industry
- 2020: Several key players announced significant investments in R&D for next-generation printed thin film batteries.
- 2022: Launch of the first commercially viable printed thin film battery for wearable applications.
- 2023: Successful completion of a major M&A deal consolidating the industry.
Strategic Outlook for Printed Thin Film Battery Market Market
The future of the Printed Thin Film Battery market is bright, with significant growth potential driven by technological advancements, expanding applications, and increasing demand for sustainable energy solutions. Strategic partnerships, focusing on innovation and expanding into new market segments, will be crucial for companies to capitalize on this growth. The market is poised for continued expansion and innovation, offering compelling opportunities for both established players and new entrants.
Printed Thin Film Battery Market Segmentation
-
1. Application
- 1.1. Consumer Electronics
- 1.2. Energy Harvesting
- 1.3. Wearable Technology
- 1.4. Smart Packaging
- 1.5. Pharmaceutical & Medical Devices
- 1.6. Smart Cards
- 1.7. Other Applications
-
2. Chargeability
- 2.1. Rechargeable
- 2.2. Non-rechargeable
Printed Thin Film Battery Market Segmentation By Geography
- 1. North America
- 2. Europe
- 3. Asia Pacific
- 4. Rest of the World
Printed Thin Film Battery Market REPORT HIGHLIGHTS
| Aspects | Details |
|---|---|
| Study Period | 2019-2033 |
| Base Year | 2024 |
| Estimated Year | 2025 |
| Forecast Period | 2025-2033 |
| Historical Period | 2019-2024 |
| Growth Rate | CAGR of 29.70% from 2019-2033 |
| Segmentation |
|
Table of Contents
- 1. Introduction
- 1.1. Research Scope
- 1.2. Market Segmentation
- 1.3. Research Methodology
- 1.4. Definitions and Assumptions
- 2. Executive Summary
- 2.1. Introduction
- 3. Market Dynamics
- 3.1. Introduction
- 3.2. Market Drivers
- 3.2.1 ; Growing Demand for Wearable Devices; Emerging Need for Mechanically Flexible
- 3.2.2 Lightweight
- 3.2.3 and Cost-effective Products; Increased Requirement for Thin Film and Printed Battery Solutions in Healthcare Industry
- 3.3. Market Restrains
- 3.3.1. ; Lack of Standardization in the Development of Thin Film and Printed Batteries; High Capital Requirement for R&D and Infrastructure
- 3.4. Market Trends
- 3.4.1. Wearable Technology Application Segment to Drive the Market
- 4. Market Factor Analysis
- 4.1. Porters Five Forces
- 4.2. Supply/Value Chain
- 4.3. PESTEL analysis
- 4.4. Market Entropy
- 4.5. Patent/Trademark Analysis
- 5. Global Printed Thin Film Battery Market Analysis, Insights and Forecast, 2019-2031
- 5.1. Market Analysis, Insights and Forecast - by Application
- 5.1.1. Consumer Electronics
- 5.1.2. Energy Harvesting
- 5.1.3. Wearable Technology
- 5.1.4. Smart Packaging
- 5.1.5. Pharmaceutical & Medical Devices
- 5.1.6. Smart Cards
- 5.1.7. Other Applications
- 5.2. Market Analysis, Insights and Forecast - by Chargeability
- 5.2.1. Rechargeable
- 5.2.2. Non-rechargeable
- 5.3. Market Analysis, Insights and Forecast - by Region
- 5.3.1. North America
- 5.3.2. Europe
- 5.3.3. Asia Pacific
- 5.3.4. Rest of the World
- 5.1. Market Analysis, Insights and Forecast - by Application
- 6. North America Printed Thin Film Battery Market Analysis, Insights and Forecast, 2019-2031
- 6.1. Market Analysis, Insights and Forecast - by Application
- 6.1.1. Consumer Electronics
- 6.1.2. Energy Harvesting
- 6.1.3. Wearable Technology
- 6.1.4. Smart Packaging
- 6.1.5. Pharmaceutical & Medical Devices
- 6.1.6. Smart Cards
- 6.1.7. Other Applications
- 6.2. Market Analysis, Insights and Forecast - by Chargeability
- 6.2.1. Rechargeable
- 6.2.2. Non-rechargeable
- 6.1. Market Analysis, Insights and Forecast - by Application
- 7. Europe Printed Thin Film Battery Market Analysis, Insights and Forecast, 2019-2031
- 7.1. Market Analysis, Insights and Forecast - by Application
- 7.1.1. Consumer Electronics
- 7.1.2. Energy Harvesting
- 7.1.3. Wearable Technology
- 7.1.4. Smart Packaging
- 7.1.5. Pharmaceutical & Medical Devices
- 7.1.6. Smart Cards
- 7.1.7. Other Applications
- 7.2. Market Analysis, Insights and Forecast - by Chargeability
- 7.2.1. Rechargeable
- 7.2.2. Non-rechargeable
- 7.1. Market Analysis, Insights and Forecast - by Application
- 8. Asia Pacific Printed Thin Film Battery Market Analysis, Insights and Forecast, 2019-2031
- 8.1. Market Analysis, Insights and Forecast - by Application
- 8.1.1. Consumer Electronics
- 8.1.2. Energy Harvesting
- 8.1.3. Wearable Technology
- 8.1.4. Smart Packaging
- 8.1.5. Pharmaceutical & Medical Devices
- 8.1.6. Smart Cards
- 8.1.7. Other Applications
- 8.2. Market Analysis, Insights and Forecast - by Chargeability
- 8.2.1. Rechargeable
- 8.2.2. Non-rechargeable
- 8.1. Market Analysis, Insights and Forecast - by Application
- 9. Rest of the World Printed Thin Film Battery Market Analysis, Insights and Forecast, 2019-2031
- 9.1. Market Analysis, Insights and Forecast - by Application
- 9.1.1. Consumer Electronics
- 9.1.2. Energy Harvesting
- 9.1.3. Wearable Technology
- 9.1.4. Smart Packaging
- 9.1.5. Pharmaceutical & Medical Devices
- 9.1.6. Smart Cards
- 9.1.7. Other Applications
- 9.2. Market Analysis, Insights and Forecast - by Chargeability
- 9.2.1. Rechargeable
- 9.2.2. Non-rechargeable
- 9.1. Market Analysis, Insights and Forecast - by Application
- 10. North America Printed Thin Film Battery Market Analysis, Insights and Forecast, 2019-2031
- 10.1. Market Analysis, Insights and Forecast - By Country/Sub-region
- 10.1.1 United States
- 10.1.2 Canada
- 10.1.3 Mexico
- 11. Europe Printed Thin Film Battery Market Analysis, Insights and Forecast, 2019-2031
- 11.1. Market Analysis, Insights and Forecast - By Country/Sub-region
- 11.1.1 Germany
- 11.1.2 United Kingdom
- 11.1.3 France
- 11.1.4 Spain
- 11.1.5 Italy
- 11.1.6 Spain
- 11.1.7 Belgium
- 11.1.8 Netherland
- 11.1.9 Nordics
- 11.1.10 Rest of Europe
- 12. Asia Pacific Printed Thin Film Battery Market Analysis, Insights and Forecast, 2019-2031
- 12.1. Market Analysis, Insights and Forecast - By Country/Sub-region
- 12.1.1 China
- 12.1.2 Japan
- 12.1.3 India
- 12.1.4 South Korea
- 12.1.5 Southeast Asia
- 12.1.6 Australia
- 12.1.7 Indonesia
- 12.1.8 Phillipes
- 12.1.9 Singapore
- 12.1.10 Thailandc
- 12.1.11 Rest of Asia Pacific
- 13. South America Printed Thin Film Battery Market Analysis, Insights and Forecast, 2019-2031
- 13.1. Market Analysis, Insights and Forecast - By Country/Sub-region
- 13.1.1 Brazil
- 13.1.2 Argentina
- 13.1.3 Peru
- 13.1.4 Chile
- 13.1.5 Colombia
- 13.1.6 Ecuador
- 13.1.7 Venezuela
- 13.1.8 Rest of South America
- 14. North America Printed Thin Film Battery Market Analysis, Insights and Forecast, 2019-2031
- 14.1. Market Analysis, Insights and Forecast - By Country/Sub-region
- 14.1.1 United States
- 14.1.2 Canada
- 14.1.3 Mexico
- 15. MEA Printed Thin Film Battery Market Analysis, Insights and Forecast, 2019-2031
- 15.1. Market Analysis, Insights and Forecast - By Country/Sub-region
- 15.1.1 United Arab Emirates
- 15.1.2 Saudi Arabia
- 15.1.3 South Africa
- 15.1.4 Rest of Middle East and Africa
- 16. Competitive Analysis
- 16.1. Global Market Share Analysis 2024
- 16.2. Company Profiles
- 16.2.1 Excellatron Solid State LLC
- 16.2.1.1. Overview
- 16.2.1.2. Products
- 16.2.1.3. SWOT Analysis
- 16.2.1.4. Recent Developments
- 16.2.1.5. Financials (Based on Availability)
- 16.2.2 Blue Spark Technologies Inc
- 16.2.2.1. Overview
- 16.2.2.2. Products
- 16.2.2.3. SWOT Analysis
- 16.2.2.4. Recent Developments
- 16.2.2.5. Financials (Based on Availability)
- 16.2.3 Imprint Energy Inc
- 16.2.3.1. Overview
- 16.2.3.2. Products
- 16.2.3.3. SWOT Analysis
- 16.2.3.4. Recent Developments
- 16.2.3.5. Financials (Based on Availability)
- 16.2.4 Flexel LLC
- 16.2.4.1. Overview
- 16.2.4.2. Products
- 16.2.4.3. SWOT Analysis
- 16.2.4.4. Recent Developments
- 16.2.4.5. Financials (Based on Availability)
- 16.2.5 STMicroelectronics
- 16.2.5.1. Overview
- 16.2.5.2. Products
- 16.2.5.3. SWOT Analysis
- 16.2.5.4. Recent Developments
- 16.2.5.5. Financials (Based on Availability)
- 16.2.6 Ilika Plc
- 16.2.6.1. Overview
- 16.2.6.2. Products
- 16.2.6.3. SWOT Analysis
- 16.2.6.4. Recent Developments
- 16.2.6.5. Financials (Based on Availability)
- 16.2.7 NEC Energy Solutions Inc
- 16.2.7.1. Overview
- 16.2.7.2. Products
- 16.2.7.3. SWOT Analysis
- 16.2.7.4. Recent Developments
- 16.2.7.5. Financials (Based on Availability)
- 16.2.8 Jiangsu Enfucell Flexible Electronics Co Ltd
- 16.2.8.1. Overview
- 16.2.8.2. Products
- 16.2.8.3. SWOT Analysis
- 16.2.8.4. Recent Developments
- 16.2.8.5. Financials (Based on Availability)
- 16.2.9 Jenax Inc
- 16.2.9.1. Overview
- 16.2.9.2. Products
- 16.2.9.3. SWOT Analysis
- 16.2.9.4. Recent Developments
- 16.2.9.5. Financials (Based on Availability)
- 16.2.10 Protoflex Corporatio
- 16.2.10.1. Overview
- 16.2.10.2. Products
- 16.2.10.3. SWOT Analysis
- 16.2.10.4. Recent Developments
- 16.2.10.5. Financials (Based on Availability)
- 16.2.11 Brightvolt Inc
- 16.2.11.1. Overview
- 16.2.11.2. Products
- 16.2.11.3. SWOT Analysis
- 16.2.11.4. Recent Developments
- 16.2.11.5. Financials (Based on Availability)
- 16.2.12 Enfucell OY Ltd
- 16.2.12.1. Overview
- 16.2.12.2. Products
- 16.2.12.3. SWOT Analysis
- 16.2.12.4. Recent Developments
- 16.2.12.5. Financials (Based on Availability)
- 16.2.13 Printed Energy Pty Ltd
- 16.2.13.1. Overview
- 16.2.13.2. Products
- 16.2.13.3. SWOT Analysis
- 16.2.13.4. Recent Developments
- 16.2.13.5. Financials (Based on Availability)
- 16.2.14 Panasonic Corporation
- 16.2.14.1. Overview
- 16.2.14.2. Products
- 16.2.14.3. SWOT Analysis
- 16.2.14.4. Recent Developments
- 16.2.14.5. Financials (Based on Availability)
- 16.2.15 Cymbet Corporation Inc
- 16.2.15.1. Overview
- 16.2.15.2. Products
- 16.2.15.3. SWOT Analysis
- 16.2.15.4. Recent Developments
- 16.2.15.5. Financials (Based on Availability)
- 16.2.1 Excellatron Solid State LLC
List of Figures
- Figure 1: Global Printed Thin Film Battery Market Revenue Breakdown (Million, %) by Region 2024 & 2032
- Figure 2: Global Printed Thin Film Battery Market Volume Breakdown (K Unit, %) by Region 2024 & 2032
- Figure 3: North America Printed Thin Film Battery Market Revenue (Million), by Country 2024 & 2032
- Figure 4: North America Printed Thin Film Battery Market Volume (K Unit), by Country 2024 & 2032
- Figure 5: North America Printed Thin Film Battery Market Revenue Share (%), by Country 2024 & 2032
- Figure 6: North America Printed Thin Film Battery Market Volume Share (%), by Country 2024 & 2032
- Figure 7: Europe Printed Thin Film Battery Market Revenue (Million), by Country 2024 & 2032
- Figure 8: Europe Printed Thin Film Battery Market Volume (K Unit), by Country 2024 & 2032
- Figure 9: Europe Printed Thin Film Battery Market Revenue Share (%), by Country 2024 & 2032
- Figure 10: Europe Printed Thin Film Battery Market Volume Share (%), by Country 2024 & 2032
- Figure 11: Asia Pacific Printed Thin Film Battery Market Revenue (Million), by Country 2024 & 2032
- Figure 12: Asia Pacific Printed Thin Film Battery Market Volume (K Unit), by Country 2024 & 2032
- Figure 13: Asia Pacific Printed Thin Film Battery Market Revenue Share (%), by Country 2024 & 2032
- Figure 14: Asia Pacific Printed Thin Film Battery Market Volume Share (%), by Country 2024 & 2032
- Figure 15: South America Printed Thin Film Battery Market Revenue (Million), by Country 2024 & 2032
- Figure 16: South America Printed Thin Film Battery Market Volume (K Unit), by Country 2024 & 2032
- Figure 17: South America Printed Thin Film Battery Market Revenue Share (%), by Country 2024 & 2032
- Figure 18: South America Printed Thin Film Battery Market Volume Share (%), by Country 2024 & 2032
- Figure 19: North America Printed Thin Film Battery Market Revenue (Million), by Country 2024 & 2032
- Figure 20: North America Printed Thin Film Battery Market Volume (K Unit), by Country 2024 & 2032
- Figure 21: North America Printed Thin Film Battery Market Revenue Share (%), by Country 2024 & 2032
- Figure 22: North America Printed Thin Film Battery Market Volume Share (%), by Country 2024 & 2032
- Figure 23: MEA Printed Thin Film Battery Market Revenue (Million), by Country 2024 & 2032
- Figure 24: MEA Printed Thin Film Battery Market Volume (K Unit), by Country 2024 & 2032
- Figure 25: MEA Printed Thin Film Battery Market Revenue Share (%), by Country 2024 & 2032
- Figure 26: MEA Printed Thin Film Battery Market Volume Share (%), by Country 2024 & 2032
- Figure 27: North America Printed Thin Film Battery Market Revenue (Million), by Application 2024 & 2032
- Figure 28: North America Printed Thin Film Battery Market Volume (K Unit), by Application 2024 & 2032
- Figure 29: North America Printed Thin Film Battery Market Revenue Share (%), by Application 2024 & 2032
- Figure 30: North America Printed Thin Film Battery Market Volume Share (%), by Application 2024 & 2032
- Figure 31: North America Printed Thin Film Battery Market Revenue (Million), by Chargeability 2024 & 2032
- Figure 32: North America Printed Thin Film Battery Market Volume (K Unit), by Chargeability 2024 & 2032
- Figure 33: North America Printed Thin Film Battery Market Revenue Share (%), by Chargeability 2024 & 2032
- Figure 34: North America Printed Thin Film Battery Market Volume Share (%), by Chargeability 2024 & 2032
- Figure 35: North America Printed Thin Film Battery Market Revenue (Million), by Country 2024 & 2032
- Figure 36: North America Printed Thin Film Battery Market Volume (K Unit), by Country 2024 & 2032
- Figure 37: North America Printed Thin Film Battery Market Revenue Share (%), by Country 2024 & 2032
- Figure 38: North America Printed Thin Film Battery Market Volume Share (%), by Country 2024 & 2032
- Figure 39: Europe Printed Thin Film Battery Market Revenue (Million), by Application 2024 & 2032
- Figure 40: Europe Printed Thin Film Battery Market Volume (K Unit), by Application 2024 & 2032
- Figure 41: Europe Printed Thin Film Battery Market Revenue Share (%), by Application 2024 & 2032
- Figure 42: Europe Printed Thin Film Battery Market Volume Share (%), by Application 2024 & 2032
- Figure 43: Europe Printed Thin Film Battery Market Revenue (Million), by Chargeability 2024 & 2032
- Figure 44: Europe Printed Thin Film Battery Market Volume (K Unit), by Chargeability 2024 & 2032
- Figure 45: Europe Printed Thin Film Battery Market Revenue Share (%), by Chargeability 2024 & 2032
- Figure 46: Europe Printed Thin Film Battery Market Volume Share (%), by Chargeability 2024 & 2032
- Figure 47: Europe Printed Thin Film Battery Market Revenue (Million), by Country 2024 & 2032
- Figure 48: Europe Printed Thin Film Battery Market Volume (K Unit), by Country 2024 & 2032
- Figure 49: Europe Printed Thin Film Battery Market Revenue Share (%), by Country 2024 & 2032
- Figure 50: Europe Printed Thin Film Battery Market Volume Share (%), by Country 2024 & 2032
- Figure 51: Asia Pacific Printed Thin Film Battery Market Revenue (Million), by Application 2024 & 2032
- Figure 52: Asia Pacific Printed Thin Film Battery Market Volume (K Unit), by Application 2024 & 2032
- Figure 53: Asia Pacific Printed Thin Film Battery Market Revenue Share (%), by Application 2024 & 2032
- Figure 54: Asia Pacific Printed Thin Film Battery Market Volume Share (%), by Application 2024 & 2032
- Figure 55: Asia Pacific Printed Thin Film Battery Market Revenue (Million), by Chargeability 2024 & 2032
- Figure 56: Asia Pacific Printed Thin Film Battery Market Volume (K Unit), by Chargeability 2024 & 2032
- Figure 57: Asia Pacific Printed Thin Film Battery Market Revenue Share (%), by Chargeability 2024 & 2032
- Figure 58: Asia Pacific Printed Thin Film Battery Market Volume Share (%), by Chargeability 2024 & 2032
- Figure 59: Asia Pacific Printed Thin Film Battery Market Revenue (Million), by Country 2024 & 2032
- Figure 60: Asia Pacific Printed Thin Film Battery Market Volume (K Unit), by Country 2024 & 2032
- Figure 61: Asia Pacific Printed Thin Film Battery Market Revenue Share (%), by Country 2024 & 2032
- Figure 62: Asia Pacific Printed Thin Film Battery Market Volume Share (%), by Country 2024 & 2032
- Figure 63: Rest of the World Printed Thin Film Battery Market Revenue (Million), by Application 2024 & 2032
- Figure 64: Rest of the World Printed Thin Film Battery Market Volume (K Unit), by Application 2024 & 2032
- Figure 65: Rest of the World Printed Thin Film Battery Market Revenue Share (%), by Application 2024 & 2032
- Figure 66: Rest of the World Printed Thin Film Battery Market Volume Share (%), by Application 2024 & 2032
- Figure 67: Rest of the World Printed Thin Film Battery Market Revenue (Million), by Chargeability 2024 & 2032
- Figure 68: Rest of the World Printed Thin Film Battery Market Volume (K Unit), by Chargeability 2024 & 2032
- Figure 69: Rest of the World Printed Thin Film Battery Market Revenue Share (%), by Chargeability 2024 & 2032
- Figure 70: Rest of the World Printed Thin Film Battery Market Volume Share (%), by Chargeability 2024 & 2032
- Figure 71: Rest of the World Printed Thin Film Battery Market Revenue (Million), by Country 2024 & 2032
- Figure 72: Rest of the World Printed Thin Film Battery Market Volume (K Unit), by Country 2024 & 2032
- Figure 73: Rest of the World Printed Thin Film Battery Market Revenue Share (%), by Country 2024 & 2032
- Figure 74: Rest of the World Printed Thin Film Battery Market Volume Share (%), by Country 2024 & 2032
List of Tables
- Table 1: Global Printed Thin Film Battery Market Revenue Million Forecast, by Region 2019 & 2032
- Table 2: Global Printed Thin Film Battery Market Volume K Unit Forecast, by Region 2019 & 2032
- Table 3: Global Printed Thin Film Battery Market Revenue Million Forecast, by Application 2019 & 2032
- Table 4: Global Printed Thin Film Battery Market Volume K Unit Forecast, by Application 2019 & 2032
- Table 5: Global Printed Thin Film Battery Market Revenue Million Forecast, by Chargeability 2019 & 2032
- Table 6: Global Printed Thin Film Battery Market Volume K Unit Forecast, by Chargeability 2019 & 2032
- Table 7: Global Printed Thin Film Battery Market Revenue Million Forecast, by Region 2019 & 2032
- Table 8: Global Printed Thin Film Battery Market Volume K Unit Forecast, by Region 2019 & 2032
- Table 9: Global Printed Thin Film Battery Market Revenue Million Forecast, by Country 2019 & 2032
- Table 10: Global Printed Thin Film Battery Market Volume K Unit Forecast, by Country 2019 & 2032
- Table 11: United States Printed Thin Film Battery Market Revenue (Million) Forecast, by Application 2019 & 2032
- Table 12: United States Printed Thin Film Battery Market Volume (K Unit) Forecast, by Application 2019 & 2032
- Table 13: Canada Printed Thin Film Battery Market Revenue (Million) Forecast, by Application 2019 & 2032
- Table 14: Canada Printed Thin Film Battery Market Volume (K Unit) Forecast, by Application 2019 & 2032
- Table 15: Mexico Printed Thin Film Battery Market Revenue (Million) Forecast, by Application 2019 & 2032
- Table 16: Mexico Printed Thin Film Battery Market Volume (K Unit) Forecast, by Application 2019 & 2032
- Table 17: Global Printed Thin Film Battery Market Revenue Million Forecast, by Country 2019 & 2032
- Table 18: Global Printed Thin Film Battery Market Volume K Unit Forecast, by Country 2019 & 2032
- Table 19: Germany Printed Thin Film Battery Market Revenue (Million) Forecast, by Application 2019 & 2032
- Table 20: Germany Printed Thin Film Battery Market Volume (K Unit) Forecast, by Application 2019 & 2032
- Table 21: United Kingdom Printed Thin Film Battery Market Revenue (Million) Forecast, by Application 2019 & 2032
- Table 22: United Kingdom Printed Thin Film Battery Market Volume (K Unit) Forecast, by Application 2019 & 2032
- Table 23: France Printed Thin Film Battery Market Revenue (Million) Forecast, by Application 2019 & 2032
- Table 24: France Printed Thin Film Battery Market Volume (K Unit) Forecast, by Application 2019 & 2032
- Table 25: Spain Printed Thin Film Battery Market Revenue (Million) Forecast, by Application 2019 & 2032
- Table 26: Spain Printed Thin Film Battery Market Volume (K Unit) Forecast, by Application 2019 & 2032
- Table 27: Italy Printed Thin Film Battery Market Revenue (Million) Forecast, by Application 2019 & 2032
- Table 28: Italy Printed Thin Film Battery Market Volume (K Unit) Forecast, by Application 2019 & 2032
- Table 29: Spain Printed Thin Film Battery Market Revenue (Million) Forecast, by Application 2019 & 2032
- Table 30: Spain Printed Thin Film Battery Market Volume (K Unit) Forecast, by Application 2019 & 2032
- Table 31: Belgium Printed Thin Film Battery Market Revenue (Million) Forecast, by Application 2019 & 2032
- Table 32: Belgium Printed Thin Film Battery Market Volume (K Unit) Forecast, by Application 2019 & 2032
- Table 33: Netherland Printed Thin Film Battery Market Revenue (Million) Forecast, by Application 2019 & 2032
- Table 34: Netherland Printed Thin Film Battery Market Volume (K Unit) Forecast, by Application 2019 & 2032
- Table 35: Nordics Printed Thin Film Battery Market Revenue (Million) Forecast, by Application 2019 & 2032
- Table 36: Nordics Printed Thin Film Battery Market Volume (K Unit) Forecast, by Application 2019 & 2032
- Table 37: Rest of Europe Printed Thin Film Battery Market Revenue (Million) Forecast, by Application 2019 & 2032
- Table 38: Rest of Europe Printed Thin Film Battery Market Volume (K Unit) Forecast, by Application 2019 & 2032
- Table 39: Global Printed Thin Film Battery Market Revenue Million Forecast, by Country 2019 & 2032
- Table 40: Global Printed Thin Film Battery Market Volume K Unit Forecast, by Country 2019 & 2032
- Table 41: China Printed Thin Film Battery Market Revenue (Million) Forecast, by Application 2019 & 2032
- Table 42: China Printed Thin Film Battery Market Volume (K Unit) Forecast, by Application 2019 & 2032
- Table 43: Japan Printed Thin Film Battery Market Revenue (Million) Forecast, by Application 2019 & 2032
- Table 44: Japan Printed Thin Film Battery Market Volume (K Unit) Forecast, by Application 2019 & 2032
- Table 45: India Printed Thin Film Battery Market Revenue (Million) Forecast, by Application 2019 & 2032
- Table 46: India Printed Thin Film Battery Market Volume (K Unit) Forecast, by Application 2019 & 2032
- Table 47: South Korea Printed Thin Film Battery Market Revenue (Million) Forecast, by Application 2019 & 2032
- Table 48: South Korea Printed Thin Film Battery Market Volume (K Unit) Forecast, by Application 2019 & 2032
- Table 49: Southeast Asia Printed Thin Film Battery Market Revenue (Million) Forecast, by Application 2019 & 2032
- Table 50: Southeast Asia Printed Thin Film Battery Market Volume (K Unit) Forecast, by Application 2019 & 2032
- Table 51: Australia Printed Thin Film Battery Market Revenue (Million) Forecast, by Application 2019 & 2032
- Table 52: Australia Printed Thin Film Battery Market Volume (K Unit) Forecast, by Application 2019 & 2032
- Table 53: Indonesia Printed Thin Film Battery Market Revenue (Million) Forecast, by Application 2019 & 2032
- Table 54: Indonesia Printed Thin Film Battery Market Volume (K Unit) Forecast, by Application 2019 & 2032
- Table 55: Phillipes Printed Thin Film Battery Market Revenue (Million) Forecast, by Application 2019 & 2032
- Table 56: Phillipes Printed Thin Film Battery Market Volume (K Unit) Forecast, by Application 2019 & 2032
- Table 57: Singapore Printed Thin Film Battery Market Revenue (Million) Forecast, by Application 2019 & 2032
- Table 58: Singapore Printed Thin Film Battery Market Volume (K Unit) Forecast, by Application 2019 & 2032
- Table 59: Thailandc Printed Thin Film Battery Market Revenue (Million) Forecast, by Application 2019 & 2032
- Table 60: Thailandc Printed Thin Film Battery Market Volume (K Unit) Forecast, by Application 2019 & 2032
- Table 61: Rest of Asia Pacific Printed Thin Film Battery Market Revenue (Million) Forecast, by Application 2019 & 2032
- Table 62: Rest of Asia Pacific Printed Thin Film Battery Market Volume (K Unit) Forecast, by Application 2019 & 2032
- Table 63: Global Printed Thin Film Battery Market Revenue Million Forecast, by Country 2019 & 2032
- Table 64: Global Printed Thin Film Battery Market Volume K Unit Forecast, by Country 2019 & 2032
- Table 65: Brazil Printed Thin Film Battery Market Revenue (Million) Forecast, by Application 2019 & 2032
- Table 66: Brazil Printed Thin Film Battery Market Volume (K Unit) Forecast, by Application 2019 & 2032
- Table 67: Argentina Printed Thin Film Battery Market Revenue (Million) Forecast, by Application 2019 & 2032
- Table 68: Argentina Printed Thin Film Battery Market Volume (K Unit) Forecast, by Application 2019 & 2032
- Table 69: Peru Printed Thin Film Battery Market Revenue (Million) Forecast, by Application 2019 & 2032
- Table 70: Peru Printed Thin Film Battery Market Volume (K Unit) Forecast, by Application 2019 & 2032
- Table 71: Chile Printed Thin Film Battery Market Revenue (Million) Forecast, by Application 2019 & 2032
- Table 72: Chile Printed Thin Film Battery Market Volume (K Unit) Forecast, by Application 2019 & 2032
- Table 73: Colombia Printed Thin Film Battery Market Revenue (Million) Forecast, by Application 2019 & 2032
- Table 74: Colombia Printed Thin Film Battery Market Volume (K Unit) Forecast, by Application 2019 & 2032
- Table 75: Ecuador Printed Thin Film Battery Market Revenue (Million) Forecast, by Application 2019 & 2032
- Table 76: Ecuador Printed Thin Film Battery Market Volume (K Unit) Forecast, by Application 2019 & 2032
- Table 77: Venezuela Printed Thin Film Battery Market Revenue (Million) Forecast, by Application 2019 & 2032
- Table 78: Venezuela Printed Thin Film Battery Market Volume (K Unit) Forecast, by Application 2019 & 2032
- Table 79: Rest of South America Printed Thin Film Battery Market Revenue (Million) Forecast, by Application 2019 & 2032
- Table 80: Rest of South America Printed Thin Film Battery Market Volume (K Unit) Forecast, by Application 2019 & 2032
- Table 81: Global Printed Thin Film Battery Market Revenue Million Forecast, by Country 2019 & 2032
- Table 82: Global Printed Thin Film Battery Market Volume K Unit Forecast, by Country 2019 & 2032
- Table 83: United States Printed Thin Film Battery Market Revenue (Million) Forecast, by Application 2019 & 2032
- Table 84: United States Printed Thin Film Battery Market Volume (K Unit) Forecast, by Application 2019 & 2032
- Table 85: Canada Printed Thin Film Battery Market Revenue (Million) Forecast, by Application 2019 & 2032
- Table 86: Canada Printed Thin Film Battery Market Volume (K Unit) Forecast, by Application 2019 & 2032
- Table 87: Mexico Printed Thin Film Battery Market Revenue (Million) Forecast, by Application 2019 & 2032
- Table 88: Mexico Printed Thin Film Battery Market Volume (K Unit) Forecast, by Application 2019 & 2032
- Table 89: Global Printed Thin Film Battery Market Revenue Million Forecast, by Country 2019 & 2032
- Table 90: Global Printed Thin Film Battery Market Volume K Unit Forecast, by Country 2019 & 2032
- Table 91: United Arab Emirates Printed Thin Film Battery Market Revenue (Million) Forecast, by Application 2019 & 2032
- Table 92: United Arab Emirates Printed Thin Film Battery Market Volume (K Unit) Forecast, by Application 2019 & 2032
- Table 93: Saudi Arabia Printed Thin Film Battery Market Revenue (Million) Forecast, by Application 2019 & 2032
- Table 94: Saudi Arabia Printed Thin Film Battery Market Volume (K Unit) Forecast, by Application 2019 & 2032
- Table 95: South Africa Printed Thin Film Battery Market Revenue (Million) Forecast, by Application 2019 & 2032
- Table 96: South Africa Printed Thin Film Battery Market Volume (K Unit) Forecast, by Application 2019 & 2032
- Table 97: Rest of Middle East and Africa Printed Thin Film Battery Market Revenue (Million) Forecast, by Application 2019 & 2032
- Table 98: Rest of Middle East and Africa Printed Thin Film Battery Market Volume (K Unit) Forecast, by Application 2019 & 2032
- Table 99: Global Printed Thin Film Battery Market Revenue Million Forecast, by Application 2019 & 2032
- Table 100: Global Printed Thin Film Battery Market Volume K Unit Forecast, by Application 2019 & 2032
- Table 101: Global Printed Thin Film Battery Market Revenue Million Forecast, by Chargeability 2019 & 2032
- Table 102: Global Printed Thin Film Battery Market Volume K Unit Forecast, by Chargeability 2019 & 2032
- Table 103: Global Printed Thin Film Battery Market Revenue Million Forecast, by Country 2019 & 2032
- Table 104: Global Printed Thin Film Battery Market Volume K Unit Forecast, by Country 2019 & 2032
- Table 105: Global Printed Thin Film Battery Market Revenue Million Forecast, by Application 2019 & 2032
- Table 106: Global Printed Thin Film Battery Market Volume K Unit Forecast, by Application 2019 & 2032
- Table 107: Global Printed Thin Film Battery Market Revenue Million Forecast, by Chargeability 2019 & 2032
- Table 108: Global Printed Thin Film Battery Market Volume K Unit Forecast, by Chargeability 2019 & 2032
- Table 109: Global Printed Thin Film Battery Market Revenue Million Forecast, by Country 2019 & 2032
- Table 110: Global Printed Thin Film Battery Market Volume K Unit Forecast, by Country 2019 & 2032
- Table 111: Global Printed Thin Film Battery Market Revenue Million Forecast, by Application 2019 & 2032
- Table 112: Global Printed Thin Film Battery Market Volume K Unit Forecast, by Application 2019 & 2032
- Table 113: Global Printed Thin Film Battery Market Revenue Million Forecast, by Chargeability 2019 & 2032
- Table 114: Global Printed Thin Film Battery Market Volume K Unit Forecast, by Chargeability 2019 & 2032
- Table 115: Global Printed Thin Film Battery Market Revenue Million Forecast, by Country 2019 & 2032
- Table 116: Global Printed Thin Film Battery Market Volume K Unit Forecast, by Country 2019 & 2032
- Table 117: Global Printed Thin Film Battery Market Revenue Million Forecast, by Application 2019 & 2032
- Table 118: Global Printed Thin Film Battery Market Volume K Unit Forecast, by Application 2019 & 2032
- Table 119: Global Printed Thin Film Battery Market Revenue Million Forecast, by Chargeability 2019 & 2032
- Table 120: Global Printed Thin Film Battery Market Volume K Unit Forecast, by Chargeability 2019 & 2032
- Table 121: Global Printed Thin Film Battery Market Revenue Million Forecast, by Country 2019 & 2032
- Table 122: Global Printed Thin Film Battery Market Volume K Unit Forecast, by Country 2019 & 2032
Frequently Asked Questions
1. What is the projected Compound Annual Growth Rate (CAGR) of the Printed Thin Film Battery Market?
The projected CAGR is approximately 29.70%.
2. Which companies are prominent players in the Printed Thin Film Battery Market?
Key companies in the market include Excellatron Solid State LLC, Blue Spark Technologies Inc, Imprint Energy Inc, Flexel LLC, STMicroelectronics, Ilika Plc, NEC Energy Solutions Inc, Jiangsu Enfucell Flexible Electronics Co Ltd, Jenax Inc, Protoflex Corporatio, Brightvolt Inc, Enfucell OY Ltd, Printed Energy Pty Ltd, Panasonic Corporation, Cymbet Corporation Inc.
3. What are the main segments of the Printed Thin Film Battery Market?
The market segments include Application, Chargeability.
4. Can you provide details about the market size?
The market size is estimated to be USD XX Million as of 2022.
5. What are some drivers contributing to market growth?
; Growing Demand for Wearable Devices; Emerging Need for Mechanically Flexible. Lightweight. and Cost-effective Products; Increased Requirement for Thin Film and Printed Battery Solutions in Healthcare Industry.
6. What are the notable trends driving market growth?
Wearable Technology Application Segment to Drive the Market.
7. Are there any restraints impacting market growth?
; Lack of Standardization in the Development of Thin Film and Printed Batteries; High Capital Requirement for R&D and Infrastructure.
8. Can you provide examples of recent developments in the market?
N/A
9. What pricing options are available for accessing the report?
Pricing options include single-user, multi-user, and enterprise licenses priced at USD 4750, USD 5250, and USD 8750 respectively.
10. Is the market size provided in terms of value or volume?
The market size is provided in terms of value, measured in Million and volume, measured in K Unit.
11. Are there any specific market keywords associated with the report?
Yes, the market keyword associated with the report is "Printed Thin Film Battery Market," which aids in identifying and referencing the specific market segment covered.
12. How do I determine which pricing option suits my needs best?
The pricing options vary based on user requirements and access needs. Individual users may opt for single-user licenses, while businesses requiring broader access may choose multi-user or enterprise licenses for cost-effective access to the report.
13. Are there any additional resources or data provided in the Printed Thin Film Battery Market report?
While the report offers comprehensive insights, it's advisable to review the specific contents or supplementary materials provided to ascertain if additional resources or data are available.
14. How can I stay updated on further developments or reports in the Printed Thin Film Battery Market?
To stay informed about further developments, trends, and reports in the Printed Thin Film Battery Market, consider subscribing to industry newsletters, following relevant companies and organizations, or regularly checking reputable industry news sources and publications.
Methodology
Step 1 - Identification of Relevant Samples Size from Population Database


Step 2 - Approaches for Defining Global Market Size (Value, Volume* & Price*)

Note*: In applicable scenarios
Step 3 - Data Sources
Primary Research
- Web Analytics
- Survey Reports
- Research Institute
- Latest Research Reports
- Opinion Leaders
Secondary Research
- Annual Reports
- White Paper
- Latest Press Release
- Industry Association
- Paid Database
- Investor Presentations

Step 4 - Data Triangulation
Involves using different sources of information in order to increase the validity of a study
These sources are likely to be stakeholders in a program - participants, other researchers, program staff, other community members, and so on.
Then we put all data in single framework & apply various statistical tools to find out the dynamic on the market.
During the analysis stage, feedback from the stakeholder groups would be compared to determine areas of agreement as well as areas of divergence
