

Key Insights
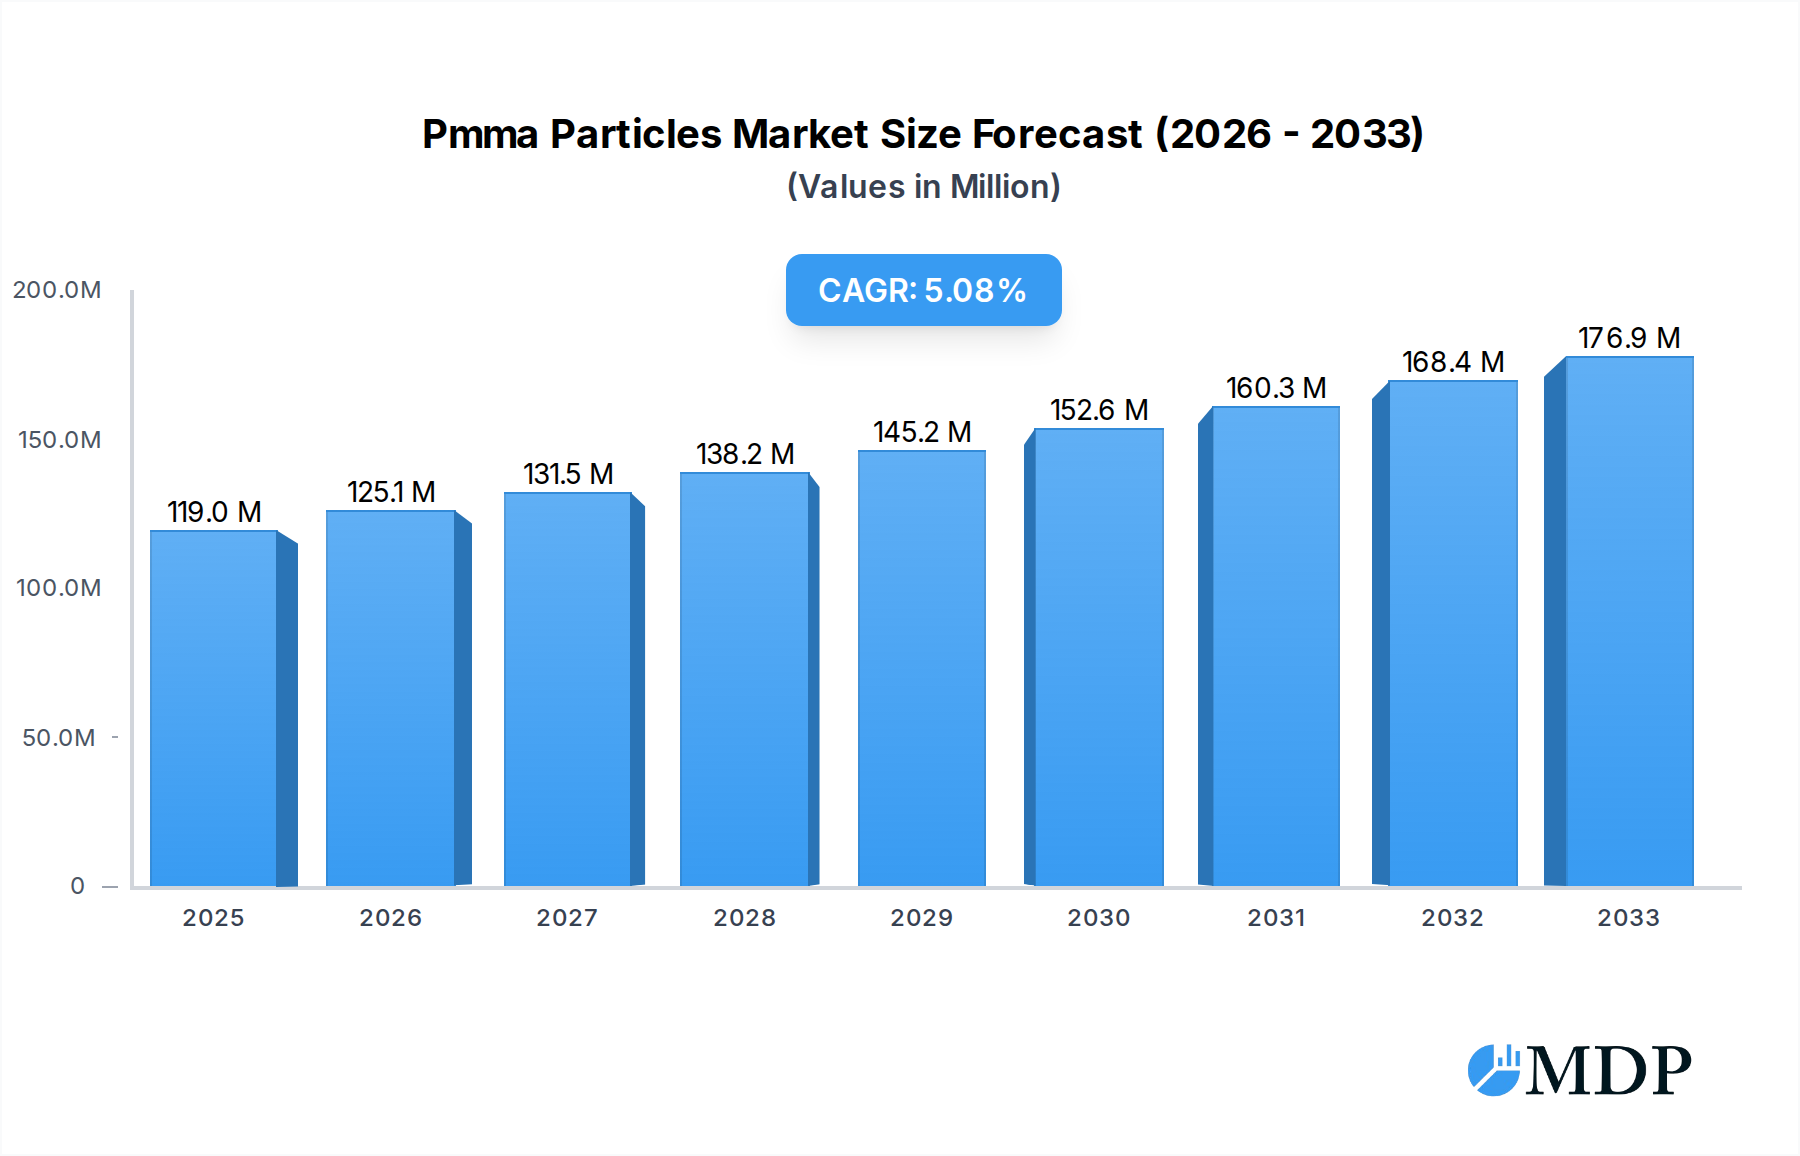
The global PMMA particles market is poised for significant expansion, projected to reach USD 119 million by 2025, with a robust Compound Annual Growth Rate (CAGR) of 5.1%. This growth is primarily fueled by the increasing demand for PMMA particles across diverse applications, including biomedical innovations, advanced cosmetic formulations, and high-performance coatings and printing inks. The biomedical sector, in particular, is a key driver, leveraging PMMA particles for drug delivery systems, tissue engineering, and diagnostic tools due to their biocompatibility and tunable properties. In cosmetics, their use in sunscreens, makeup, and skincare products for their texture enhancement and light-diffusing capabilities is gaining traction. Furthermore, the coatings and printing ink industry benefits from PMMA particles for their durability, weather resistance, and improved aesthetic qualities in paints, varnishes, and printing applications. The market's expansion is further supported by ongoing research and development into novel PMMA particle functionalities and production methods.

Pmma Particles Market Size (In Million)
The market is segmented by type into Plain PMMA Particles, Amino PMMA Particles, Carboxyl PMMA Particles, and Others, each catering to specific performance requirements. Amino and carboxyl-functionalized particles, for instance, offer enhanced surface reactivity, making them ideal for bio-conjugation and advanced material development. While the market demonstrates strong growth potential, certain restraints such as the fluctuating prices of raw materials and increasing regulatory scrutiny in specific applications, particularly in the biomedical and cosmetic industries, could present challenges. However, the introduction of innovative particle morphologies and surface modifications, coupled with the expanding geographical reach of key players such as Sekisui Kasei, Kowa, and LG Chem across North America, Europe, and Asia Pacific, is expected to offset these limitations and ensure sustained market momentum throughout the forecast period of 2025-2033. The Asia Pacific region, led by China and India, is anticipated to be a major growth hub due to its burgeoning manufacturing sector and increasing adoption of advanced materials.
Pmma Particles Company Market Share
PMMA Particles Market: Comprehensive Analysis & Future Outlook (2019-2033)
Unlock the secrets of the global PMMA (Polymethyl Methacrylate) particles market with this in-depth report. Spanning from 2019 to 2033, this analysis provides actionable insights into market dynamics, industry trends, leading segments, product developments, growth drivers, challenges, emerging opportunities, key players, and strategic outlook. With a base year of 2025 and a forecast period extending to 2033, this report is your definitive guide to navigating the evolving landscape of PMMA particle applications.
PMMA Particles Market Dynamics & Concentration
The global PMMA particles market is characterized by a moderately concentrated landscape, with a significant presence of both established chemical manufacturers and specialized particle producers. The market share is distributed among key players like Sekisui Kasei, Kowa, and LG Chem, alongside niche suppliers such as Cospheric, Spherotech, and microParticles GmbH. Innovation drivers are primarily fueled by advancements in polymerization techniques, surface modification technologies, and the expanding demand for PMMA particles in high-performance applications. Regulatory frameworks, particularly concerning biocompatibility in biomedical uses and environmental impact in coatings, play a crucial role in shaping product development and market access. Product substitutes, while present in certain segments (e.g., other polymer microspheres), often fall short in offering the unique combination of optical clarity, hardness, and chemical resistance of PMMA. End-user trends are increasingly leaning towards custom-designed particles with specific sizes, surface functionalities, and optical properties to meet stringent application requirements. Mergers and Acquisitions (M&A) activities, though not highly frequent, are strategic moves by larger entities to acquire specialized technologies or expand their product portfolios. For instance, there have been approximately 5 significant M&A deals in the past five years, indicating consolidation and strategic growth. The total market share of the top 5 players is estimated at around 60 million.
PMMA Particles Industry Trends & Analysis
The PMMA particles industry is poised for robust growth, driven by a confluence of technological advancements and expanding application frontiers. The market is projected to witness a Compound Annual Growth Rate (CAGR) of approximately 7.5% from 2025 to 2033, reaching a valuation of over 20 million by the end of the forecast period. This growth is underpinned by significant market penetration across key sectors, including biomedical, cosmetics, and advanced coatings.
Technological disruptions are playing a pivotal role. Innovations in controlled polymerization techniques, such as emulsion and suspension polymerization, enable the precise control of particle size, distribution, and morphology, leading to enhanced performance characteristics. Surface functionalization, including the development of amino-functionalized and carboxyl-functionalized PMMA particles, is opening up new avenues in drug delivery, diagnostics, and biomolecule conjugation. The demand for plain PMMA particles remains strong due to their inherent optical clarity and mechanical properties, finding extensive use in optical components and specialized coatings.
Consumer preferences are increasingly influencing product development, especially in the cosmetics sector, where PMMA particles are valued for their matte finish, texture enhancement, and light-diffusing properties. In the biomedical field, the biocompatibility and biodegradability of certain PMMA formulations are driving their adoption in drug encapsulation, tissue engineering scaffolds, and diagnostic assays. The coatings and printing inks segment is benefiting from the superior scratch resistance, weatherability, and UV stability offered by PMMA particles, leading to the development of more durable and aesthetically pleasing products.
Competitive dynamics within the industry are characterized by a balance between large, diversified chemical companies and agile, specialized manufacturers. Companies are focusing on R&D to develop novel PMMA particle formulations with tailored properties. Strategic partnerships and collaborations are becoming more prevalent as companies seek to leverage each other's expertise in material science, application development, and market access. The market penetration of specialized PMMA particles is expected to accelerate as industries recognize their unique benefits, pushing the overall market value beyond 20 million.
Leading Markets & Segments in PMMA Particles
The global PMMA particles market exhibits distinct regional dominance and segment leadership, driven by specific industrial demands and economic factors. North America, particularly the United States, currently leads in market share, largely due to its advanced biomedical research infrastructure, significant investment in the cosmetics industry, and a strong demand for high-performance coatings. The country's robust regulatory environment also fosters innovation and adoption of cutting-edge materials.
Within the Application segments:
Biomedical: This segment is experiencing substantial growth, projected to contribute over 5 million to the market value by 2033. Key drivers include:
- Growing demand for advanced drug delivery systems: PMMA's biocompatibility and ability to encapsulate and control the release of therapeutic agents make it ideal for innovative pharmaceutical formulations.
- Expansion of in-vitro diagnostics: Functionalized PMMA particles are crucial for developing highly sensitive and specific diagnostic assays and biosensors.
- Tissue engineering and regenerative medicine: PMMA-based scaffolds offer biocompatible platforms for cell growth and tissue regeneration.
- Increasing prevalence of chronic diseases: This necessitates continuous innovation in treatment delivery, boosting the demand for advanced particulate materials.
Cosmetics: This segment is also a significant contributor, valued at over 4 million in 2025. Drivers include:
- Demand for sophisticated textures and finishes: PMMA particles provide mattifying effects, improved slip, and a soft-focus appearance in makeup and skincare.
- Long-lasting formulations: Their inert nature enhances the stability and wear time of cosmetic products.
- Growing influence of beauty trends on social media: This fuels demand for innovative cosmetic ingredients.
- Increased consumer awareness of ingredient functionalities: Leading to a preference for specialized particles.
Coatings and Printing Inks: This segment is projected to reach over 6 million by 2033. Drivers include:
- Enhanced durability and scratch resistance: PMMA particles improve the performance of automotive, industrial, and architectural coatings.
- UV stability and weatherability: Essential for outdoor applications, extending product lifespan.
- Development of advanced printing technologies: Such as UV-curable inks requiring precise particle characteristics.
- Sustainable coating formulations: PMMA offers a robust alternative to certain less environmentally friendly materials.
Within the Type segments:
- Plain PMMA Particles: Remain a cornerstone, valued at over 8 million in 2025. Their widespread use in optical applications, as spacers, and as general fillers makes them indispensable.
- Carboxyl PMMA Particles: Are witnessing significant growth in the biomedical and diagnostic sectors due to their excellent surface chemistry for conjugation, contributing over 3 million to the market.
- Amino PMMA Particles: Are also crucial for biomolecule attachment and surface modification, with an estimated market value of over 3 million, driven by research and diagnostic applications.
- Others: This category, including specialized functionalized PMMA particles and composites, is expected to grow at the fastest pace, exceeding 4 million by 2033, reflecting the increasing demand for highly customized solutions.
PMMA Particles Product Developments
Recent product developments in the PMMA particles market focus on enhancing their functionality and expanding their application scope. Innovations include ultra-high purity PMMA particles for advanced biomedical applications, precisely sized microspheres for controlled drug release, and surface-modified particles with specific chemical functionalities for improved binding and targeting. Companies are also developing eco-friendly PMMA particle formulations and composites that offer superior performance with reduced environmental impact. These developments cater to the growing demand for tailored materials in areas like advanced diagnostics, targeted therapies, and high-performance coatings, offering competitive advantages through enhanced efficacy and unique properties.
Key Drivers of PMMA Particles Growth
The growth of the PMMA particles market is propelled by several key factors. Technological advancements in polymerization and surface modification are enabling the creation of PMMA particles with highly specific properties, catering to specialized application needs. The increasing demand for advanced materials in the biomedical sector, including drug delivery systems and diagnostics, is a significant growth driver. Furthermore, the expanding use of PMMA particles in the cosmetics industry for texture enhancement and optical effects, alongside their growing application in durable and high-performance coatings and printing inks, contributes substantially to market expansion. Favorable regulatory approvals for biocompatible PMMA particles in healthcare applications are also playing a crucial role.
Challenges in the PMMA Particles Market
Despite its promising growth, the PMMA particles market faces several challenges. Intense competition from alternative polymer microspheres and inorganic nanoparticles can limit market penetration in certain applications. Fluctuations in raw material prices, particularly for methyl methacrylate monomer, can impact production costs and profitability. Stringent regulatory hurdles for novel applications, especially in the highly regulated biomedical and pharmaceutical sectors, can lead to extended development and approval timelines. Supply chain disruptions and the need for specialized manufacturing processes to achieve precise particle characteristics also present ongoing challenges for manufacturers.
Emerging Opportunities in PMMA Particles
Emerging opportunities in the PMMA particles market are primarily driven by advancements in nanotechnology and the growing demand for personalized solutions. The development of smart PMMA particles with responsive functionalities for targeted drug delivery and advanced diagnostics presents a significant growth avenue. Strategic partnerships between PMMA particle manufacturers and end-user industries, such as pharmaceutical and cosmetic companies, can accelerate product development and market adoption. Furthermore, the exploration of PMMA particles in emerging fields like microfluidics, 3D printing, and advanced composite materials offers substantial long-term growth potential, driving innovation and market expansion.
Leading Players in the PMMA Particles Sector
- Sekisui Kasei
- Kowa
- HEYO Enterprises
- Cospheric
- Spherotech
- LG Chem
- Magsphere
- Coating Products
- Polysciences
- Sunjin Beauty Science
- microParticles GmbH
- CD Bioparticles
- Microchem
- Lab261
- Kobo Products
- Trinseo
- EPRUI Biotech
Key Milestones in PMMA Particles Industry
- 2019: Development of novel biocompatible PMMA formulations for advanced wound healing.
- 2020: Introduction of surface-functionalized PMMA particles for enhanced biomarker detection in diagnostics.
- 2021: Increased adoption of PMMA particles in eco-friendly coating formulations due to enhanced durability.
- 2022: Significant advancements in controlling particle size and distribution for customized cosmetic applications.
- 2023: Strategic collaborations for developing PMMA-based scaffolds for regenerative medicine research.
- 2024: Enhanced production capacity for high-purity PMMA particles to meet escalating biomedical demand.
Strategic Outlook for PMMA Particles Market
The strategic outlook for the PMMA particles market is highly optimistic, driven by continuous innovation and expanding application horizons. Key growth accelerators include the ongoing research and development in biomedical applications, particularly in targeted drug delivery and advanced diagnostics, which are expected to witness substantial investment and adoption. The increasing demand for high-performance, durable coatings and the evolving needs of the cosmetics industry for sophisticated texture and aesthetic enhancements will continue to fuel market growth. Strategic collaborations between material suppliers and end-users will be crucial for co-creating novel PMMA particle solutions. Furthermore, the exploration of PMMA particles in emerging technologies like 3D printing and microfluidics offers significant future potential, positioning the market for sustained expansion and value creation.
Pmma Particles Segmentation
-
1. Application
- 1.1. Biomedical
- 1.2. Cosmetics
- 1.3. Coatings and Printing Inks
- 1.4. Others
-
2. Type
- 2.1. Plain PMMA Particles
- 2.2. Amino PMMA Particles
- 2.3. Carboxyl PMMA Particles
- 2.4. Others
Pmma Particles Segmentation By Geography
-
1. North America
- 1.1. United States
- 1.2. Canada
- 1.3. Mexico
-
2. South America
- 2.1. Brazil
- 2.2. Argentina
- 2.3. Rest of South America
-
3. Europe
- 3.1. United Kingdom
- 3.2. Germany
- 3.3. France
- 3.4. Italy
- 3.5. Spain
- 3.6. Russia
- 3.7. Benelux
- 3.8. Nordics
- 3.9. Rest of Europe
-
4. Middle East & Africa
- 4.1. Turkey
- 4.2. Israel
- 4.3. GCC
- 4.4. North Africa
- 4.5. South Africa
- 4.6. Rest of Middle East & Africa
-
5. Asia Pacific
- 5.1. China
- 5.2. India
- 5.3. Japan
- 5.4. South Korea
- 5.5. ASEAN
- 5.6. Oceania
- 5.7. Rest of Asia Pacific
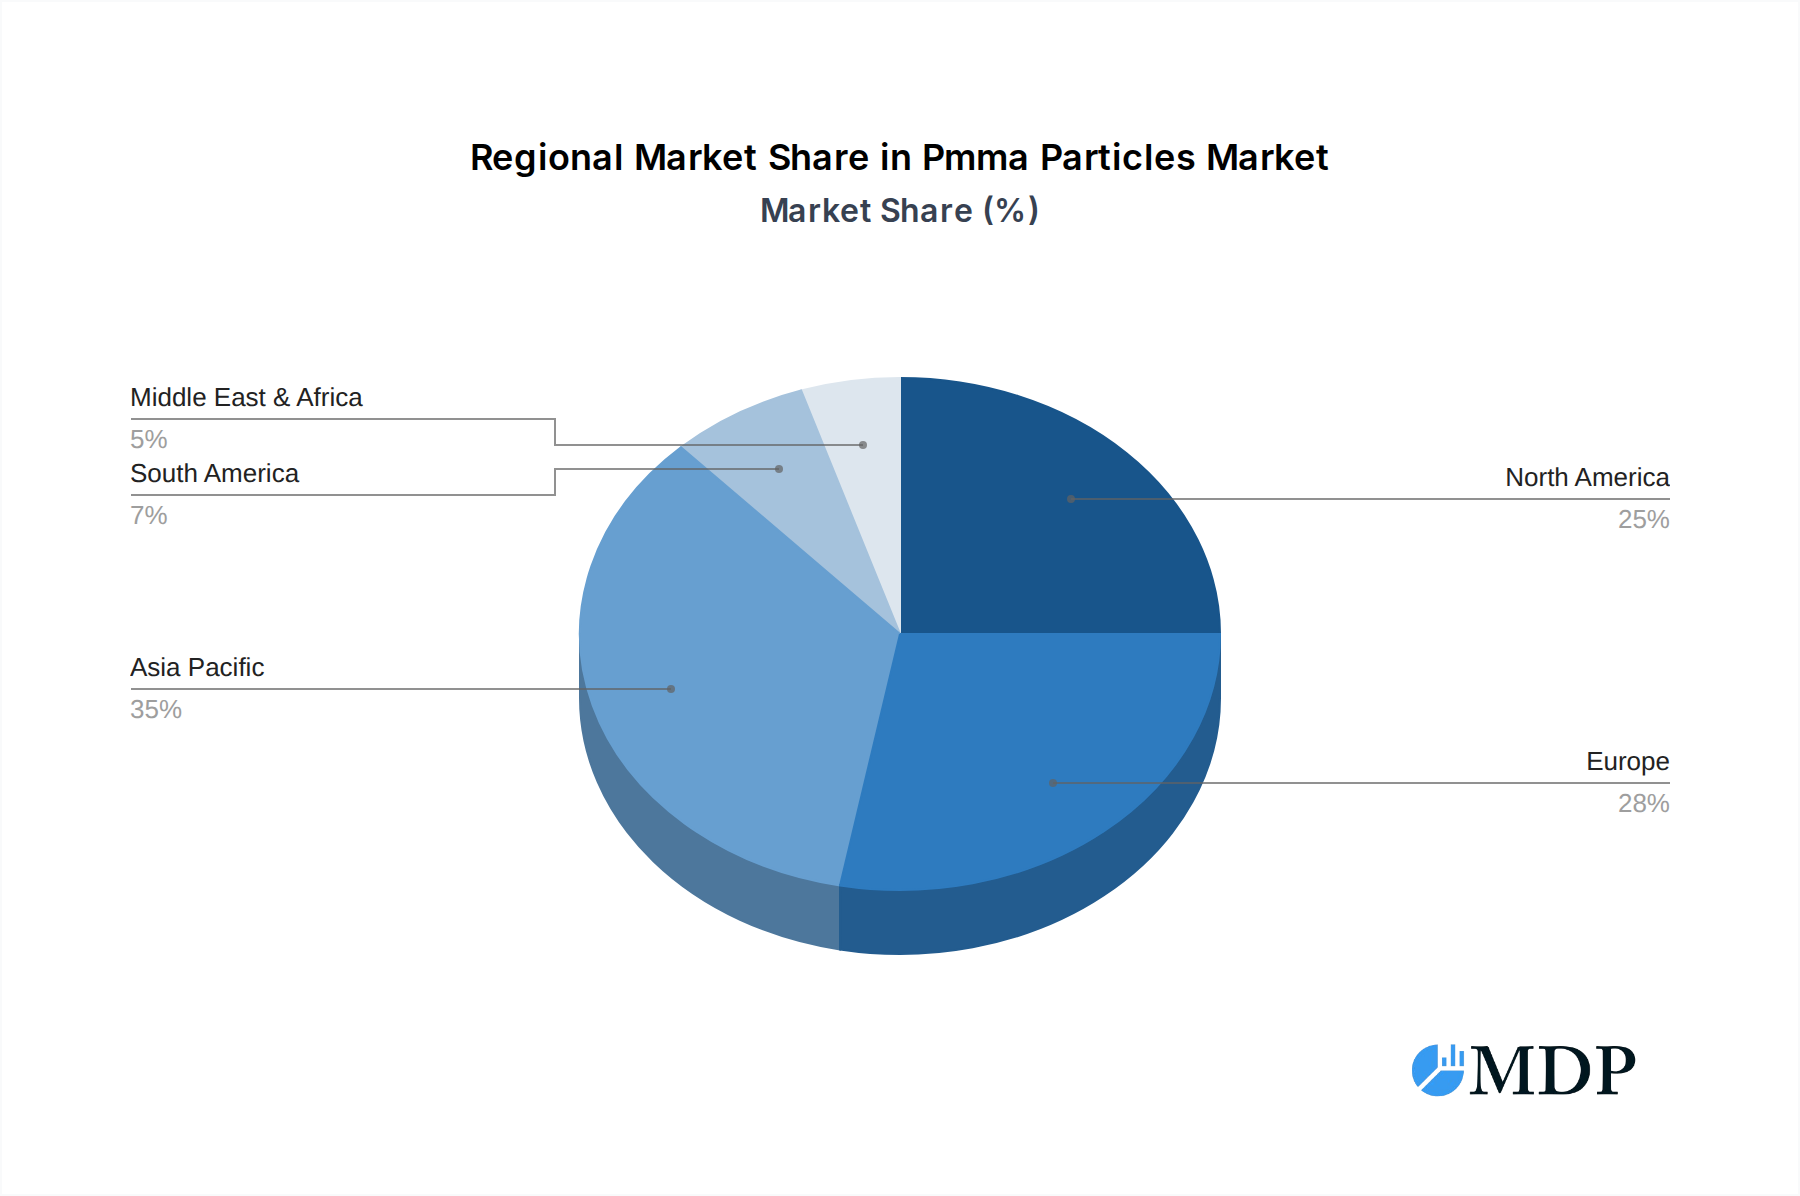
Pmma Particles Regional Market Share
Geographic Coverage of Pmma Particles
Pmma Particles REPORT HIGHLIGHTS
| Aspects | Details |
|---|---|
| Study Period | 2020-2034 |
| Base Year | 2025 |
| Estimated Year | 2026 |
| Forecast Period | 2026-2034 |
| Historical Period | 2020-2025 |
| Growth Rate | CAGR of 5.1% from 2020-2034 |
| Segmentation |
|
Table of Contents
- 1. Introduction
- 1.1. Research Scope
- 1.2. Market Segmentation
- 1.3. Research Methodology
- 1.4. Definitions and Assumptions
- 2. Executive Summary
- 2.1. Introduction
- 3. Market Dynamics
- 3.1. Introduction
- 3.2. Market Drivers
- 3.3. Market Restrains
- 3.4. Market Trends
- 4. Market Factor Analysis
- 4.1. Porters Five Forces
- 4.2. Supply/Value Chain
- 4.3. PESTEL analysis
- 4.4. Market Entropy
- 4.5. Patent/Trademark Analysis
- 5. Global Pmma Particles Analysis, Insights and Forecast, 2020-2032
- 5.1. Market Analysis, Insights and Forecast - by Application
- 5.1.1. Biomedical
- 5.1.2. Cosmetics
- 5.1.3. Coatings and Printing Inks
- 5.1.4. Others
- 5.2. Market Analysis, Insights and Forecast - by Type
- 5.2.1. Plain PMMA Particles
- 5.2.2. Amino PMMA Particles
- 5.2.3. Carboxyl PMMA Particles
- 5.2.4. Others
- 5.3. Market Analysis, Insights and Forecast - by Region
- 5.3.1. North America
- 5.3.2. South America
- 5.3.3. Europe
- 5.3.4. Middle East & Africa
- 5.3.5. Asia Pacific
- 5.1. Market Analysis, Insights and Forecast - by Application
- 6. North America Pmma Particles Analysis, Insights and Forecast, 2020-2032
- 6.1. Market Analysis, Insights and Forecast - by Application
- 6.1.1. Biomedical
- 6.1.2. Cosmetics
- 6.1.3. Coatings and Printing Inks
- 6.1.4. Others
- 6.2. Market Analysis, Insights and Forecast - by Type
- 6.2.1. Plain PMMA Particles
- 6.2.2. Amino PMMA Particles
- 6.2.3. Carboxyl PMMA Particles
- 6.2.4. Others
- 6.1. Market Analysis, Insights and Forecast - by Application
- 7. South America Pmma Particles Analysis, Insights and Forecast, 2020-2032
- 7.1. Market Analysis, Insights and Forecast - by Application
- 7.1.1. Biomedical
- 7.1.2. Cosmetics
- 7.1.3. Coatings and Printing Inks
- 7.1.4. Others
- 7.2. Market Analysis, Insights and Forecast - by Type
- 7.2.1. Plain PMMA Particles
- 7.2.2. Amino PMMA Particles
- 7.2.3. Carboxyl PMMA Particles
- 7.2.4. Others
- 7.1. Market Analysis, Insights and Forecast - by Application
- 8. Europe Pmma Particles Analysis, Insights and Forecast, 2020-2032
- 8.1. Market Analysis, Insights and Forecast - by Application
- 8.1.1. Biomedical
- 8.1.2. Cosmetics
- 8.1.3. Coatings and Printing Inks
- 8.1.4. Others
- 8.2. Market Analysis, Insights and Forecast - by Type
- 8.2.1. Plain PMMA Particles
- 8.2.2. Amino PMMA Particles
- 8.2.3. Carboxyl PMMA Particles
- 8.2.4. Others
- 8.1. Market Analysis, Insights and Forecast - by Application
- 9. Middle East & Africa Pmma Particles Analysis, Insights and Forecast, 2020-2032
- 9.1. Market Analysis, Insights and Forecast - by Application
- 9.1.1. Biomedical
- 9.1.2. Cosmetics
- 9.1.3. Coatings and Printing Inks
- 9.1.4. Others
- 9.2. Market Analysis, Insights and Forecast - by Type
- 9.2.1. Plain PMMA Particles
- 9.2.2. Amino PMMA Particles
- 9.2.3. Carboxyl PMMA Particles
- 9.2.4. Others
- 9.1. Market Analysis, Insights and Forecast - by Application
- 10. Asia Pacific Pmma Particles Analysis, Insights and Forecast, 2020-2032
- 10.1. Market Analysis, Insights and Forecast - by Application
- 10.1.1. Biomedical
- 10.1.2. Cosmetics
- 10.1.3. Coatings and Printing Inks
- 10.1.4. Others
- 10.2. Market Analysis, Insights and Forecast - by Type
- 10.2.1. Plain PMMA Particles
- 10.2.2. Amino PMMA Particles
- 10.2.3. Carboxyl PMMA Particles
- 10.2.4. Others
- 10.1. Market Analysis, Insights and Forecast - by Application
- 11. Competitive Analysis
- 11.1. Global Market Share Analysis 2025
- 11.2. Company Profiles
- 11.2.1 Sekisui Kasei
- 11.2.1.1. Overview
- 11.2.1.2. Products
- 11.2.1.3. SWOT Analysis
- 11.2.1.4. Recent Developments
- 11.2.1.5. Financials (Based on Availability)
- 11.2.2 Kowa
- 11.2.2.1. Overview
- 11.2.2.2. Products
- 11.2.2.3. SWOT Analysis
- 11.2.2.4. Recent Developments
- 11.2.2.5. Financials (Based on Availability)
- 11.2.3 HEYO Enterprises
- 11.2.3.1. Overview
- 11.2.3.2. Products
- 11.2.3.3. SWOT Analysis
- 11.2.3.4. Recent Developments
- 11.2.3.5. Financials (Based on Availability)
- 11.2.4 Cospheric
- 11.2.4.1. Overview
- 11.2.4.2. Products
- 11.2.4.3. SWOT Analysis
- 11.2.4.4. Recent Developments
- 11.2.4.5. Financials (Based on Availability)
- 11.2.5 Spherotech
- 11.2.5.1. Overview
- 11.2.5.2. Products
- 11.2.5.3. SWOT Analysis
- 11.2.5.4. Recent Developments
- 11.2.5.5. Financials (Based on Availability)
- 11.2.6 LG Chem
- 11.2.6.1. Overview
- 11.2.6.2. Products
- 11.2.6.3. SWOT Analysis
- 11.2.6.4. Recent Developments
- 11.2.6.5. Financials (Based on Availability)
- 11.2.7 Magsphere
- 11.2.7.1. Overview
- 11.2.7.2. Products
- 11.2.7.3. SWOT Analysis
- 11.2.7.4. Recent Developments
- 11.2.7.5. Financials (Based on Availability)
- 11.2.8 Coating Products
- 11.2.8.1. Overview
- 11.2.8.2. Products
- 11.2.8.3. SWOT Analysis
- 11.2.8.4. Recent Developments
- 11.2.8.5. Financials (Based on Availability)
- 11.2.9 Polysciences
- 11.2.9.1. Overview
- 11.2.9.2. Products
- 11.2.9.3. SWOT Analysis
- 11.2.9.4. Recent Developments
- 11.2.9.5. Financials (Based on Availability)
- 11.2.10 Sunjin Beauty Science
- 11.2.10.1. Overview
- 11.2.10.2. Products
- 11.2.10.3. SWOT Analysis
- 11.2.10.4. Recent Developments
- 11.2.10.5. Financials (Based on Availability)
- 11.2.11 microParticles GmbH
- 11.2.11.1. Overview
- 11.2.11.2. Products
- 11.2.11.3. SWOT Analysis
- 11.2.11.4. Recent Developments
- 11.2.11.5. Financials (Based on Availability)
- 11.2.12 CD Bioparticles
- 11.2.12.1. Overview
- 11.2.12.2. Products
- 11.2.12.3. SWOT Analysis
- 11.2.12.4. Recent Developments
- 11.2.12.5. Financials (Based on Availability)
- 11.2.13 Microchem
- 11.2.13.1. Overview
- 11.2.13.2. Products
- 11.2.13.3. SWOT Analysis
- 11.2.13.4. Recent Developments
- 11.2.13.5. Financials (Based on Availability)
- 11.2.14 Lab261
- 11.2.14.1. Overview
- 11.2.14.2. Products
- 11.2.14.3. SWOT Analysis
- 11.2.14.4. Recent Developments
- 11.2.14.5. Financials (Based on Availability)
- 11.2.15 Kobo Products
- 11.2.15.1. Overview
- 11.2.15.2. Products
- 11.2.15.3. SWOT Analysis
- 11.2.15.4. Recent Developments
- 11.2.15.5. Financials (Based on Availability)
- 11.2.16 Trinseo
- 11.2.16.1. Overview
- 11.2.16.2. Products
- 11.2.16.3. SWOT Analysis
- 11.2.16.4. Recent Developments
- 11.2.16.5. Financials (Based on Availability)
- 11.2.17 EPRUI Biotech
- 11.2.17.1. Overview
- 11.2.17.2. Products
- 11.2.17.3. SWOT Analysis
- 11.2.17.4. Recent Developments
- 11.2.17.5. Financials (Based on Availability)
- 11.2.1 Sekisui Kasei
List of Figures
- Figure 1: Global Pmma Particles Revenue Breakdown (million, %) by Region 2025 & 2033
- Figure 2: Global Pmma Particles Volume Breakdown (K, %) by Region 2025 & 2033
- Figure 3: North America Pmma Particles Revenue (million), by Application 2025 & 2033
- Figure 4: North America Pmma Particles Volume (K), by Application 2025 & 2033
- Figure 5: North America Pmma Particles Revenue Share (%), by Application 2025 & 2033
- Figure 6: North America Pmma Particles Volume Share (%), by Application 2025 & 2033
- Figure 7: North America Pmma Particles Revenue (million), by Type 2025 & 2033
- Figure 8: North America Pmma Particles Volume (K), by Type 2025 & 2033
- Figure 9: North America Pmma Particles Revenue Share (%), by Type 2025 & 2033
- Figure 10: North America Pmma Particles Volume Share (%), by Type 2025 & 2033
- Figure 11: North America Pmma Particles Revenue (million), by Country 2025 & 2033
- Figure 12: North America Pmma Particles Volume (K), by Country 2025 & 2033
- Figure 13: North America Pmma Particles Revenue Share (%), by Country 2025 & 2033
- Figure 14: North America Pmma Particles Volume Share (%), by Country 2025 & 2033
- Figure 15: South America Pmma Particles Revenue (million), by Application 2025 & 2033
- Figure 16: South America Pmma Particles Volume (K), by Application 2025 & 2033
- Figure 17: South America Pmma Particles Revenue Share (%), by Application 2025 & 2033
- Figure 18: South America Pmma Particles Volume Share (%), by Application 2025 & 2033
- Figure 19: South America Pmma Particles Revenue (million), by Type 2025 & 2033
- Figure 20: South America Pmma Particles Volume (K), by Type 2025 & 2033
- Figure 21: South America Pmma Particles Revenue Share (%), by Type 2025 & 2033
- Figure 22: South America Pmma Particles Volume Share (%), by Type 2025 & 2033
- Figure 23: South America Pmma Particles Revenue (million), by Country 2025 & 2033
- Figure 24: South America Pmma Particles Volume (K), by Country 2025 & 2033
- Figure 25: South America Pmma Particles Revenue Share (%), by Country 2025 & 2033
- Figure 26: South America Pmma Particles Volume Share (%), by Country 2025 & 2033
- Figure 27: Europe Pmma Particles Revenue (million), by Application 2025 & 2033
- Figure 28: Europe Pmma Particles Volume (K), by Application 2025 & 2033
- Figure 29: Europe Pmma Particles Revenue Share (%), by Application 2025 & 2033
- Figure 30: Europe Pmma Particles Volume Share (%), by Application 2025 & 2033
- Figure 31: Europe Pmma Particles Revenue (million), by Type 2025 & 2033
- Figure 32: Europe Pmma Particles Volume (K), by Type 2025 & 2033
- Figure 33: Europe Pmma Particles Revenue Share (%), by Type 2025 & 2033
- Figure 34: Europe Pmma Particles Volume Share (%), by Type 2025 & 2033
- Figure 35: Europe Pmma Particles Revenue (million), by Country 2025 & 2033
- Figure 36: Europe Pmma Particles Volume (K), by Country 2025 & 2033
- Figure 37: Europe Pmma Particles Revenue Share (%), by Country 2025 & 2033
- Figure 38: Europe Pmma Particles Volume Share (%), by Country 2025 & 2033
- Figure 39: Middle East & Africa Pmma Particles Revenue (million), by Application 2025 & 2033
- Figure 40: Middle East & Africa Pmma Particles Volume (K), by Application 2025 & 2033
- Figure 41: Middle East & Africa Pmma Particles Revenue Share (%), by Application 2025 & 2033
- Figure 42: Middle East & Africa Pmma Particles Volume Share (%), by Application 2025 & 2033
- Figure 43: Middle East & Africa Pmma Particles Revenue (million), by Type 2025 & 2033
- Figure 44: Middle East & Africa Pmma Particles Volume (K), by Type 2025 & 2033
- Figure 45: Middle East & Africa Pmma Particles Revenue Share (%), by Type 2025 & 2033
- Figure 46: Middle East & Africa Pmma Particles Volume Share (%), by Type 2025 & 2033
- Figure 47: Middle East & Africa Pmma Particles Revenue (million), by Country 2025 & 2033
- Figure 48: Middle East & Africa Pmma Particles Volume (K), by Country 2025 & 2033
- Figure 49: Middle East & Africa Pmma Particles Revenue Share (%), by Country 2025 & 2033
- Figure 50: Middle East & Africa Pmma Particles Volume Share (%), by Country 2025 & 2033
- Figure 51: Asia Pacific Pmma Particles Revenue (million), by Application 2025 & 2033
- Figure 52: Asia Pacific Pmma Particles Volume (K), by Application 2025 & 2033
- Figure 53: Asia Pacific Pmma Particles Revenue Share (%), by Application 2025 & 2033
- Figure 54: Asia Pacific Pmma Particles Volume Share (%), by Application 2025 & 2033
- Figure 55: Asia Pacific Pmma Particles Revenue (million), by Type 2025 & 2033
- Figure 56: Asia Pacific Pmma Particles Volume (K), by Type 2025 & 2033
- Figure 57: Asia Pacific Pmma Particles Revenue Share (%), by Type 2025 & 2033
- Figure 58: Asia Pacific Pmma Particles Volume Share (%), by Type 2025 & 2033
- Figure 59: Asia Pacific Pmma Particles Revenue (million), by Country 2025 & 2033
- Figure 60: Asia Pacific Pmma Particles Volume (K), by Country 2025 & 2033
- Figure 61: Asia Pacific Pmma Particles Revenue Share (%), by Country 2025 & 2033
- Figure 62: Asia Pacific Pmma Particles Volume Share (%), by Country 2025 & 2033
List of Tables
- Table 1: Global Pmma Particles Revenue million Forecast, by Application 2020 & 2033
- Table 2: Global Pmma Particles Volume K Forecast, by Application 2020 & 2033
- Table 3: Global Pmma Particles Revenue million Forecast, by Type 2020 & 2033
- Table 4: Global Pmma Particles Volume K Forecast, by Type 2020 & 2033
- Table 5: Global Pmma Particles Revenue million Forecast, by Region 2020 & 2033
- Table 6: Global Pmma Particles Volume K Forecast, by Region 2020 & 2033
- Table 7: Global Pmma Particles Revenue million Forecast, by Application 2020 & 2033
- Table 8: Global Pmma Particles Volume K Forecast, by Application 2020 & 2033
- Table 9: Global Pmma Particles Revenue million Forecast, by Type 2020 & 2033
- Table 10: Global Pmma Particles Volume K Forecast, by Type 2020 & 2033
- Table 11: Global Pmma Particles Revenue million Forecast, by Country 2020 & 2033
- Table 12: Global Pmma Particles Volume K Forecast, by Country 2020 & 2033
- Table 13: United States Pmma Particles Revenue (million) Forecast, by Application 2020 & 2033
- Table 14: United States Pmma Particles Volume (K) Forecast, by Application 2020 & 2033
- Table 15: Canada Pmma Particles Revenue (million) Forecast, by Application 2020 & 2033
- Table 16: Canada Pmma Particles Volume (K) Forecast, by Application 2020 & 2033
- Table 17: Mexico Pmma Particles Revenue (million) Forecast, by Application 2020 & 2033
- Table 18: Mexico Pmma Particles Volume (K) Forecast, by Application 2020 & 2033
- Table 19: Global Pmma Particles Revenue million Forecast, by Application 2020 & 2033
- Table 20: Global Pmma Particles Volume K Forecast, by Application 2020 & 2033
- Table 21: Global Pmma Particles Revenue million Forecast, by Type 2020 & 2033
- Table 22: Global Pmma Particles Volume K Forecast, by Type 2020 & 2033
- Table 23: Global Pmma Particles Revenue million Forecast, by Country 2020 & 2033
- Table 24: Global Pmma Particles Volume K Forecast, by Country 2020 & 2033
- Table 25: Brazil Pmma Particles Revenue (million) Forecast, by Application 2020 & 2033
- Table 26: Brazil Pmma Particles Volume (K) Forecast, by Application 2020 & 2033
- Table 27: Argentina Pmma Particles Revenue (million) Forecast, by Application 2020 & 2033
- Table 28: Argentina Pmma Particles Volume (K) Forecast, by Application 2020 & 2033
- Table 29: Rest of South America Pmma Particles Revenue (million) Forecast, by Application 2020 & 2033
- Table 30: Rest of South America Pmma Particles Volume (K) Forecast, by Application 2020 & 2033
- Table 31: Global Pmma Particles Revenue million Forecast, by Application 2020 & 2033
- Table 32: Global Pmma Particles Volume K Forecast, by Application 2020 & 2033
- Table 33: Global Pmma Particles Revenue million Forecast, by Type 2020 & 2033
- Table 34: Global Pmma Particles Volume K Forecast, by Type 2020 & 2033
- Table 35: Global Pmma Particles Revenue million Forecast, by Country 2020 & 2033
- Table 36: Global Pmma Particles Volume K Forecast, by Country 2020 & 2033
- Table 37: United Kingdom Pmma Particles Revenue (million) Forecast, by Application 2020 & 2033
- Table 38: United Kingdom Pmma Particles Volume (K) Forecast, by Application 2020 & 2033
- Table 39: Germany Pmma Particles Revenue (million) Forecast, by Application 2020 & 2033
- Table 40: Germany Pmma Particles Volume (K) Forecast, by Application 2020 & 2033
- Table 41: France Pmma Particles Revenue (million) Forecast, by Application 2020 & 2033
- Table 42: France Pmma Particles Volume (K) Forecast, by Application 2020 & 2033
- Table 43: Italy Pmma Particles Revenue (million) Forecast, by Application 2020 & 2033
- Table 44: Italy Pmma Particles Volume (K) Forecast, by Application 2020 & 2033
- Table 45: Spain Pmma Particles Revenue (million) Forecast, by Application 2020 & 2033
- Table 46: Spain Pmma Particles Volume (K) Forecast, by Application 2020 & 2033
- Table 47: Russia Pmma Particles Revenue (million) Forecast, by Application 2020 & 2033
- Table 48: Russia Pmma Particles Volume (K) Forecast, by Application 2020 & 2033
- Table 49: Benelux Pmma Particles Revenue (million) Forecast, by Application 2020 & 2033
- Table 50: Benelux Pmma Particles Volume (K) Forecast, by Application 2020 & 2033
- Table 51: Nordics Pmma Particles Revenue (million) Forecast, by Application 2020 & 2033
- Table 52: Nordics Pmma Particles Volume (K) Forecast, by Application 2020 & 2033
- Table 53: Rest of Europe Pmma Particles Revenue (million) Forecast, by Application 2020 & 2033
- Table 54: Rest of Europe Pmma Particles Volume (K) Forecast, by Application 2020 & 2033
- Table 55: Global Pmma Particles Revenue million Forecast, by Application 2020 & 2033
- Table 56: Global Pmma Particles Volume K Forecast, by Application 2020 & 2033
- Table 57: Global Pmma Particles Revenue million Forecast, by Type 2020 & 2033
- Table 58: Global Pmma Particles Volume K Forecast, by Type 2020 & 2033
- Table 59: Global Pmma Particles Revenue million Forecast, by Country 2020 & 2033
- Table 60: Global Pmma Particles Volume K Forecast, by Country 2020 & 2033
- Table 61: Turkey Pmma Particles Revenue (million) Forecast, by Application 2020 & 2033
- Table 62: Turkey Pmma Particles Volume (K) Forecast, by Application 2020 & 2033
- Table 63: Israel Pmma Particles Revenue (million) Forecast, by Application 2020 & 2033
- Table 64: Israel Pmma Particles Volume (K) Forecast, by Application 2020 & 2033
- Table 65: GCC Pmma Particles Revenue (million) Forecast, by Application 2020 & 2033
- Table 66: GCC Pmma Particles Volume (K) Forecast, by Application 2020 & 2033
- Table 67: North Africa Pmma Particles Revenue (million) Forecast, by Application 2020 & 2033
- Table 68: North Africa Pmma Particles Volume (K) Forecast, by Application 2020 & 2033
- Table 69: South Africa Pmma Particles Revenue (million) Forecast, by Application 2020 & 2033
- Table 70: South Africa Pmma Particles Volume (K) Forecast, by Application 2020 & 2033
- Table 71: Rest of Middle East & Africa Pmma Particles Revenue (million) Forecast, by Application 2020 & 2033
- Table 72: Rest of Middle East & Africa Pmma Particles Volume (K) Forecast, by Application 2020 & 2033
- Table 73: Global Pmma Particles Revenue million Forecast, by Application 2020 & 2033
- Table 74: Global Pmma Particles Volume K Forecast, by Application 2020 & 2033
- Table 75: Global Pmma Particles Revenue million Forecast, by Type 2020 & 2033
- Table 76: Global Pmma Particles Volume K Forecast, by Type 2020 & 2033
- Table 77: Global Pmma Particles Revenue million Forecast, by Country 2020 & 2033
- Table 78: Global Pmma Particles Volume K Forecast, by Country 2020 & 2033
- Table 79: China Pmma Particles Revenue (million) Forecast, by Application 2020 & 2033
- Table 80: China Pmma Particles Volume (K) Forecast, by Application 2020 & 2033
- Table 81: India Pmma Particles Revenue (million) Forecast, by Application 2020 & 2033
- Table 82: India Pmma Particles Volume (K) Forecast, by Application 2020 & 2033
- Table 83: Japan Pmma Particles Revenue (million) Forecast, by Application 2020 & 2033
- Table 84: Japan Pmma Particles Volume (K) Forecast, by Application 2020 & 2033
- Table 85: South Korea Pmma Particles Revenue (million) Forecast, by Application 2020 & 2033
- Table 86: South Korea Pmma Particles Volume (K) Forecast, by Application 2020 & 2033
- Table 87: ASEAN Pmma Particles Revenue (million) Forecast, by Application 2020 & 2033
- Table 88: ASEAN Pmma Particles Volume (K) Forecast, by Application 2020 & 2033
- Table 89: Oceania Pmma Particles Revenue (million) Forecast, by Application 2020 & 2033
- Table 90: Oceania Pmma Particles Volume (K) Forecast, by Application 2020 & 2033
- Table 91: Rest of Asia Pacific Pmma Particles Revenue (million) Forecast, by Application 2020 & 2033
- Table 92: Rest of Asia Pacific Pmma Particles Volume (K) Forecast, by Application 2020 & 2033
Frequently Asked Questions
1. What is the projected Compound Annual Growth Rate (CAGR) of the Pmma Particles?
The projected CAGR is approximately 5.1%.
2. Which companies are prominent players in the Pmma Particles?
Key companies in the market include Sekisui Kasei, Kowa, HEYO Enterprises, Cospheric, Spherotech, LG Chem, Magsphere, Coating Products, Polysciences, Sunjin Beauty Science, microParticles GmbH, CD Bioparticles, Microchem, Lab261, Kobo Products, Trinseo, EPRUI Biotech.
3. What are the main segments of the Pmma Particles?
The market segments include Application, Type.
4. Can you provide details about the market size?
The market size is estimated to be USD 119 million as of 2022.
5. What are some drivers contributing to market growth?
N/A
6. What are the notable trends driving market growth?
N/A
7. Are there any restraints impacting market growth?
N/A
8. Can you provide examples of recent developments in the market?
N/A
9. What pricing options are available for accessing the report?
Pricing options include single-user, multi-user, and enterprise licenses priced at USD 3950.00, USD 5925.00, and USD 7900.00 respectively.
10. Is the market size provided in terms of value or volume?
The market size is provided in terms of value, measured in million and volume, measured in K.
11. Are there any specific market keywords associated with the report?
Yes, the market keyword associated with the report is "Pmma Particles," which aids in identifying and referencing the specific market segment covered.
12. How do I determine which pricing option suits my needs best?
The pricing options vary based on user requirements and access needs. Individual users may opt for single-user licenses, while businesses requiring broader access may choose multi-user or enterprise licenses for cost-effective access to the report.
13. Are there any additional resources or data provided in the Pmma Particles report?
While the report offers comprehensive insights, it's advisable to review the specific contents or supplementary materials provided to ascertain if additional resources or data are available.
14. How can I stay updated on further developments or reports in the Pmma Particles?
To stay informed about further developments, trends, and reports in the Pmma Particles, consider subscribing to industry newsletters, following relevant companies and organizations, or regularly checking reputable industry news sources and publications.
Methodology
Step 1 - Identification of Relevant Samples Size from Population Database


Step 2 - Approaches for Defining Global Market Size (Value, Volume* & Price*)

Note*: In applicable scenarios
Step 3 - Data Sources
Primary Research
- Web Analytics
- Survey Reports
- Research Institute
- Latest Research Reports
- Opinion Leaders
Secondary Research
- Annual Reports
- White Paper
- Latest Press Release
- Industry Association
- Paid Database
- Investor Presentations

Step 4 - Data Triangulation
Involves using different sources of information in order to increase the validity of a study
These sources are likely to be stakeholders in a program - participants, other researchers, program staff, other community members, and so on.
Then we put all data in single framework & apply various statistical tools to find out the dynamic on the market.
During the analysis stage, feedback from the stakeholder groups would be compared to determine areas of agreement as well as areas of divergence