

Key Insights
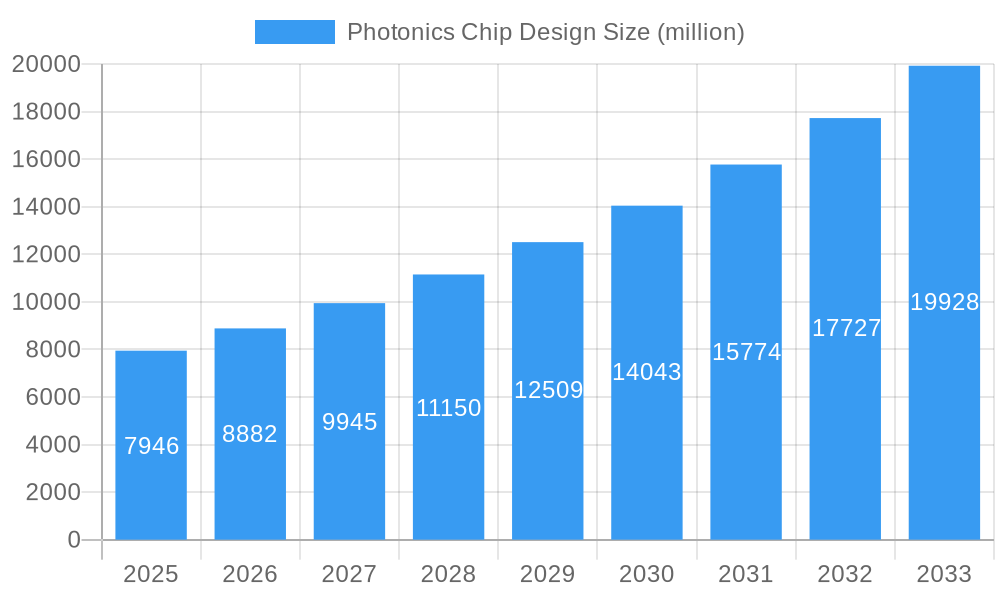
The photonics chip design market, valued at $7.946 billion in 2025, is projected to experience robust growth, driven by the increasing demand for high-speed data transmission and processing capabilities across various sectors. This expansion is fueled by the proliferation of 5G and beyond 5G networks, the rise of data centers requiring advanced optical interconnects, and the growing adoption of autonomous vehicles and other applications demanding high-bandwidth communication. Key technological advancements in silicon photonics and advanced packaging techniques are further contributing to market expansion. Companies like Intel, Cisco, and Broadcom are leading this innovation, investing heavily in R&D to develop efficient and cost-effective photonics solutions. The market's segmentation is likely driven by application (data centers, telecommunications, automotive, etc.), technology (silicon photonics, III-V semiconductors), and component type (transceivers, lasers, modulators, etc.), with data center applications currently dominating the market share. While the supply chain complexities and the relatively high cost of production currently pose challenges, the long-term outlook remains positive, with continued growth anticipated throughout the forecast period.
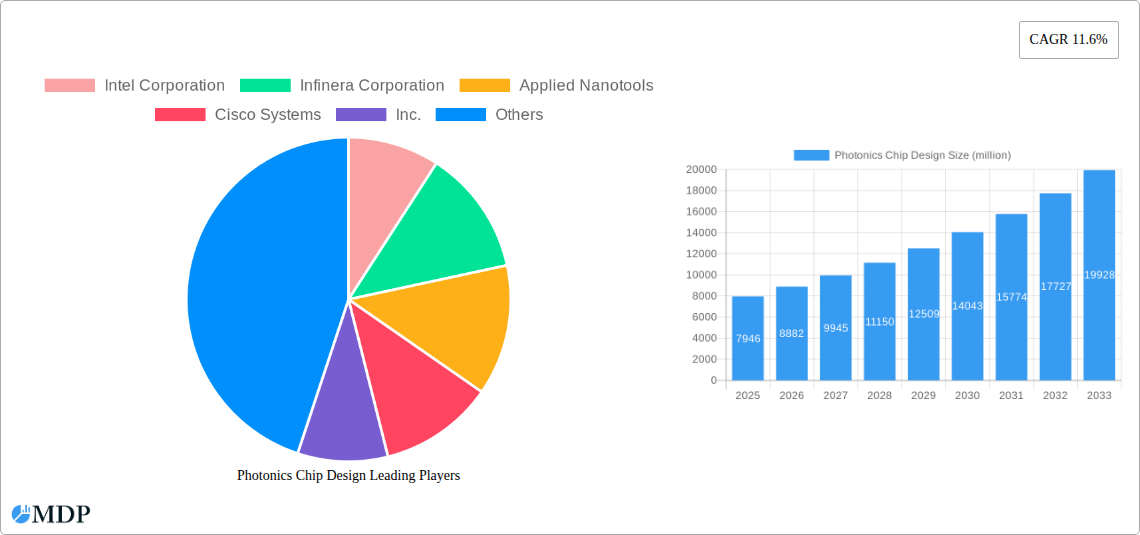
Photonics Chip Design Market Size (In Billion)
The Compound Annual Growth Rate (CAGR) of 11.6% projected for the period 2025-2033 indicates a significant expansion of the market. This growth will be fueled by ongoing technological innovation, increased investment in research and development, and the growing need for higher bandwidth and lower latency solutions across a wide range of industries. Competition among established players and emerging startups is likely to intensify, driving further innovation and potentially leading to mergers and acquisitions within the sector. Furthermore, government initiatives supporting the development and adoption of photonics technologies in various countries could significantly influence market dynamics. Strategic partnerships and collaborations between chip designers and system integrators are expected to shape the competitive landscape and accelerate market penetration.
Photonics Chip Design Company Market Share
Photonics Chip Design Market Report: 2019-2033
This comprehensive report provides an in-depth analysis of the global Photonics Chip Design market, offering invaluable insights for stakeholders, investors, and industry professionals. The report covers the period from 2019 to 2033, with a focus on the forecast period from 2025 to 2033 and a base year of 2025. The market is projected to reach $xx million by 2033, exhibiting a Compound Annual Growth Rate (CAGR) of xx% during the forecast period. This analysis incorporates data from key players such as Intel Corporation, Infinera Corporation, Applied Nanotools, Cisco Systems, Inc., Broadcom, Bright Photonics, Acacia, Marvell (Inphi), Ciena, Coherent, CMC Microsystems, ANELLO Photonics, Ansys, and Eoptolink, among others. This report is essential for understanding market dynamics, industry trends, and emerging opportunities in this rapidly evolving sector.
Photonics Chip Design Market Dynamics & Concentration
The global photonics chip design market is experiencing significant growth, driven by advancements in optical communication, data center infrastructure, and sensing technologies. Market concentration is relatively high, with a few major players holding substantial market share. In 2025, the top five companies are estimated to hold approximately xx% of the market share.
- Innovation Drivers: Miniaturization, higher bandwidth requirements, and the integration of functionalities are key drivers.
- Regulatory Frameworks: Government initiatives promoting high-speed communication networks are influencing market growth.
- Product Substitutes: While limited, alternative technologies such as electronic signal processing present some competition.
- End-User Trends: Increasing demand from data centers, telecommunication companies, and automotive industries is fueling market expansion.
- M&A Activities: The market has seen xx major mergers and acquisitions between 2019 and 2024, indicating a trend towards consolidation and expansion. For example, the merger of xx and xx significantly impacted market share dynamics.
Photonics Chip Design Industry Trends & Analysis
The photonics chip design market exhibits a robust growth trajectory, propelled by several significant factors. The global market size is estimated at $xx million in 2025, and it's projected to reach $xx million by 2033, representing a CAGR of xx%.
Several key factors contribute to this growth:
- Technological Disruptions: Advancements in silicon photonics, III-V semiconductor technologies, and integrated photonics are revolutionizing chip design capabilities.
- Market Growth Drivers: The surging demand for high-bandwidth data transmission, fueled by the proliferation of 5G networks, cloud computing, and the Internet of Things (IoT), is a significant driver.
- Consumer Preferences: The increasing need for faster, more reliable, and energy-efficient data transmission systems shapes the demand for advanced photonics chip designs.
- Competitive Dynamics: Intense competition among leading players is fostering innovation, driving down costs, and improving product performance. Market penetration rates for advanced designs are rising steadily, reaching an estimated xx% in 2025.
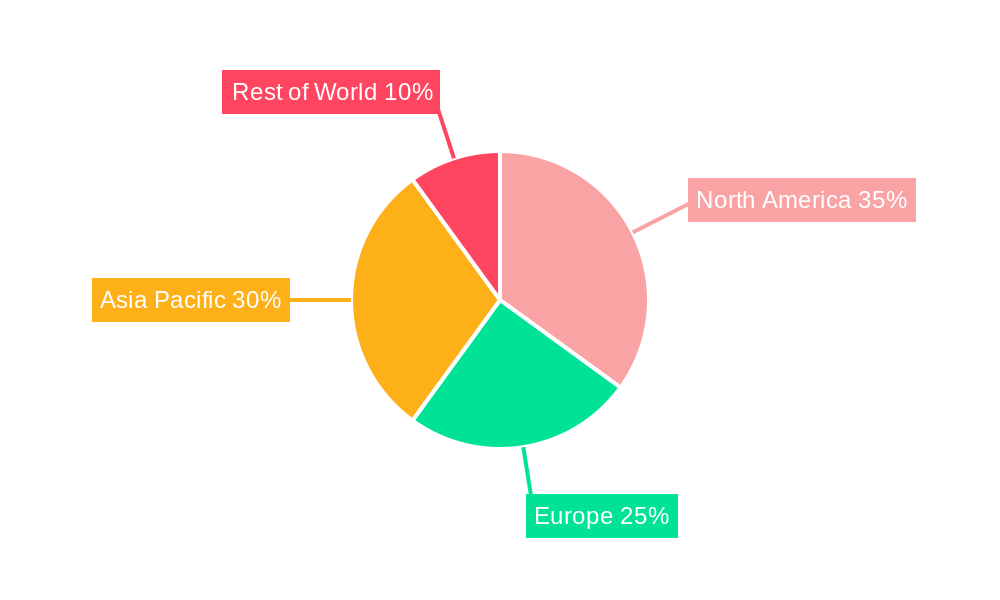
Leading Markets & Segments in Photonics Chip Design
North America currently dominates the photonics chip design market, holding the largest market share in 2025 due to strong technological advancements, substantial investments in R&D, and a high concentration of key players.
- Key Drivers in North America:
- Robust investment in research and development.
- Strong presence of leading technology companies.
- Well-established telecommunications infrastructure.
- Supportive government policies promoting technological innovation.
- Dominance Analysis: The region's advanced infrastructure, coupled with the high concentration of major players and substantial R&D spending, creates a synergistic effect driving market growth. This trend is anticipated to continue during the forecast period. Asia-Pacific is expected to witness the fastest growth due to increasing investments in telecommunication infrastructure and the rising adoption of data-intensive applications.
Photonics Chip Design Product Developments
Recent years have witnessed significant advancements in photonics chip design, with a focus on miniaturization, improved integration, and enhanced performance. New products incorporate advanced materials, packaging techniques, and fabrication processes. This leads to chips with higher bandwidth, lower power consumption, and better cost-effectiveness, directly impacting market competitiveness and driving adoption across various applications. Technological trends such as silicon photonics integration and advanced packaging are key factors in shaping product development.
Key Drivers of Photonics Chip Design Growth
Several factors are driving the growth of the photonics chip design market:
- Technological Advancements: Continuous advancements in silicon photonics, III-V semiconductors, and integrated photonics are enabling the development of higher-performance, more compact, and energy-efficient chips.
- Economic Factors: The increasing demand for high-speed data transmission in various sectors, including telecommunications, data centers, and automotive, is fueling market growth.
- Regulatory Support: Government initiatives and policies promoting the development and adoption of advanced communication technologies are further boosting market expansion.
Challenges in the Photonics Chip Design Market
Despite significant growth potential, the photonics chip design market faces certain challenges:
- High Development Costs: The development of advanced photonics chips requires significant investments in R&D, specialized equipment, and skilled personnel, impacting affordability. This leads to a higher barrier to entry for smaller companies.
- Supply Chain Disruptions: The global supply chain for specialized materials and components used in photonics chip manufacturing is susceptible to disruptions, potentially affecting production and market stability.
- Competitive Pressure: Intense competition among established players and emerging companies creates a dynamic and challenging environment.
Emerging Opportunities in Photonics Chip Design
The long-term growth of the photonics chip design market is fueled by several opportunities:
- Technological Breakthroughs: Continued advancements in materials science, fabrication techniques, and design methodologies are opening new avenues for innovation and market expansion. The development of integrated photonics systems and novel packaging solutions present significant growth opportunities. Strategic partnerships and collaborations between companies are becoming increasingly important to accelerate innovation and drive market expansion.
Leading Players in the Photonics Chip Design Sector
- Intel Corporation
- Infinera Corporation
- Applied Nanotools
- Cisco Systems, Inc.
- Broadcom
- Bright Photonics
- Acacia
- Marvell (Inphi)
- Ciena
- Coherent
- CMC Microsystems
- ANELLO Photonics
- Ansys
- Eoptolink
Key Milestones in Photonics Chip Design Industry
- 2020: Introduction of xx's new high-bandwidth photonics chip, significantly impacting data transmission capabilities.
- 2022: Merger of xx and xx, creating a major player in the market.
- 2023: Launch of xx's innovative silicon photonics platform, enabling increased integration and improved performance.
- 2024: Significant investment by xx in R&D for next-generation photonics chips.
Strategic Outlook for Photonics Chip Design Market
The photonics chip design market is poised for continued strong growth, driven by technological advancements, increasing demand from various sectors, and favorable regulatory support. Strategic partnerships, focused R&D investments, and the development of innovative products will be crucial for companies to maintain a competitive edge and capture market share in this rapidly evolving landscape. The market's future potential is substantial, with opportunities for expansion across various applications and geographical regions.
Photonics Chip Design Segmentation
-
1. Application
- 1.1. Telecom
- 1.2. Data Center
- 1.3. Quantum
- 1.4. Others
-
2. Types
- 2.1. Laser Chips (VCSEL, FP, DFB, EML)
- 2.2. Detector Chips (PIN and APD)
Photonics Chip Design Segmentation By Geography
-
1. North America
- 1.1. United States
- 1.2. Canada
- 1.3. Mexico
-
2. South America
- 2.1. Brazil
- 2.2. Argentina
- 2.3. Rest of South America
-
3. Europe
- 3.1. United Kingdom
- 3.2. Germany
- 3.3. France
- 3.4. Italy
- 3.5. Spain
- 3.6. Russia
- 3.7. Benelux
- 3.8. Nordics
- 3.9. Rest of Europe
-
4. Middle East & Africa
- 4.1. Turkey
- 4.2. Israel
- 4.3. GCC
- 4.4. North Africa
- 4.5. South Africa
- 4.6. Rest of Middle East & Africa
-
5. Asia Pacific
- 5.1. China
- 5.2. India
- 5.3. Japan
- 5.4. South Korea
- 5.5. ASEAN
- 5.6. Oceania
- 5.7. Rest of Asia Pacific
Photonics Chip Design Regional Market Share
Geographic Coverage of Photonics Chip Design
Photonics Chip Design REPORT HIGHLIGHTS
| Aspects | Details |
|---|---|
| Study Period | 2020-2034 |
| Base Year | 2025 |
| Estimated Year | 2026 |
| Forecast Period | 2026-2034 |
| Historical Period | 2020-2025 |
| Growth Rate | CAGR of 11.6% from 2020-2034 |
| Segmentation |
|
Table of Contents
- 1. Introduction
- 1.1. Research Scope
- 1.2. Market Segmentation
- 1.3. Research Objective
- 1.4. Definitions and Assumptions
- 2. Executive Summary
- 2.1. Market Snapshot
- 3. Market Dynamics
- 3.1. Market Drivers
- 3.2. Market Restrains
- 3.3. Market Trends
- 3.4. Market Opportunities
- 4. Market Factor Analysis
- 4.1. Porters Five Forces
- 4.1.1. Bargaining Power of Suppliers
- 4.1.2. Bargaining Power of Buyers
- 4.1.3. Threat of New Entrants
- 4.1.4. Threat of Substitutes
- 4.1.5. Competitive Rivalry
- 4.2. PESTEL analysis
- 4.3. BCG Analysis
- 4.3.1. Stars (High Growth, High Market Share)
- 4.3.2. Cash Cows (Low Growth, High Market Share)
- 4.3.3. Question Mark (High Growth, Low Market Share)
- 4.3.4. Dogs (Low Growth, Low Market Share)
- 4.4. Ansoff Matrix Analysis
- 4.5. Supply Chain Analysis
- 4.6. Regulatory Landscape
- 4.7. Current Market Potential and Opportunity Assessment (TAM–SAM–SOM Framework)
- 4.8. MDP Analyst Note
- 4.1. Porters Five Forces
- 5. Market Analysis, Insights and Forecast 2021-2033
- 5.1. Market Analysis, Insights and Forecast - by Application
- 5.1.1. Telecom
- 5.1.2. Data Center
- 5.1.3. Quantum
- 5.1.4. Others
- 5.2. Market Analysis, Insights and Forecast - by Types
- 5.2.1. Laser Chips (VCSEL, FP, DFB, EML)
- 5.2.2. Detector Chips (PIN and APD)
- 5.3. Market Analysis, Insights and Forecast - by Region
- 5.3.1. North America
- 5.3.2. South America
- 5.3.3. Europe
- 5.3.4. Middle East & Africa
- 5.3.5. Asia Pacific
- 5.1. Market Analysis, Insights and Forecast - by Application
- 6. Global Photonics Chip Design Analysis, Insights and Forecast, 2021-2033
- 6.1. Market Analysis, Insights and Forecast - by Application
- 6.1.1. Telecom
- 6.1.2. Data Center
- 6.1.3. Quantum
- 6.1.4. Others
- 6.2. Market Analysis, Insights and Forecast - by Types
- 6.2.1. Laser Chips (VCSEL, FP, DFB, EML)
- 6.2.2. Detector Chips (PIN and APD)
- 6.1. Market Analysis, Insights and Forecast - by Application
- 7. North America Photonics Chip Design Analysis, Insights and Forecast, 2020-2032
- 7.1. Market Analysis, Insights and Forecast - by Application
- 7.1.1. Telecom
- 7.1.2. Data Center
- 7.1.3. Quantum
- 7.1.4. Others
- 7.2. Market Analysis, Insights and Forecast - by Types
- 7.2.1. Laser Chips (VCSEL, FP, DFB, EML)
- 7.2.2. Detector Chips (PIN and APD)
- 7.1. Market Analysis, Insights and Forecast - by Application
- 8. South America Photonics Chip Design Analysis, Insights and Forecast, 2020-2032
- 8.1. Market Analysis, Insights and Forecast - by Application
- 8.1.1. Telecom
- 8.1.2. Data Center
- 8.1.3. Quantum
- 8.1.4. Others
- 8.2. Market Analysis, Insights and Forecast - by Types
- 8.2.1. Laser Chips (VCSEL, FP, DFB, EML)
- 8.2.2. Detector Chips (PIN and APD)
- 8.1. Market Analysis, Insights and Forecast - by Application
- 9. Europe Photonics Chip Design Analysis, Insights and Forecast, 2020-2032
- 9.1. Market Analysis, Insights and Forecast - by Application
- 9.1.1. Telecom
- 9.1.2. Data Center
- 9.1.3. Quantum
- 9.1.4. Others
- 9.2. Market Analysis, Insights and Forecast - by Types
- 9.2.1. Laser Chips (VCSEL, FP, DFB, EML)
- 9.2.2. Detector Chips (PIN and APD)
- 9.1. Market Analysis, Insights and Forecast - by Application
- 10. Middle East & Africa Photonics Chip Design Analysis, Insights and Forecast, 2020-2032
- 10.1. Market Analysis, Insights and Forecast - by Application
- 10.1.1. Telecom
- 10.1.2. Data Center
- 10.1.3. Quantum
- 10.1.4. Others
- 10.2. Market Analysis, Insights and Forecast - by Types
- 10.2.1. Laser Chips (VCSEL, FP, DFB, EML)
- 10.2.2. Detector Chips (PIN and APD)
- 10.1. Market Analysis, Insights and Forecast - by Application
- 11. Asia Pacific Photonics Chip Design Analysis, Insights and Forecast, 2020-2032
- 11.1. Market Analysis, Insights and Forecast - by Application
- 11.1.1. Telecom
- 11.1.2. Data Center
- 11.1.3. Quantum
- 11.1.4. Others
- 11.2. Market Analysis, Insights and Forecast - by Types
- 11.2.1. Laser Chips (VCSEL, FP, DFB, EML)
- 11.2.2. Detector Chips (PIN and APD)
- 11.1. Market Analysis, Insights and Forecast - by Application
- 12. Competitive Analysis
- 12.1. Company Profiles
- 12.1.1 Intel Corporation
- 12.1.1.1. Company Overview
- 12.1.1.2. Products
- 12.1.1.3. Company Financials
- 12.1.1.4. SWOT Analysis
- 12.1.2 Infinera Corporation
- 12.1.2.1. Company Overview
- 12.1.2.2. Products
- 12.1.2.3. Company Financials
- 12.1.2.4. SWOT Analysis
- 12.1.3 Applied Nanotools
- 12.1.3.1. Company Overview
- 12.1.3.2. Products
- 12.1.3.3. Company Financials
- 12.1.3.4. SWOT Analysis
- 12.1.4 Cisco Systems
- 12.1.4.1. Company Overview
- 12.1.4.2. Products
- 12.1.4.3. Company Financials
- 12.1.4.4. SWOT Analysis
- 12.1.5 Inc.
- 12.1.5.1. Company Overview
- 12.1.5.2. Products
- 12.1.5.3. Company Financials
- 12.1.5.4. SWOT Analysis
- 12.1.6 Broadcom
- 12.1.6.1. Company Overview
- 12.1.6.2. Products
- 12.1.6.3. Company Financials
- 12.1.6.4. SWOT Analysis
- 12.1.7 Bright Photonics
- 12.1.7.1. Company Overview
- 12.1.7.2. Products
- 12.1.7.3. Company Financials
- 12.1.7.4. SWOT Analysis
- 12.1.8 Acacia
- 12.1.8.1. Company Overview
- 12.1.8.2. Products
- 12.1.8.3. Company Financials
- 12.1.8.4. SWOT Analysis
- 12.1.9 Marvell (Inphi)
- 12.1.9.1. Company Overview
- 12.1.9.2. Products
- 12.1.9.3. Company Financials
- 12.1.9.4. SWOT Analysis
- 12.1.10 Ciena
- 12.1.10.1. Company Overview
- 12.1.10.2. Products
- 12.1.10.3. Company Financials
- 12.1.10.4. SWOT Analysis
- 12.1.11 Coherent
- 12.1.11.1. Company Overview
- 12.1.11.2. Products
- 12.1.11.3. Company Financials
- 12.1.11.4. SWOT Analysis
- 12.1.12 CMC Microsystems
- 12.1.12.1. Company Overview
- 12.1.12.2. Products
- 12.1.12.3. Company Financials
- 12.1.12.4. SWOT Analysis
- 12.1.13 ANELLO Photonics
- 12.1.13.1. Company Overview
- 12.1.13.2. Products
- 12.1.13.3. Company Financials
- 12.1.13.4. SWOT Analysis
- 12.1.14 Ansys
- 12.1.14.1. Company Overview
- 12.1.14.2. Products
- 12.1.14.3. Company Financials
- 12.1.14.4. SWOT Analysis
- 12.1.15 Eoptolink
- 12.1.15.1. Company Overview
- 12.1.15.2. Products
- 12.1.15.3. Company Financials
- 12.1.15.4. SWOT Analysis
- 12.1.1 Intel Corporation
- 12.2. Market Entropy
- 12.2.1 Company's Key Areas Served
- 12.2.2 Recent Developments
- 12.3. Company Market Share Analysis 2025
- 12.3.1 Top 5 Companies Market Share Analysis
- 12.3.2 Top 3 Companies Market Share Analysis
- 12.4. List of Potential Customers
- 13. Research Methodology
List of Figures
- Figure 1: Global Photonics Chip Design Revenue Breakdown (million, %) by Region 2025 & 2033
- Figure 2: North America Photonics Chip Design Revenue (million), by Application 2025 & 2033
- Figure 3: North America Photonics Chip Design Revenue Share (%), by Application 2025 & 2033
- Figure 4: North America Photonics Chip Design Revenue (million), by Types 2025 & 2033
- Figure 5: North America Photonics Chip Design Revenue Share (%), by Types 2025 & 2033
- Figure 6: North America Photonics Chip Design Revenue (million), by Country 2025 & 2033
- Figure 7: North America Photonics Chip Design Revenue Share (%), by Country 2025 & 2033
- Figure 8: South America Photonics Chip Design Revenue (million), by Application 2025 & 2033
- Figure 9: South America Photonics Chip Design Revenue Share (%), by Application 2025 & 2033
- Figure 10: South America Photonics Chip Design Revenue (million), by Types 2025 & 2033
- Figure 11: South America Photonics Chip Design Revenue Share (%), by Types 2025 & 2033
- Figure 12: South America Photonics Chip Design Revenue (million), by Country 2025 & 2033
- Figure 13: South America Photonics Chip Design Revenue Share (%), by Country 2025 & 2033
- Figure 14: Europe Photonics Chip Design Revenue (million), by Application 2025 & 2033
- Figure 15: Europe Photonics Chip Design Revenue Share (%), by Application 2025 & 2033
- Figure 16: Europe Photonics Chip Design Revenue (million), by Types 2025 & 2033
- Figure 17: Europe Photonics Chip Design Revenue Share (%), by Types 2025 & 2033
- Figure 18: Europe Photonics Chip Design Revenue (million), by Country 2025 & 2033
- Figure 19: Europe Photonics Chip Design Revenue Share (%), by Country 2025 & 2033
- Figure 20: Middle East & Africa Photonics Chip Design Revenue (million), by Application 2025 & 2033
- Figure 21: Middle East & Africa Photonics Chip Design Revenue Share (%), by Application 2025 & 2033
- Figure 22: Middle East & Africa Photonics Chip Design Revenue (million), by Types 2025 & 2033
- Figure 23: Middle East & Africa Photonics Chip Design Revenue Share (%), by Types 2025 & 2033
- Figure 24: Middle East & Africa Photonics Chip Design Revenue (million), by Country 2025 & 2033
- Figure 25: Middle East & Africa Photonics Chip Design Revenue Share (%), by Country 2025 & 2033
- Figure 26: Asia Pacific Photonics Chip Design Revenue (million), by Application 2025 & 2033
- Figure 27: Asia Pacific Photonics Chip Design Revenue Share (%), by Application 2025 & 2033
- Figure 28: Asia Pacific Photonics Chip Design Revenue (million), by Types 2025 & 2033
- Figure 29: Asia Pacific Photonics Chip Design Revenue Share (%), by Types 2025 & 2033
- Figure 30: Asia Pacific Photonics Chip Design Revenue (million), by Country 2025 & 2033
- Figure 31: Asia Pacific Photonics Chip Design Revenue Share (%), by Country 2025 & 2033
List of Tables
- Table 1: Global Photonics Chip Design Revenue million Forecast, by Application 2020 & 2033
- Table 2: Global Photonics Chip Design Revenue million Forecast, by Types 2020 & 2033
- Table 3: Global Photonics Chip Design Revenue million Forecast, by Region 2020 & 2033
- Table 4: Global Photonics Chip Design Revenue million Forecast, by Application 2020 & 2033
- Table 5: Global Photonics Chip Design Revenue million Forecast, by Types 2020 & 2033
- Table 6: Global Photonics Chip Design Revenue million Forecast, by Country 2020 & 2033
- Table 7: United States Photonics Chip Design Revenue (million) Forecast, by Application 2020 & 2033
- Table 8: Canada Photonics Chip Design Revenue (million) Forecast, by Application 2020 & 2033
- Table 9: Mexico Photonics Chip Design Revenue (million) Forecast, by Application 2020 & 2033
- Table 10: Global Photonics Chip Design Revenue million Forecast, by Application 2020 & 2033
- Table 11: Global Photonics Chip Design Revenue million Forecast, by Types 2020 & 2033
- Table 12: Global Photonics Chip Design Revenue million Forecast, by Country 2020 & 2033
- Table 13: Brazil Photonics Chip Design Revenue (million) Forecast, by Application 2020 & 2033
- Table 14: Argentina Photonics Chip Design Revenue (million) Forecast, by Application 2020 & 2033
- Table 15: Rest of South America Photonics Chip Design Revenue (million) Forecast, by Application 2020 & 2033
- Table 16: Global Photonics Chip Design Revenue million Forecast, by Application 2020 & 2033
- Table 17: Global Photonics Chip Design Revenue million Forecast, by Types 2020 & 2033
- Table 18: Global Photonics Chip Design Revenue million Forecast, by Country 2020 & 2033
- Table 19: United Kingdom Photonics Chip Design Revenue (million) Forecast, by Application 2020 & 2033
- Table 20: Germany Photonics Chip Design Revenue (million) Forecast, by Application 2020 & 2033
- Table 21: France Photonics Chip Design Revenue (million) Forecast, by Application 2020 & 2033
- Table 22: Italy Photonics Chip Design Revenue (million) Forecast, by Application 2020 & 2033
- Table 23: Spain Photonics Chip Design Revenue (million) Forecast, by Application 2020 & 2033
- Table 24: Russia Photonics Chip Design Revenue (million) Forecast, by Application 2020 & 2033
- Table 25: Benelux Photonics Chip Design Revenue (million) Forecast, by Application 2020 & 2033
- Table 26: Nordics Photonics Chip Design Revenue (million) Forecast, by Application 2020 & 2033
- Table 27: Rest of Europe Photonics Chip Design Revenue (million) Forecast, by Application 2020 & 2033
- Table 28: Global Photonics Chip Design Revenue million Forecast, by Application 2020 & 2033
- Table 29: Global Photonics Chip Design Revenue million Forecast, by Types 2020 & 2033
- Table 30: Global Photonics Chip Design Revenue million Forecast, by Country 2020 & 2033
- Table 31: Turkey Photonics Chip Design Revenue (million) Forecast, by Application 2020 & 2033
- Table 32: Israel Photonics Chip Design Revenue (million) Forecast, by Application 2020 & 2033
- Table 33: GCC Photonics Chip Design Revenue (million) Forecast, by Application 2020 & 2033
- Table 34: North Africa Photonics Chip Design Revenue (million) Forecast, by Application 2020 & 2033
- Table 35: South Africa Photonics Chip Design Revenue (million) Forecast, by Application 2020 & 2033
- Table 36: Rest of Middle East & Africa Photonics Chip Design Revenue (million) Forecast, by Application 2020 & 2033
- Table 37: Global Photonics Chip Design Revenue million Forecast, by Application 2020 & 2033
- Table 38: Global Photonics Chip Design Revenue million Forecast, by Types 2020 & 2033
- Table 39: Global Photonics Chip Design Revenue million Forecast, by Country 2020 & 2033
- Table 40: China Photonics Chip Design Revenue (million) Forecast, by Application 2020 & 2033
- Table 41: India Photonics Chip Design Revenue (million) Forecast, by Application 2020 & 2033
- Table 42: Japan Photonics Chip Design Revenue (million) Forecast, by Application 2020 & 2033
- Table 43: South Korea Photonics Chip Design Revenue (million) Forecast, by Application 2020 & 2033
- Table 44: ASEAN Photonics Chip Design Revenue (million) Forecast, by Application 2020 & 2033
- Table 45: Oceania Photonics Chip Design Revenue (million) Forecast, by Application 2020 & 2033
- Table 46: Rest of Asia Pacific Photonics Chip Design Revenue (million) Forecast, by Application 2020 & 2033
Frequently Asked Questions
1. What is the projected Compound Annual Growth Rate (CAGR) of the Photonics Chip Design?
The projected CAGR is approximately 11.6%.
2. Which companies are prominent players in the Photonics Chip Design?
Key companies in the market include Intel Corporation, Infinera Corporation, Applied Nanotools, Cisco Systems, Inc., Broadcom, Bright Photonics, Acacia, Marvell (Inphi), Ciena, Coherent, CMC Microsystems, ANELLO Photonics, Ansys, Eoptolink.
3. What are the main segments of the Photonics Chip Design?
The market segments include Application, Types.
4. Can you provide details about the market size?
The market size is estimated to be USD 7946 million as of 2022.
5. What are some drivers contributing to market growth?
N/A
6. What are the notable trends driving market growth?
N/A
7. Are there any restraints impacting market growth?
N/A
8. Can you provide examples of recent developments in the market?
N/A
9. What pricing options are available for accessing the report?
Pricing options include single-user, multi-user, and enterprise licenses priced at USD 3950.00, USD 5925.00, and USD 7900.00 respectively.
10. Is the market size provided in terms of value or volume?
The market size is provided in terms of value, measured in million.
11. Are there any specific market keywords associated with the report?
Yes, the market keyword associated with the report is "Photonics Chip Design," which aids in identifying and referencing the specific market segment covered.
12. How do I determine which pricing option suits my needs best?
The pricing options vary based on user requirements and access needs. Individual users may opt for single-user licenses, while businesses requiring broader access may choose multi-user or enterprise licenses for cost-effective access to the report.
13. Are there any additional resources or data provided in the Photonics Chip Design report?
While the report offers comprehensive insights, it's advisable to review the specific contents or supplementary materials provided to ascertain if additional resources or data are available.
14. How can I stay updated on further developments or reports in the Photonics Chip Design?
To stay informed about further developments, trends, and reports in the Photonics Chip Design, consider subscribing to industry newsletters, following relevant companies and organizations, or regularly checking reputable industry news sources and publications.
Methodology
Step 1 - Identification of Relevant Samples Size from Population Database


Step 2 - Approaches for Defining Global Market Size (Value, Volume* & Price*)

Note*: In applicable scenarios
Step 3 - Data Sources
Primary Research
- Web Analytics
- Survey Reports
- Research Institute
- Latest Research Reports
- Opinion Leaders
Secondary Research
- Annual Reports
- White Paper
- Latest Press Release
- Industry Association
- Paid Database
- Investor Presentations

Step 4 - Data Triangulation
Involves using different sources of information in order to increase the validity of a study
These sources are likely to be stakeholders in a program - participants, other researchers, program staff, other community members, and so on.
Then we put all data in single framework & apply various statistical tools to find out the dynamic on the market.
During the analysis stage, feedback from the stakeholder groups would be compared to determine areas of agreement as well as areas of divergence