

Key Insights
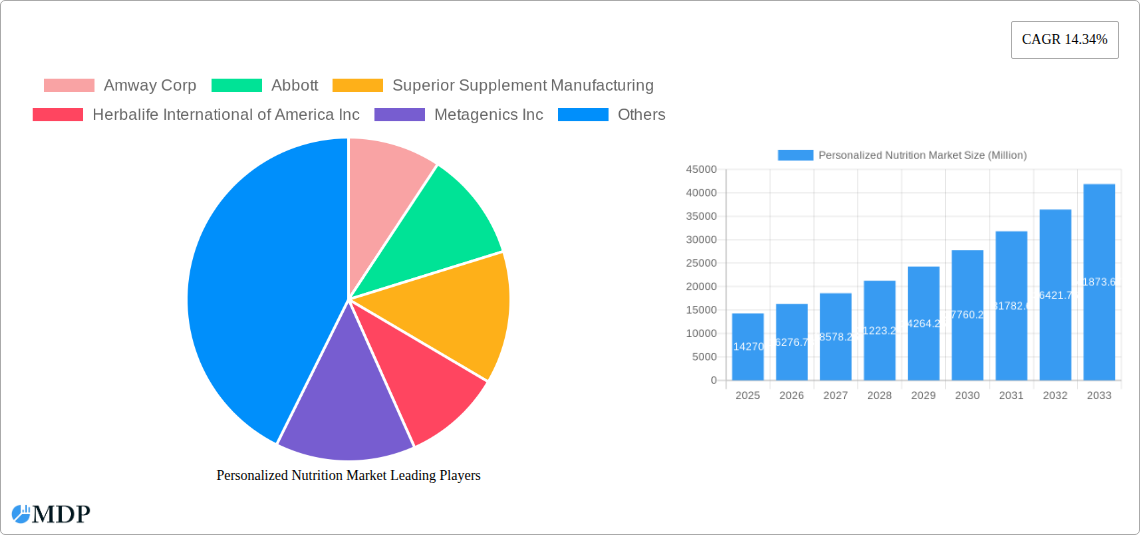
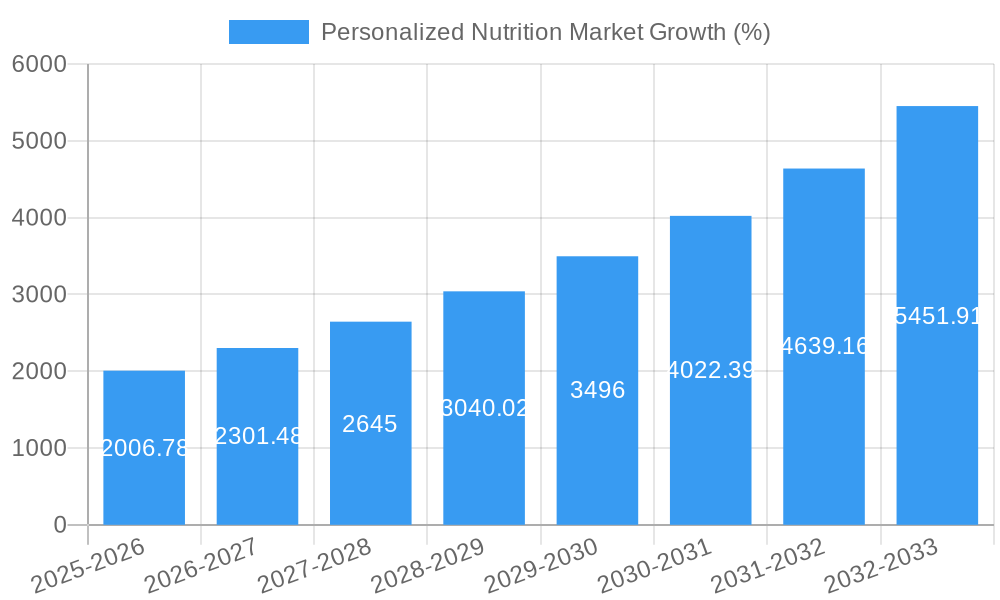
The personalized nutrition market is experiencing robust growth, projected to reach $14.27 billion in 2025 and exhibiting a Compound Annual Growth Rate (CAGR) of 14.34% from 2025 to 2033. This expansion is fueled by several key drivers. Increasing consumer awareness of the link between diet and overall health, coupled with the rising prevalence of chronic diseases like diabetes and obesity, is driving demand for tailored nutritional solutions. Advancements in genomics, microbiome analysis, and data analytics are enabling more precise and effective personalized nutrition plans. The increasing availability of wearable technology and health tracking apps further enhances data collection and personalized recommendations. Furthermore, the growing popularity of direct-to-consumer genetic testing and personalized supplement brands caters to the increasing consumer preference for convenient and customized solutions. Major market players, including Amway Corp, Abbott, and Herbalife, are actively investing in research and development to refine their offerings and leverage these trends.
The market segmentation is likely diverse, encompassing various product categories such as customized supplements, meal plans, and genetic testing kits. Geographic variations in consumer preferences and healthcare infrastructure will also influence market performance. While the market faces challenges such as high initial costs of personalized plans and potential data privacy concerns, ongoing technological innovations and increasing affordability are expected to mitigate these constraints. The continued expansion of telehealth and remote healthcare platforms is likely to further fuel market growth by creating convenient access to personalized nutrition services. The forecast period of 2025-2033 presents significant opportunities for industry players to capitalize on the growing demand for preventative healthcare and personalized wellness solutions. Competitive strategies will focus on data-driven personalization, innovative product development, and strategic partnerships to strengthen market position.
Personalized Nutrition Market: A Comprehensive Report (2019-2033)
This in-depth report provides a comprehensive analysis of the Personalized Nutrition Market, offering valuable insights for stakeholders across the industry. With a study period spanning 2019-2033, a base year of 2025, and a forecast period of 2025-2033, this report unveils the market's dynamic landscape, growth drivers, and future trajectory. The market is estimated to be worth xx Million in 2025 and projected to reach xx Million by 2033, exhibiting a CAGR of xx%. Key players like Amway Corp, Abbott, Superior Supplement Manufacturing, Herbalife International of America Inc, Metagenics Inc, GX Sciences LLC, Nutralliance, Divine Design Manufacturing, Archer Daniels Midland Company (ADM), and Viome Life Sciences Inc. (among others) are shaping the market's evolution.
Personalized Nutrition Market Market Dynamics & Concentration
The Personalized Nutrition Market is characterized by moderate concentration, with a few major players holding significant market share, while numerous smaller companies focus on niche segments. Market share is primarily driven by brand recognition, product innovation, and effective distribution networks. Innovation is a key driver, fueled by advancements in genomics, metabolomics, and data analytics. Regulatory frameworks, while still evolving, are increasingly focused on ensuring product safety and efficacy. The market experiences competitive pressure from traditional nutritional supplement manufacturers and alternative healthcare approaches. Mergers and acquisitions (M&A) activity is moderate, with approximately xx M&A deals recorded in the historical period (2019-2024), indicating a consolidating market.
- Market Concentration: Moderately concentrated, with the top 5 players holding approximately xx% of the market share in 2024.
- Innovation Drivers: Advancements in genomics, AI-powered personalized recommendations, and improved data analytics.
- Regulatory Frameworks: Evolving regulations focused on product safety, labeling accuracy, and data privacy.
- Product Substitutes: Traditional dietary supplements, functional foods, and general wellness programs.
- End-User Trends: Growing awareness of personalized health management and proactive wellness practices.
- M&A Activity: xx M&A deals between 2019 and 2024, suggesting industry consolidation.
Personalized Nutrition Market Industry Trends & Analysis
The Personalized Nutrition Market is experiencing robust growth, propelled by several key factors. Rising consumer awareness of the benefits of tailored nutrition, coupled with increasing disposable incomes, fuels market expansion. Technological advancements, such as advancements in genetic testing and AI-driven dietary recommendations, are transforming the industry. The market's growth is further supported by the rising prevalence of chronic diseases and the growing demand for preventive healthcare solutions. The competitive landscape is dynamic, with established players and emerging startups vying for market share through innovation and strategic partnerships. The market penetration of personalized nutrition products is increasing steadily, with xx% of the target population currently using such products in 2024.
Leading Markets & Segments in Personalized Nutrition Market
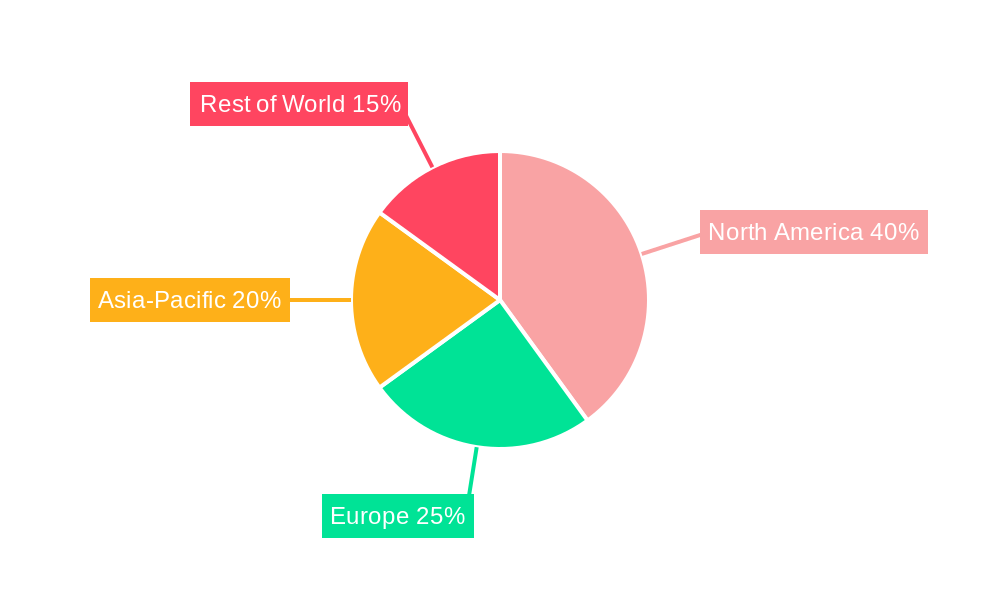
North America currently dominates the Personalized Nutrition Market, driven by high healthcare expenditure, high adoption of advanced technologies, and a strong consumer preference for personalized health solutions. Europe follows closely, with strong growth projected in the coming years. Key drivers for regional dominance include:
- North America: High disposable incomes, advanced healthcare infrastructure, strong technological adoption, and early market maturity.
- Europe: Growing awareness of personalized health, expanding adoption of digital health technologies, and increasing prevalence of chronic diseases.
- Asia-Pacific: Rapid economic growth, rising middle-class population, and increasing awareness of preventive healthcare.
The key segment driving growth is the direct-to-consumer (DTC) segment, offering personalized nutrition products directly to consumers through online channels. This segment is characterized by a high level of customization, convenience, and accessibility.
Personalized Nutrition Market Product Developments
Recent product innovations focus on utilizing advanced technologies to analyze individual genetic profiles, gut microbiome, and lifestyle factors to provide highly tailored nutritional recommendations and products. This includes advanced supplement formulations, customized meal plans, and digital platforms integrating various data sources for optimized results. These innovations enhance product efficacy, personalization, and convenience, attracting a wider consumer base. Technological trends include the integration of AI, machine learning, and wearable technologies for continuous monitoring and adaptive recommendations.
Key Drivers of Personalized Nutrition Market Growth
Several factors contribute to the growth of the Personalized Nutrition Market:
- Technological Advancements: Sophisticated genetic testing, microbiome analysis, and AI-powered dietary recommendations.
- Rising Healthcare Expenditure: Increasing investments in preventive healthcare and personalized medicine.
- Growing Consumer Awareness: Heightened focus on proactive health management and customized wellness plans.
- Favorable Regulatory Environment: The evolving regulatory landscape that supports innovation while ensuring safety and efficacy.
Challenges in the Personalized Nutrition Market Market
Despite substantial growth potential, the Personalized Nutrition Market faces certain challenges:
- High Initial Costs: Genetic testing and personalized supplement formulations can be expensive, limiting accessibility.
- Data Privacy Concerns: Safeguarding sensitive user data remains a crucial concern.
- Regulatory Complexity: The ever-evolving regulatory landscape requires continuous compliance and can impede growth.
- Competition: Intense competition from established players and emerging startups necessitates constant innovation and adaptability.
Emerging Opportunities in Personalized Nutrition Market
Long-term growth is driven by several factors including the integration of telehealth and wearable technology for seamless health monitoring and tailored advice, expansion into untapped markets and demographics, and strategic collaborations between nutrition companies, healthcare providers, and technology firms to offer holistic wellness solutions. These opportunities collectively present a promising future for the Personalized Nutrition Market.
Leading Players in the Personalized Nutrition Market Sector
- Amway Corp
- Abbott
- Superior Supplement Manufacturing
- Herbalife International of America Inc
- Metagenics Inc
- GX Sciences LLC
- Nutralliance
- Divine Design Manufacturing
- Archer Daniels Midland Company (ADM)
- Viome Life Sciences Inc
- List Not Exhaustive
Key Milestones in Personalized Nutrition Market Industry
- February 2024: Riise launched personalized microgranule nutrient blends, simplifying supplement intake and enhancing personalization. This innovation addresses consumer demand for convenience and targeted nutrient delivery.
- September 2024: Bioniq's partnership with Truemed enables HSA/FSA reimbursement for its supplements, expanding market accessibility and positioning personalized nutrition as a medically necessary preventive care option. This signals a shift in market perception and increased consumer adoption.
Strategic Outlook for Personalized Nutrition Market Market
The Personalized Nutrition Market exhibits strong potential for future growth, driven by continued technological innovation, increasing consumer awareness of personalized health, and expanding accessibility via healthcare integrations and strategic partnerships. The future will witness greater integration of personalized nutrition into mainstream healthcare, creating new revenue streams and accelerating market penetration. Companies that leverage advanced technologies, prioritize data privacy, and adapt to evolving consumer needs will be best positioned to capitalize on the market's long-term opportunities.
Personalized Nutrition Market Segmentation
-
1. Product Type
- 1.1. Active Measurement
- 1.2. Standard Measurement
-
2. Application
- 2.1. Standard Supplements
- 2.2. Disease-based
-
3. End User
- 3.1. Direct-to-Consumer
- 3.2. Wellness and Fitness Centers
- 3.3. Hospitals and Clinics
- 3.4. Research Institutions
Personalized Nutrition Market Segmentation By Geography
-
1. North America
- 1.1. United States
- 1.2. Canada
- 1.3. Mexico
-
2. Europe
- 2.1. Germany
- 2.2. United Kingdom
- 2.3. France
- 2.4. Italy
- 2.5. Spain
- 2.6. Rest of Europe
-
3. Asia Pacific
- 3.1. China
- 3.2. Japan
- 3.3. India
- 3.4. Australia
- 3.5. South Korea
- 3.6. Rest of Asia Pacific
-
4. Middle East and Africa
- 4.1. GCC
- 4.2. South Africa
- 4.3. Rest of Middle East and Africa
-
5. South America
- 5.1. Brazil
- 5.2. Argentina
- 5.3. Rest of South America
Personalized Nutrition Market REPORT HIGHLIGHTS
| Aspects | Details |
|---|---|
| Study Period | 2019-2033 |
| Base Year | 2024 |
| Estimated Year | 2025 |
| Forecast Period | 2025-2033 |
| Historical Period | 2019-2024 |
| Growth Rate | CAGR of 14.34% from 2019-2033 |
| Segmentation |
|
Table of Contents
- 1. Introduction
- 1.1. Research Scope
- 1.2. Market Segmentation
- 1.3. Research Methodology
- 1.4. Definitions and Assumptions
- 2. Executive Summary
- 2.1. Introduction
- 3. Market Dynamics
- 3.1. Introduction
- 3.2. Market Drivers
- 3.2.1. Shift in Consumer Preference Due to a Rise in Health Awareness; Increasing Burden of Chronic Diseases and Geriatric Population; Technological Advancements and Growing Trend of Digital Healthcare
- 3.3. Market Restrains
- 3.3.1. Shift in Consumer Preference Due to a Rise in Health Awareness; Increasing Burden of Chronic Diseases and Geriatric Population; Technological Advancements and Growing Trend of Digital Healthcare
- 3.4. Market Trends
- 3.4.1. Disease-based Segment Expected to Hold a Significant Share Over the Forecast Period
- 4. Market Factor Analysis
- 4.1. Porters Five Forces
- 4.2. Supply/Value Chain
- 4.3. PESTEL analysis
- 4.4. Market Entropy
- 4.5. Patent/Trademark Analysis
- 5. Global Personalized Nutrition Market Analysis, Insights and Forecast, 2019-2031
- 5.1. Market Analysis, Insights and Forecast - by Product Type
- 5.1.1. Active Measurement
- 5.1.2. Standard Measurement
- 5.2. Market Analysis, Insights and Forecast - by Application
- 5.2.1. Standard Supplements
- 5.2.2. Disease-based
- 5.3. Market Analysis, Insights and Forecast - by End User
- 5.3.1. Direct-to-Consumer
- 5.3.2. Wellness and Fitness Centers
- 5.3.3. Hospitals and Clinics
- 5.3.4. Research Institutions
- 5.4. Market Analysis, Insights and Forecast - by Region
- 5.4.1. North America
- 5.4.2. Europe
- 5.4.3. Asia Pacific
- 5.4.4. Middle East and Africa
- 5.4.5. South America
- 5.1. Market Analysis, Insights and Forecast - by Product Type
- 6. North America Personalized Nutrition Market Analysis, Insights and Forecast, 2019-2031
- 6.1. Market Analysis, Insights and Forecast - by Product Type
- 6.1.1. Active Measurement
- 6.1.2. Standard Measurement
- 6.2. Market Analysis, Insights and Forecast - by Application
- 6.2.1. Standard Supplements
- 6.2.2. Disease-based
- 6.3. Market Analysis, Insights and Forecast - by End User
- 6.3.1. Direct-to-Consumer
- 6.3.2. Wellness and Fitness Centers
- 6.3.3. Hospitals and Clinics
- 6.3.4. Research Institutions
- 6.1. Market Analysis, Insights and Forecast - by Product Type
- 7. Europe Personalized Nutrition Market Analysis, Insights and Forecast, 2019-2031
- 7.1. Market Analysis, Insights and Forecast - by Product Type
- 7.1.1. Active Measurement
- 7.1.2. Standard Measurement
- 7.2. Market Analysis, Insights and Forecast - by Application
- 7.2.1. Standard Supplements
- 7.2.2. Disease-based
- 7.3. Market Analysis, Insights and Forecast - by End User
- 7.3.1. Direct-to-Consumer
- 7.3.2. Wellness and Fitness Centers
- 7.3.3. Hospitals and Clinics
- 7.3.4. Research Institutions
- 7.1. Market Analysis, Insights and Forecast - by Product Type
- 8. Asia Pacific Personalized Nutrition Market Analysis, Insights and Forecast, 2019-2031
- 8.1. Market Analysis, Insights and Forecast - by Product Type
- 8.1.1. Active Measurement
- 8.1.2. Standard Measurement
- 8.2. Market Analysis, Insights and Forecast - by Application
- 8.2.1. Standard Supplements
- 8.2.2. Disease-based
- 8.3. Market Analysis, Insights and Forecast - by End User
- 8.3.1. Direct-to-Consumer
- 8.3.2. Wellness and Fitness Centers
- 8.3.3. Hospitals and Clinics
- 8.3.4. Research Institutions
- 8.1. Market Analysis, Insights and Forecast - by Product Type
- 9. Middle East and Africa Personalized Nutrition Market Analysis, Insights and Forecast, 2019-2031
- 9.1. Market Analysis, Insights and Forecast - by Product Type
- 9.1.1. Active Measurement
- 9.1.2. Standard Measurement
- 9.2. Market Analysis, Insights and Forecast - by Application
- 9.2.1. Standard Supplements
- 9.2.2. Disease-based
- 9.3. Market Analysis, Insights and Forecast - by End User
- 9.3.1. Direct-to-Consumer
- 9.3.2. Wellness and Fitness Centers
- 9.3.3. Hospitals and Clinics
- 9.3.4. Research Institutions
- 9.1. Market Analysis, Insights and Forecast - by Product Type
- 10. South America Personalized Nutrition Market Analysis, Insights and Forecast, 2019-2031
- 10.1. Market Analysis, Insights and Forecast - by Product Type
- 10.1.1. Active Measurement
- 10.1.2. Standard Measurement
- 10.2. Market Analysis, Insights and Forecast - by Application
- 10.2.1. Standard Supplements
- 10.2.2. Disease-based
- 10.3. Market Analysis, Insights and Forecast - by End User
- 10.3.1. Direct-to-Consumer
- 10.3.2. Wellness and Fitness Centers
- 10.3.3. Hospitals and Clinics
- 10.3.4. Research Institutions
- 10.1. Market Analysis, Insights and Forecast - by Product Type
- 11. Competitive Analysis
- 11.1. Global Market Share Analysis 2024
- 11.2. Company Profiles
- 11.2.1 Amway Corp
- 11.2.1.1. Overview
- 11.2.1.2. Products
- 11.2.1.3. SWOT Analysis
- 11.2.1.4. Recent Developments
- 11.2.1.5. Financials (Based on Availability)
- 11.2.2 Abbott
- 11.2.2.1. Overview
- 11.2.2.2. Products
- 11.2.2.3. SWOT Analysis
- 11.2.2.4. Recent Developments
- 11.2.2.5. Financials (Based on Availability)
- 11.2.3 Superior Supplement Manufacturing
- 11.2.3.1. Overview
- 11.2.3.2. Products
- 11.2.3.3. SWOT Analysis
- 11.2.3.4. Recent Developments
- 11.2.3.5. Financials (Based on Availability)
- 11.2.4 Herbalife International of America Inc
- 11.2.4.1. Overview
- 11.2.4.2. Products
- 11.2.4.3. SWOT Analysis
- 11.2.4.4. Recent Developments
- 11.2.4.5. Financials (Based on Availability)
- 11.2.5 Metagenics Inc
- 11.2.5.1. Overview
- 11.2.5.2. Products
- 11.2.5.3. SWOT Analysis
- 11.2.5.4. Recent Developments
- 11.2.5.5. Financials (Based on Availability)
- 11.2.6 GX Sciences LLC
- 11.2.6.1. Overview
- 11.2.6.2. Products
- 11.2.6.3. SWOT Analysis
- 11.2.6.4. Recent Developments
- 11.2.6.5. Financials (Based on Availability)
- 11.2.7 Nutralliance
- 11.2.7.1. Overview
- 11.2.7.2. Products
- 11.2.7.3. SWOT Analysis
- 11.2.7.4. Recent Developments
- 11.2.7.5. Financials (Based on Availability)
- 11.2.8 Divine Design Manufacturing
- 11.2.8.1. Overview
- 11.2.8.2. Products
- 11.2.8.3. SWOT Analysis
- 11.2.8.4. Recent Developments
- 11.2.8.5. Financials (Based on Availability)
- 11.2.9 Archer Daniels Midland Company (ADM)
- 11.2.9.1. Overview
- 11.2.9.2. Products
- 11.2.9.3. SWOT Analysis
- 11.2.9.4. Recent Developments
- 11.2.9.5. Financials (Based on Availability)
- 11.2.10 Viome Life Sciences Inc *List Not Exhaustive
- 11.2.10.1. Overview
- 11.2.10.2. Products
- 11.2.10.3. SWOT Analysis
- 11.2.10.4. Recent Developments
- 11.2.10.5. Financials (Based on Availability)
- 11.2.1 Amway Corp
List of Figures
- Figure 1: Global Personalized Nutrition Market Revenue Breakdown (Million, %) by Region 2024 & 2032
- Figure 2: Global Personalized Nutrition Market Volume Breakdown (Billion, %) by Region 2024 & 2032
- Figure 3: North America Personalized Nutrition Market Revenue (Million), by Product Type 2024 & 2032
- Figure 4: North America Personalized Nutrition Market Volume (Billion), by Product Type 2024 & 2032
- Figure 5: North America Personalized Nutrition Market Revenue Share (%), by Product Type 2024 & 2032
- Figure 6: North America Personalized Nutrition Market Volume Share (%), by Product Type 2024 & 2032
- Figure 7: North America Personalized Nutrition Market Revenue (Million), by Application 2024 & 2032
- Figure 8: North America Personalized Nutrition Market Volume (Billion), by Application 2024 & 2032
- Figure 9: North America Personalized Nutrition Market Revenue Share (%), by Application 2024 & 2032
- Figure 10: North America Personalized Nutrition Market Volume Share (%), by Application 2024 & 2032
- Figure 11: North America Personalized Nutrition Market Revenue (Million), by End User 2024 & 2032
- Figure 12: North America Personalized Nutrition Market Volume (Billion), by End User 2024 & 2032
- Figure 13: North America Personalized Nutrition Market Revenue Share (%), by End User 2024 & 2032
- Figure 14: North America Personalized Nutrition Market Volume Share (%), by End User 2024 & 2032
- Figure 15: North America Personalized Nutrition Market Revenue (Million), by Country 2024 & 2032
- Figure 16: North America Personalized Nutrition Market Volume (Billion), by Country 2024 & 2032
- Figure 17: North America Personalized Nutrition Market Revenue Share (%), by Country 2024 & 2032
- Figure 18: North America Personalized Nutrition Market Volume Share (%), by Country 2024 & 2032
- Figure 19: Europe Personalized Nutrition Market Revenue (Million), by Product Type 2024 & 2032
- Figure 20: Europe Personalized Nutrition Market Volume (Billion), by Product Type 2024 & 2032
- Figure 21: Europe Personalized Nutrition Market Revenue Share (%), by Product Type 2024 & 2032
- Figure 22: Europe Personalized Nutrition Market Volume Share (%), by Product Type 2024 & 2032
- Figure 23: Europe Personalized Nutrition Market Revenue (Million), by Application 2024 & 2032
- Figure 24: Europe Personalized Nutrition Market Volume (Billion), by Application 2024 & 2032
- Figure 25: Europe Personalized Nutrition Market Revenue Share (%), by Application 2024 & 2032
- Figure 26: Europe Personalized Nutrition Market Volume Share (%), by Application 2024 & 2032
- Figure 27: Europe Personalized Nutrition Market Revenue (Million), by End User 2024 & 2032
- Figure 28: Europe Personalized Nutrition Market Volume (Billion), by End User 2024 & 2032
- Figure 29: Europe Personalized Nutrition Market Revenue Share (%), by End User 2024 & 2032
- Figure 30: Europe Personalized Nutrition Market Volume Share (%), by End User 2024 & 2032
- Figure 31: Europe Personalized Nutrition Market Revenue (Million), by Country 2024 & 2032
- Figure 32: Europe Personalized Nutrition Market Volume (Billion), by Country 2024 & 2032
- Figure 33: Europe Personalized Nutrition Market Revenue Share (%), by Country 2024 & 2032
- Figure 34: Europe Personalized Nutrition Market Volume Share (%), by Country 2024 & 2032
- Figure 35: Asia Pacific Personalized Nutrition Market Revenue (Million), by Product Type 2024 & 2032
- Figure 36: Asia Pacific Personalized Nutrition Market Volume (Billion), by Product Type 2024 & 2032
- Figure 37: Asia Pacific Personalized Nutrition Market Revenue Share (%), by Product Type 2024 & 2032
- Figure 38: Asia Pacific Personalized Nutrition Market Volume Share (%), by Product Type 2024 & 2032
- Figure 39: Asia Pacific Personalized Nutrition Market Revenue (Million), by Application 2024 & 2032
- Figure 40: Asia Pacific Personalized Nutrition Market Volume (Billion), by Application 2024 & 2032
- Figure 41: Asia Pacific Personalized Nutrition Market Revenue Share (%), by Application 2024 & 2032
- Figure 42: Asia Pacific Personalized Nutrition Market Volume Share (%), by Application 2024 & 2032
- Figure 43: Asia Pacific Personalized Nutrition Market Revenue (Million), by End User 2024 & 2032
- Figure 44: Asia Pacific Personalized Nutrition Market Volume (Billion), by End User 2024 & 2032
- Figure 45: Asia Pacific Personalized Nutrition Market Revenue Share (%), by End User 2024 & 2032
- Figure 46: Asia Pacific Personalized Nutrition Market Volume Share (%), by End User 2024 & 2032
- Figure 47: Asia Pacific Personalized Nutrition Market Revenue (Million), by Country 2024 & 2032
- Figure 48: Asia Pacific Personalized Nutrition Market Volume (Billion), by Country 2024 & 2032
- Figure 49: Asia Pacific Personalized Nutrition Market Revenue Share (%), by Country 2024 & 2032
- Figure 50: Asia Pacific Personalized Nutrition Market Volume Share (%), by Country 2024 & 2032
- Figure 51: Middle East and Africa Personalized Nutrition Market Revenue (Million), by Product Type 2024 & 2032
- Figure 52: Middle East and Africa Personalized Nutrition Market Volume (Billion), by Product Type 2024 & 2032
- Figure 53: Middle East and Africa Personalized Nutrition Market Revenue Share (%), by Product Type 2024 & 2032
- Figure 54: Middle East and Africa Personalized Nutrition Market Volume Share (%), by Product Type 2024 & 2032
- Figure 55: Middle East and Africa Personalized Nutrition Market Revenue (Million), by Application 2024 & 2032
- Figure 56: Middle East and Africa Personalized Nutrition Market Volume (Billion), by Application 2024 & 2032
- Figure 57: Middle East and Africa Personalized Nutrition Market Revenue Share (%), by Application 2024 & 2032
- Figure 58: Middle East and Africa Personalized Nutrition Market Volume Share (%), by Application 2024 & 2032
- Figure 59: Middle East and Africa Personalized Nutrition Market Revenue (Million), by End User 2024 & 2032
- Figure 60: Middle East and Africa Personalized Nutrition Market Volume (Billion), by End User 2024 & 2032
- Figure 61: Middle East and Africa Personalized Nutrition Market Revenue Share (%), by End User 2024 & 2032
- Figure 62: Middle East and Africa Personalized Nutrition Market Volume Share (%), by End User 2024 & 2032
- Figure 63: Middle East and Africa Personalized Nutrition Market Revenue (Million), by Country 2024 & 2032
- Figure 64: Middle East and Africa Personalized Nutrition Market Volume (Billion), by Country 2024 & 2032
- Figure 65: Middle East and Africa Personalized Nutrition Market Revenue Share (%), by Country 2024 & 2032
- Figure 66: Middle East and Africa Personalized Nutrition Market Volume Share (%), by Country 2024 & 2032
- Figure 67: South America Personalized Nutrition Market Revenue (Million), by Product Type 2024 & 2032
- Figure 68: South America Personalized Nutrition Market Volume (Billion), by Product Type 2024 & 2032
- Figure 69: South America Personalized Nutrition Market Revenue Share (%), by Product Type 2024 & 2032
- Figure 70: South America Personalized Nutrition Market Volume Share (%), by Product Type 2024 & 2032
- Figure 71: South America Personalized Nutrition Market Revenue (Million), by Application 2024 & 2032
- Figure 72: South America Personalized Nutrition Market Volume (Billion), by Application 2024 & 2032
- Figure 73: South America Personalized Nutrition Market Revenue Share (%), by Application 2024 & 2032
- Figure 74: South America Personalized Nutrition Market Volume Share (%), by Application 2024 & 2032
- Figure 75: South America Personalized Nutrition Market Revenue (Million), by End User 2024 & 2032
- Figure 76: South America Personalized Nutrition Market Volume (Billion), by End User 2024 & 2032
- Figure 77: South America Personalized Nutrition Market Revenue Share (%), by End User 2024 & 2032
- Figure 78: South America Personalized Nutrition Market Volume Share (%), by End User 2024 & 2032
- Figure 79: South America Personalized Nutrition Market Revenue (Million), by Country 2024 & 2032
- Figure 80: South America Personalized Nutrition Market Volume (Billion), by Country 2024 & 2032
- Figure 81: South America Personalized Nutrition Market Revenue Share (%), by Country 2024 & 2032
- Figure 82: South America Personalized Nutrition Market Volume Share (%), by Country 2024 & 2032
List of Tables
- Table 1: Global Personalized Nutrition Market Revenue Million Forecast, by Region 2019 & 2032
- Table 2: Global Personalized Nutrition Market Volume Billion Forecast, by Region 2019 & 2032
- Table 3: Global Personalized Nutrition Market Revenue Million Forecast, by Product Type 2019 & 2032
- Table 4: Global Personalized Nutrition Market Volume Billion Forecast, by Product Type 2019 & 2032
- Table 5: Global Personalized Nutrition Market Revenue Million Forecast, by Application 2019 & 2032
- Table 6: Global Personalized Nutrition Market Volume Billion Forecast, by Application 2019 & 2032
- Table 7: Global Personalized Nutrition Market Revenue Million Forecast, by End User 2019 & 2032
- Table 8: Global Personalized Nutrition Market Volume Billion Forecast, by End User 2019 & 2032
- Table 9: Global Personalized Nutrition Market Revenue Million Forecast, by Region 2019 & 2032
- Table 10: Global Personalized Nutrition Market Volume Billion Forecast, by Region 2019 & 2032
- Table 11: Global Personalized Nutrition Market Revenue Million Forecast, by Product Type 2019 & 2032
- Table 12: Global Personalized Nutrition Market Volume Billion Forecast, by Product Type 2019 & 2032
- Table 13: Global Personalized Nutrition Market Revenue Million Forecast, by Application 2019 & 2032
- Table 14: Global Personalized Nutrition Market Volume Billion Forecast, by Application 2019 & 2032
- Table 15: Global Personalized Nutrition Market Revenue Million Forecast, by End User 2019 & 2032
- Table 16: Global Personalized Nutrition Market Volume Billion Forecast, by End User 2019 & 2032
- Table 17: Global Personalized Nutrition Market Revenue Million Forecast, by Country 2019 & 2032
- Table 18: Global Personalized Nutrition Market Volume Billion Forecast, by Country 2019 & 2032
- Table 19: United States Personalized Nutrition Market Revenue (Million) Forecast, by Application 2019 & 2032
- Table 20: United States Personalized Nutrition Market Volume (Billion) Forecast, by Application 2019 & 2032
- Table 21: Canada Personalized Nutrition Market Revenue (Million) Forecast, by Application 2019 & 2032
- Table 22: Canada Personalized Nutrition Market Volume (Billion) Forecast, by Application 2019 & 2032
- Table 23: Mexico Personalized Nutrition Market Revenue (Million) Forecast, by Application 2019 & 2032
- Table 24: Mexico Personalized Nutrition Market Volume (Billion) Forecast, by Application 2019 & 2032
- Table 25: Global Personalized Nutrition Market Revenue Million Forecast, by Product Type 2019 & 2032
- Table 26: Global Personalized Nutrition Market Volume Billion Forecast, by Product Type 2019 & 2032
- Table 27: Global Personalized Nutrition Market Revenue Million Forecast, by Application 2019 & 2032
- Table 28: Global Personalized Nutrition Market Volume Billion Forecast, by Application 2019 & 2032
- Table 29: Global Personalized Nutrition Market Revenue Million Forecast, by End User 2019 & 2032
- Table 30: Global Personalized Nutrition Market Volume Billion Forecast, by End User 2019 & 2032
- Table 31: Global Personalized Nutrition Market Revenue Million Forecast, by Country 2019 & 2032
- Table 32: Global Personalized Nutrition Market Volume Billion Forecast, by Country 2019 & 2032
- Table 33: Germany Personalized Nutrition Market Revenue (Million) Forecast, by Application 2019 & 2032
- Table 34: Germany Personalized Nutrition Market Volume (Billion) Forecast, by Application 2019 & 2032
- Table 35: United Kingdom Personalized Nutrition Market Revenue (Million) Forecast, by Application 2019 & 2032
- Table 36: United Kingdom Personalized Nutrition Market Volume (Billion) Forecast, by Application 2019 & 2032
- Table 37: France Personalized Nutrition Market Revenue (Million) Forecast, by Application 2019 & 2032
- Table 38: France Personalized Nutrition Market Volume (Billion) Forecast, by Application 2019 & 2032
- Table 39: Italy Personalized Nutrition Market Revenue (Million) Forecast, by Application 2019 & 2032
- Table 40: Italy Personalized Nutrition Market Volume (Billion) Forecast, by Application 2019 & 2032
- Table 41: Spain Personalized Nutrition Market Revenue (Million) Forecast, by Application 2019 & 2032
- Table 42: Spain Personalized Nutrition Market Volume (Billion) Forecast, by Application 2019 & 2032
- Table 43: Rest of Europe Personalized Nutrition Market Revenue (Million) Forecast, by Application 2019 & 2032
- Table 44: Rest of Europe Personalized Nutrition Market Volume (Billion) Forecast, by Application 2019 & 2032
- Table 45: Global Personalized Nutrition Market Revenue Million Forecast, by Product Type 2019 & 2032
- Table 46: Global Personalized Nutrition Market Volume Billion Forecast, by Product Type 2019 & 2032
- Table 47: Global Personalized Nutrition Market Revenue Million Forecast, by Application 2019 & 2032
- Table 48: Global Personalized Nutrition Market Volume Billion Forecast, by Application 2019 & 2032
- Table 49: Global Personalized Nutrition Market Revenue Million Forecast, by End User 2019 & 2032
- Table 50: Global Personalized Nutrition Market Volume Billion Forecast, by End User 2019 & 2032
- Table 51: Global Personalized Nutrition Market Revenue Million Forecast, by Country 2019 & 2032
- Table 52: Global Personalized Nutrition Market Volume Billion Forecast, by Country 2019 & 2032
- Table 53: China Personalized Nutrition Market Revenue (Million) Forecast, by Application 2019 & 2032
- Table 54: China Personalized Nutrition Market Volume (Billion) Forecast, by Application 2019 & 2032
- Table 55: Japan Personalized Nutrition Market Revenue (Million) Forecast, by Application 2019 & 2032
- Table 56: Japan Personalized Nutrition Market Volume (Billion) Forecast, by Application 2019 & 2032
- Table 57: India Personalized Nutrition Market Revenue (Million) Forecast, by Application 2019 & 2032
- Table 58: India Personalized Nutrition Market Volume (Billion) Forecast, by Application 2019 & 2032
- Table 59: Australia Personalized Nutrition Market Revenue (Million) Forecast, by Application 2019 & 2032
- Table 60: Australia Personalized Nutrition Market Volume (Billion) Forecast, by Application 2019 & 2032
- Table 61: South Korea Personalized Nutrition Market Revenue (Million) Forecast, by Application 2019 & 2032
- Table 62: South Korea Personalized Nutrition Market Volume (Billion) Forecast, by Application 2019 & 2032
- Table 63: Rest of Asia Pacific Personalized Nutrition Market Revenue (Million) Forecast, by Application 2019 & 2032
- Table 64: Rest of Asia Pacific Personalized Nutrition Market Volume (Billion) Forecast, by Application 2019 & 2032
- Table 65: Global Personalized Nutrition Market Revenue Million Forecast, by Product Type 2019 & 2032
- Table 66: Global Personalized Nutrition Market Volume Billion Forecast, by Product Type 2019 & 2032
- Table 67: Global Personalized Nutrition Market Revenue Million Forecast, by Application 2019 & 2032
- Table 68: Global Personalized Nutrition Market Volume Billion Forecast, by Application 2019 & 2032
- Table 69: Global Personalized Nutrition Market Revenue Million Forecast, by End User 2019 & 2032
- Table 70: Global Personalized Nutrition Market Volume Billion Forecast, by End User 2019 & 2032
- Table 71: Global Personalized Nutrition Market Revenue Million Forecast, by Country 2019 & 2032
- Table 72: Global Personalized Nutrition Market Volume Billion Forecast, by Country 2019 & 2032
- Table 73: GCC Personalized Nutrition Market Revenue (Million) Forecast, by Application 2019 & 2032
- Table 74: GCC Personalized Nutrition Market Volume (Billion) Forecast, by Application 2019 & 2032
- Table 75: South Africa Personalized Nutrition Market Revenue (Million) Forecast, by Application 2019 & 2032
- Table 76: South Africa Personalized Nutrition Market Volume (Billion) Forecast, by Application 2019 & 2032
- Table 77: Rest of Middle East and Africa Personalized Nutrition Market Revenue (Million) Forecast, by Application 2019 & 2032
- Table 78: Rest of Middle East and Africa Personalized Nutrition Market Volume (Billion) Forecast, by Application 2019 & 2032
- Table 79: Global Personalized Nutrition Market Revenue Million Forecast, by Product Type 2019 & 2032
- Table 80: Global Personalized Nutrition Market Volume Billion Forecast, by Product Type 2019 & 2032
- Table 81: Global Personalized Nutrition Market Revenue Million Forecast, by Application 2019 & 2032
- Table 82: Global Personalized Nutrition Market Volume Billion Forecast, by Application 2019 & 2032
- Table 83: Global Personalized Nutrition Market Revenue Million Forecast, by End User 2019 & 2032
- Table 84: Global Personalized Nutrition Market Volume Billion Forecast, by End User 2019 & 2032
- Table 85: Global Personalized Nutrition Market Revenue Million Forecast, by Country 2019 & 2032
- Table 86: Global Personalized Nutrition Market Volume Billion Forecast, by Country 2019 & 2032
- Table 87: Brazil Personalized Nutrition Market Revenue (Million) Forecast, by Application 2019 & 2032
- Table 88: Brazil Personalized Nutrition Market Volume (Billion) Forecast, by Application 2019 & 2032
- Table 89: Argentina Personalized Nutrition Market Revenue (Million) Forecast, by Application 2019 & 2032
- Table 90: Argentina Personalized Nutrition Market Volume (Billion) Forecast, by Application 2019 & 2032
- Table 91: Rest of South America Personalized Nutrition Market Revenue (Million) Forecast, by Application 2019 & 2032
- Table 92: Rest of South America Personalized Nutrition Market Volume (Billion) Forecast, by Application 2019 & 2032
Frequently Asked Questions
1. What is the projected Compound Annual Growth Rate (CAGR) of the Personalized Nutrition Market?
The projected CAGR is approximately 14.34%.
2. Which companies are prominent players in the Personalized Nutrition Market?
Key companies in the market include Amway Corp, Abbott, Superior Supplement Manufacturing, Herbalife International of America Inc, Metagenics Inc, GX Sciences LLC, Nutralliance, Divine Design Manufacturing, Archer Daniels Midland Company (ADM), Viome Life Sciences Inc *List Not Exhaustive.
3. What are the main segments of the Personalized Nutrition Market?
The market segments include Product Type, Application, End User.
4. Can you provide details about the market size?
The market size is estimated to be USD 14.27 Million as of 2022.
5. What are some drivers contributing to market growth?
Shift in Consumer Preference Due to a Rise in Health Awareness; Increasing Burden of Chronic Diseases and Geriatric Population; Technological Advancements and Growing Trend of Digital Healthcare.
6. What are the notable trends driving market growth?
Disease-based Segment Expected to Hold a Significant Share Over the Forecast Period.
7. Are there any restraints impacting market growth?
Shift in Consumer Preference Due to a Rise in Health Awareness; Increasing Burden of Chronic Diseases and Geriatric Population; Technological Advancements and Growing Trend of Digital Healthcare.
8. Can you provide examples of recent developments in the market?
September 2024: Bioniq announced its partnership with healthcare reimbursement and HSA/FSA spending solution Truemed. This partnership signifies that Bioniq’s unique pharmaceutical-grade nutritional supplements can be medically necessary, allowing for HSA and FSA to spend on the preventative healthcare routine.February 2024: Riise, a Berlin-based supplement startup, introduced its personalized microgranule nutrient blends, catering to individual nutritional needs and health objectives, thus eliminating the necessity for multiple pills and capsules.
9. What pricing options are available for accessing the report?
Pricing options include single-user, multi-user, and enterprise licenses priced at USD 4750, USD 5250, and USD 8750 respectively.
10. Is the market size provided in terms of value or volume?
The market size is provided in terms of value, measured in Million and volume, measured in Billion.
11. Are there any specific market keywords associated with the report?
Yes, the market keyword associated with the report is "Personalized Nutrition Market," which aids in identifying and referencing the specific market segment covered.
12. How do I determine which pricing option suits my needs best?
The pricing options vary based on user requirements and access needs. Individual users may opt for single-user licenses, while businesses requiring broader access may choose multi-user or enterprise licenses for cost-effective access to the report.
13. Are there any additional resources or data provided in the Personalized Nutrition Market report?
While the report offers comprehensive insights, it's advisable to review the specific contents or supplementary materials provided to ascertain if additional resources or data are available.
14. How can I stay updated on further developments or reports in the Personalized Nutrition Market?
To stay informed about further developments, trends, and reports in the Personalized Nutrition Market, consider subscribing to industry newsletters, following relevant companies and organizations, or regularly checking reputable industry news sources and publications.
Methodology
Step 1 - Identification of Relevant Samples Size from Population Database


Step 2 - Approaches for Defining Global Market Size (Value, Volume* & Price*)

Note*: In applicable scenarios
Step 3 - Data Sources
Primary Research
- Web Analytics
- Survey Reports
- Research Institute
- Latest Research Reports
- Opinion Leaders
Secondary Research
- Annual Reports
- White Paper
- Latest Press Release
- Industry Association
- Paid Database
- Investor Presentations

Step 4 - Data Triangulation
Involves using different sources of information in order to increase the validity of a study
These sources are likely to be stakeholders in a program - participants, other researchers, program staff, other community members, and so on.
Then we put all data in single framework & apply various statistical tools to find out the dynamic on the market.
During the analysis stage, feedback from the stakeholder groups would be compared to determine areas of agreement as well as areas of divergence
