

Key Insights
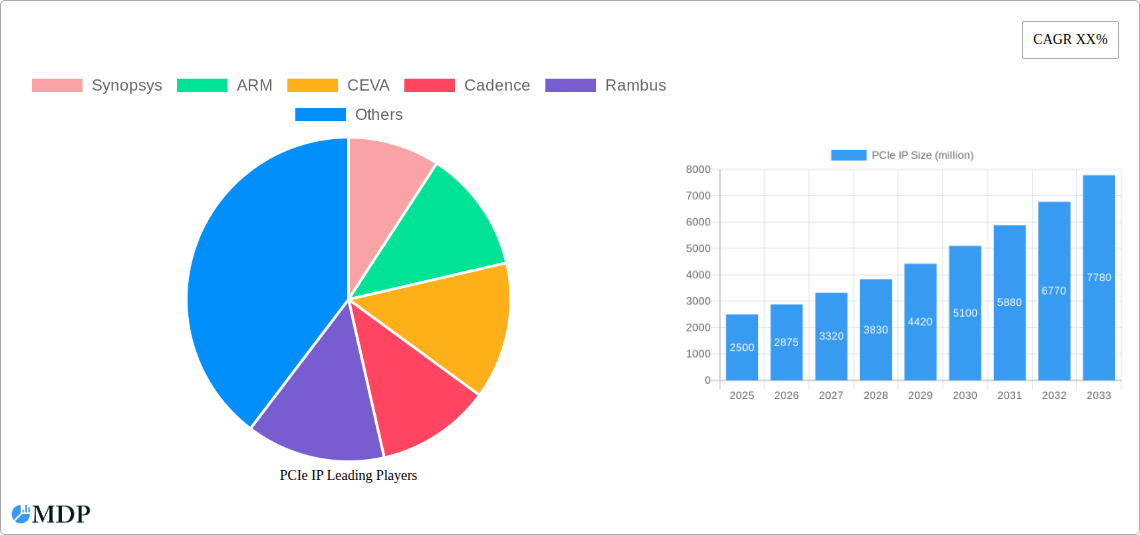
The PCIe IP market is experiencing robust growth, driven by the increasing demand for high-speed data transfer in diverse applications, including data centers, high-performance computing (HPC), and automotive. The market's Compound Annual Growth Rate (CAGR) is estimated to be around 15% between 2025 and 2033, indicating significant expansion. This growth is fueled by several key factors: the proliferation of 5G and the Internet of Things (IoT) necessitating faster data communication, the rise of artificial intelligence (AI) and machine learning (ML) applications that require significant data processing power, and the increasing adoption of PCIe Gen 5 and Gen 6 technologies offering substantially improved bandwidth. Key players like Synopsys, ARM, CEVA, Cadence, Rambus, and others are actively investing in R&D to develop advanced PCIe IP solutions, further fueling market expansion. The market segmentation is largely driven by application (data centers, automotive, consumer electronics etc.) and PCIe generation (Gen 4, Gen 5, Gen 6).
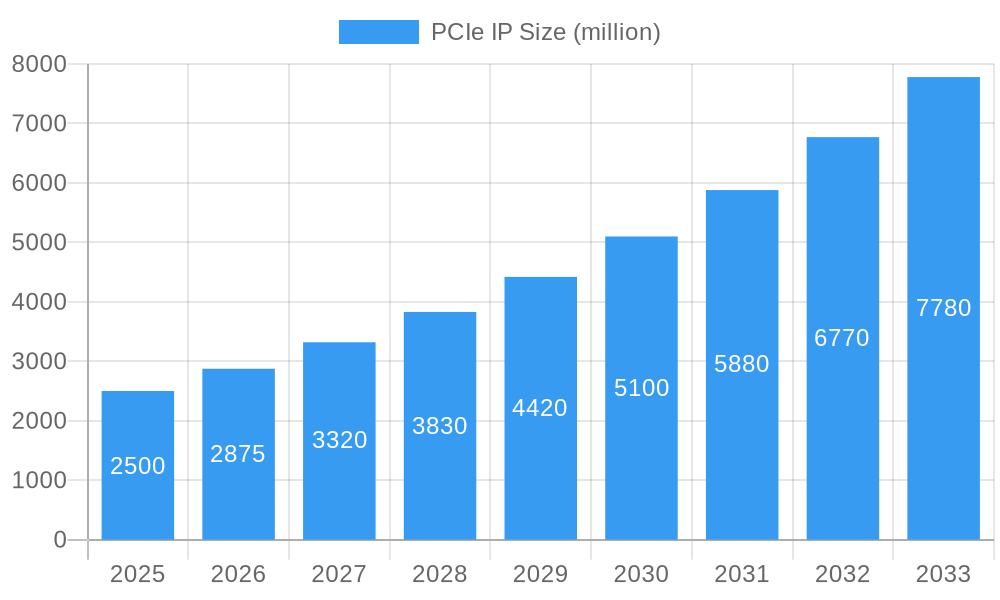
PCIe IP Market Size (In Billion)
However, despite strong growth projections, the market faces certain challenges. The complexity of PCIe technology presents a high barrier to entry for smaller players, while ensuring interoperability across different vendors remains a key concern. The ongoing semiconductor supply chain shortages could also impact the availability of PCIe IP and subsequently constrain market growth in the short term. Furthermore, the cost of implementation and integration of PCIe IP can be substantial, potentially impacting wider adoption. Nonetheless, long-term market forecasts remain positive, indicating a significant expansion in the PCIe IP market due to continuous technological advancements and increasing demand for high-bandwidth solutions across various sectors. We project a market size of approximately $2.5 Billion USD in 2025, growing to over $7 Billion USD by 2033.
PCIe IP Company Market Share
PCIe IP Market Report: 2019-2033 - A Comprehensive Analysis of a Multi-Billion Dollar Industry
This in-depth report provides a comprehensive analysis of the PCIe IP market, projecting a market value exceeding $XX billion by 2033. It examines market dynamics, leading players like Synopsys, ARM, CEVA, Cadence, Rambus, Actt, Arasan, and Alphawave, and key trends shaping this rapidly evolving sector. The report covers the period 2019-2033, with a focus on the 2025-2033 forecast period, offering invaluable insights for stakeholders across the semiconductor and technology landscapes. This report is crucial for informed decision-making in this dynamic and lucrative market.
PCIe IP Market Dynamics & Concentration
The PCIe IP market exhibits a moderately concentrated landscape, with a handful of major players holding significant market share. Synopsys, ARM, and Cadence currently dominate, collectively accounting for an estimated xx% of the market in 2025. However, smaller players like CEVA, Rambus, and others are actively innovating, driving competition and fostering market dynamism. Market concentration is influenced by factors such as:
- Innovation Drivers: Continuous advancements in PCIe standards (e.g., PCIe 6.0) and the integration of high-speed interfaces are key drivers.
- Regulatory Frameworks: Compliance with industry standards and regulations impacts market access and product development.
- Product Substitutes: Alternatives like other high-speed interfaces exist, creating competitive pressures.
- End-User Trends: Growing demand for high-bandwidth data transfer solutions across various applications is a major growth catalyst.
- M&A Activities: Consolidation within the market through mergers and acquisitions is anticipated to increase market concentration further. The historical period (2019-2024) witnessed approximately xx M&A deals, with a projected increase to xx deals during the forecast period.
PCIe IP Industry Trends & Analysis
The PCIe IP market is experiencing robust growth, driven by several factors. The Compound Annual Growth Rate (CAGR) is projected to be xx% from 2025 to 2033. This expansion is fueled by increasing demand for high-performance computing, data centers, and high-bandwidth applications like artificial intelligence (AI) and machine learning (ML). Technological advancements, such as the introduction of PCIe 6.0 and beyond, are significantly enhancing data transfer speeds and efficiency, further stimulating market growth. Market penetration of PCIe IP is expected to reach xx% by 2033, indicating significant adoption across various sectors. Competitive dynamics are characterized by ongoing innovation, strategic partnerships, and the emergence of new players, adding complexity and dynamism to this landscape. Consumer preferences increasingly favor higher performance and lower power consumption, pushing vendors to develop efficient and innovative PCIe IP solutions.
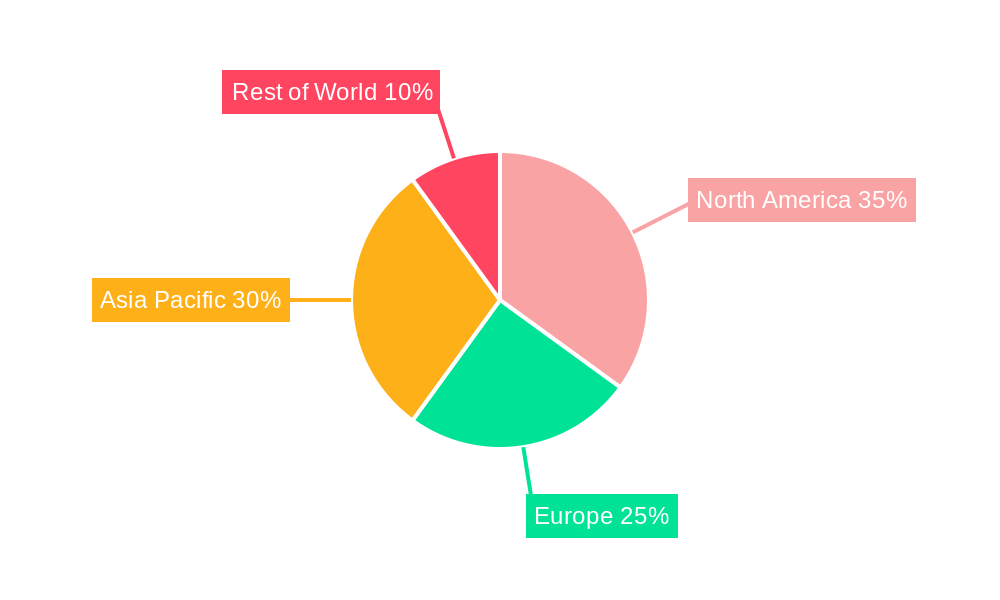
Leading Markets & Segments in PCIe IP
The North American market currently holds the leading position in the PCIe IP market, accounting for an estimated xx% of the global market share in 2025. This dominance is attributed to several factors:
- Strong Technological Base: Presence of major technology companies and a strong R&D ecosystem.
- High Adoption Rate: Early adoption of advanced technologies across various sectors like data centers and high-performance computing.
- Favorable Economic Policies: Government support for technological advancements and innovation.
Key growth drivers in other regions include:
- Asia-Pacific: Rapid expansion of data centers, robust growth in the electronics industry, and supportive government policies promoting technological advancements.
- Europe: Growing demand for high-speed connectivity solutions in industries like automotive and industrial automation.
While data centers and high-performance computing currently dominate, the automotive, industrial automation, and consumer electronics segments are exhibiting significant growth potential, contributing to overall market expansion.
PCIe IP Product Developments
Recent product developments focus on increasing data transfer speeds, improving power efficiency, and enhancing security features. The introduction of PCIe 6.0 and the ongoing development of PCIe 7.0 and beyond are critical drivers of innovation. This leads to a broader range of applications, driving market expansion and making PCIe IP solutions highly competitive in high-bandwidth markets. The market also sees a trend towards integrated solutions, combining PCIe IP with other essential functionalities for improved system-level integration and reduced design complexity.
Key Drivers of PCIe IP Growth
Several factors propel the growth of the PCIe IP market:
- Technological Advancements: Development of higher-speed PCIe standards (e.g., PCIe 6.0 and beyond) directly impacts the market's expansion.
- Economic Growth: Increased spending on data centers and high-performance computing fuels the demand for high-bandwidth solutions.
- Government Regulations: Favorable policies promoting the use of advanced technologies further stimulate market growth.
Challenges in the PCIe IP Market
The PCIe IP market faces several challenges:
- High Development Costs: Developing and implementing advanced PCIe IP solutions requires significant investment.
- Supply Chain Disruptions: Global supply chain uncertainties can impact the availability of components.
- Intense Competition: The presence of numerous competitors intensifies market pressure.
These challenges directly impact market growth and profitability.
Emerging Opportunities in PCIe IP
The long-term growth of the PCIe IP market is driven by several exciting opportunities:
- Expansion into Emerging Markets: Growing demand for high-bandwidth solutions in developing economies presents significant market expansion opportunities.
- Technological Advancements: Continuous improvements in PCIe standards and related technologies ensure sustained growth.
- Strategic Partnerships and Collaborations: Strategic alliances between IP providers and system integrators can enhance market reach and adoption.
Key Milestones in PCIe IP Industry
- 2020: Introduction of PCIe 6.0 specification.
- 2022: Several major players announced the availability of PCIe 6.0 IP cores.
- 2023: Increased market adoption of PCIe 5.0 solutions. (Further milestones will be added as they occur).
Strategic Outlook for PCIe IP Market
The PCIe IP market is poised for significant growth driven by advancements in PCIe standards, increased demand for high-bandwidth applications, and the expansion into new markets. Strategic partnerships, technological innovation, and addressing supply chain challenges are crucial for companies seeking to capitalize on the market's future potential. The market is expected to witness continued consolidation through mergers and acquisitions, further shaping the competitive landscape in the coming years.
PCIe IP Segmentation
-
1. Application
- 1.1. Automotive
- 1.2. Mobile Device
- 1.3. Data Center
- 1.4. Other
-
2. Types
- 2.1. PCIe 3/4
- 2.2. PCIe 5
- 2.3. Other
PCIe IP Segmentation By Geography
-
1. North America
- 1.1. United States
- 1.2. Canada
- 1.3. Mexico
-
2. South America
- 2.1. Brazil
- 2.2. Argentina
- 2.3. Rest of South America
-
3. Europe
- 3.1. United Kingdom
- 3.2. Germany
- 3.3. France
- 3.4. Italy
- 3.5. Spain
- 3.6. Russia
- 3.7. Benelux
- 3.8. Nordics
- 3.9. Rest of Europe
-
4. Middle East & Africa
- 4.1. Turkey
- 4.2. Israel
- 4.3. GCC
- 4.4. North Africa
- 4.5. South Africa
- 4.6. Rest of Middle East & Africa
-
5. Asia Pacific
- 5.1. China
- 5.2. India
- 5.3. Japan
- 5.4. South Korea
- 5.5. ASEAN
- 5.6. Oceania
- 5.7. Rest of Asia Pacific
PCIe IP Regional Market Share
Geographic Coverage of PCIe IP
PCIe IP REPORT HIGHLIGHTS
| Aspects | Details |
|---|---|
| Study Period | 2020-2034 |
| Base Year | 2025 |
| Estimated Year | 2026 |
| Forecast Period | 2026-2034 |
| Historical Period | 2020-2025 |
| Growth Rate | CAGR of 10.3% from 2020-2034 |
| Segmentation |
|
Table of Contents
- 1. Introduction
- 1.1. Research Scope
- 1.2. Market Segmentation
- 1.3. Research Objective
- 1.4. Definitions and Assumptions
- 2. Executive Summary
- 2.1. Market Snapshot
- 3. Market Dynamics
- 3.1. Market Drivers
- 3.2. Market Restrains
- 3.3. Market Trends
- 3.4. Market Opportunities
- 4. Market Factor Analysis
- 4.1. Porters Five Forces
- 4.1.1. Bargaining Power of Suppliers
- 4.1.2. Bargaining Power of Buyers
- 4.1.3. Threat of New Entrants
- 4.1.4. Threat of Substitutes
- 4.1.5. Competitive Rivalry
- 4.2. PESTEL analysis
- 4.3. BCG Analysis
- 4.3.1. Stars (High Growth, High Market Share)
- 4.3.2. Cash Cows (Low Growth, High Market Share)
- 4.3.3. Question Mark (High Growth, Low Market Share)
- 4.3.4. Dogs (Low Growth, Low Market Share)
- 4.4. Ansoff Matrix Analysis
- 4.5. Supply Chain Analysis
- 4.6. Regulatory Landscape
- 4.7. Current Market Potential and Opportunity Assessment (TAM–SAM–SOM Framework)
- 4.8. MDP Analyst Note
- 4.1. Porters Five Forces
- 5. Market Analysis, Insights and Forecast 2021-2033
- 5.1. Market Analysis, Insights and Forecast - by Application
- 5.1.1. Automotive
- 5.1.2. Mobile Device
- 5.1.3. Data Center
- 5.1.4. Other
- 5.2. Market Analysis, Insights and Forecast - by Types
- 5.2.1. PCIe 3/4
- 5.2.2. PCIe 5
- 5.2.3. Other
- 5.3. Market Analysis, Insights and Forecast - by Region
- 5.3.1. North America
- 5.3.2. South America
- 5.3.3. Europe
- 5.3.4. Middle East & Africa
- 5.3.5. Asia Pacific
- 5.1. Market Analysis, Insights and Forecast - by Application
- 6. Global PCIe IP Analysis, Insights and Forecast, 2021-2033
- 6.1. Market Analysis, Insights and Forecast - by Application
- 6.1.1. Automotive
- 6.1.2. Mobile Device
- 6.1.3. Data Center
- 6.1.4. Other
- 6.2. Market Analysis, Insights and Forecast - by Types
- 6.2.1. PCIe 3/4
- 6.2.2. PCIe 5
- 6.2.3. Other
- 6.1. Market Analysis, Insights and Forecast - by Application
- 7. North America PCIe IP Analysis, Insights and Forecast, 2020-2032
- 7.1. Market Analysis, Insights and Forecast - by Application
- 7.1.1. Automotive
- 7.1.2. Mobile Device
- 7.1.3. Data Center
- 7.1.4. Other
- 7.2. Market Analysis, Insights and Forecast - by Types
- 7.2.1. PCIe 3/4
- 7.2.2. PCIe 5
- 7.2.3. Other
- 7.1. Market Analysis, Insights and Forecast - by Application
- 8. South America PCIe IP Analysis, Insights and Forecast, 2020-2032
- 8.1. Market Analysis, Insights and Forecast - by Application
- 8.1.1. Automotive
- 8.1.2. Mobile Device
- 8.1.3. Data Center
- 8.1.4. Other
- 8.2. Market Analysis, Insights and Forecast - by Types
- 8.2.1. PCIe 3/4
- 8.2.2. PCIe 5
- 8.2.3. Other
- 8.1. Market Analysis, Insights and Forecast - by Application
- 9. Europe PCIe IP Analysis, Insights and Forecast, 2020-2032
- 9.1. Market Analysis, Insights and Forecast - by Application
- 9.1.1. Automotive
- 9.1.2. Mobile Device
- 9.1.3. Data Center
- 9.1.4. Other
- 9.2. Market Analysis, Insights and Forecast - by Types
- 9.2.1. PCIe 3/4
- 9.2.2. PCIe 5
- 9.2.3. Other
- 9.1. Market Analysis, Insights and Forecast - by Application
- 10. Middle East & Africa PCIe IP Analysis, Insights and Forecast, 2020-2032
- 10.1. Market Analysis, Insights and Forecast - by Application
- 10.1.1. Automotive
- 10.1.2. Mobile Device
- 10.1.3. Data Center
- 10.1.4. Other
- 10.2. Market Analysis, Insights and Forecast - by Types
- 10.2.1. PCIe 3/4
- 10.2.2. PCIe 5
- 10.2.3. Other
- 10.1. Market Analysis, Insights and Forecast - by Application
- 11. Asia Pacific PCIe IP Analysis, Insights and Forecast, 2020-2032
- 11.1. Market Analysis, Insights and Forecast - by Application
- 11.1.1. Automotive
- 11.1.2. Mobile Device
- 11.1.3. Data Center
- 11.1.4. Other
- 11.2. Market Analysis, Insights and Forecast - by Types
- 11.2.1. PCIe 3/4
- 11.2.2. PCIe 5
- 11.2.3. Other
- 11.1. Market Analysis, Insights and Forecast - by Application
- 12. Competitive Analysis
- 12.1. Company Profiles
- 12.1.1 Synopsys
- 12.1.1.1. Company Overview
- 12.1.1.2. Products
- 12.1.1.3. Company Financials
- 12.1.1.4. SWOT Analysis
- 12.1.2 ARM
- 12.1.2.1. Company Overview
- 12.1.2.2. Products
- 12.1.2.3. Company Financials
- 12.1.2.4. SWOT Analysis
- 12.1.3 CEVA
- 12.1.3.1. Company Overview
- 12.1.3.2. Products
- 12.1.3.3. Company Financials
- 12.1.3.4. SWOT Analysis
- 12.1.4 Cadence
- 12.1.4.1. Company Overview
- 12.1.4.2. Products
- 12.1.4.3. Company Financials
- 12.1.4.4. SWOT Analysis
- 12.1.5 Rambus
- 12.1.5.1. Company Overview
- 12.1.5.2. Products
- 12.1.5.3. Company Financials
- 12.1.5.4. SWOT Analysis
- 12.1.6 Actt
- 12.1.6.1. Company Overview
- 12.1.6.2. Products
- 12.1.6.3. Company Financials
- 12.1.6.4. SWOT Analysis
- 12.1.7 Arasan
- 12.1.7.1. Company Overview
- 12.1.7.2. Products
- 12.1.7.3. Company Financials
- 12.1.7.4. SWOT Analysis
- 12.1.8 Alphawave
- 12.1.8.1. Company Overview
- 12.1.8.2. Products
- 12.1.8.3. Company Financials
- 12.1.8.4. SWOT Analysis
- 12.1.1 Synopsys
- 12.2. Market Entropy
- 12.2.1 Company's Key Areas Served
- 12.2.2 Recent Developments
- 12.3. Company Market Share Analysis 2025
- 12.3.1 Top 5 Companies Market Share Analysis
- 12.3.2 Top 3 Companies Market Share Analysis
- 12.4. List of Potential Customers
- 13. Research Methodology
List of Figures
- Figure 1: Global PCIe IP Revenue Breakdown (undefined, %) by Region 2025 & 2033
- Figure 2: North America PCIe IP Revenue (undefined), by Application 2025 & 2033
- Figure 3: North America PCIe IP Revenue Share (%), by Application 2025 & 2033
- Figure 4: North America PCIe IP Revenue (undefined), by Types 2025 & 2033
- Figure 5: North America PCIe IP Revenue Share (%), by Types 2025 & 2033
- Figure 6: North America PCIe IP Revenue (undefined), by Country 2025 & 2033
- Figure 7: North America PCIe IP Revenue Share (%), by Country 2025 & 2033
- Figure 8: South America PCIe IP Revenue (undefined), by Application 2025 & 2033
- Figure 9: South America PCIe IP Revenue Share (%), by Application 2025 & 2033
- Figure 10: South America PCIe IP Revenue (undefined), by Types 2025 & 2033
- Figure 11: South America PCIe IP Revenue Share (%), by Types 2025 & 2033
- Figure 12: South America PCIe IP Revenue (undefined), by Country 2025 & 2033
- Figure 13: South America PCIe IP Revenue Share (%), by Country 2025 & 2033
- Figure 14: Europe PCIe IP Revenue (undefined), by Application 2025 & 2033
- Figure 15: Europe PCIe IP Revenue Share (%), by Application 2025 & 2033
- Figure 16: Europe PCIe IP Revenue (undefined), by Types 2025 & 2033
- Figure 17: Europe PCIe IP Revenue Share (%), by Types 2025 & 2033
- Figure 18: Europe PCIe IP Revenue (undefined), by Country 2025 & 2033
- Figure 19: Europe PCIe IP Revenue Share (%), by Country 2025 & 2033
- Figure 20: Middle East & Africa PCIe IP Revenue (undefined), by Application 2025 & 2033
- Figure 21: Middle East & Africa PCIe IP Revenue Share (%), by Application 2025 & 2033
- Figure 22: Middle East & Africa PCIe IP Revenue (undefined), by Types 2025 & 2033
- Figure 23: Middle East & Africa PCIe IP Revenue Share (%), by Types 2025 & 2033
- Figure 24: Middle East & Africa PCIe IP Revenue (undefined), by Country 2025 & 2033
- Figure 25: Middle East & Africa PCIe IP Revenue Share (%), by Country 2025 & 2033
- Figure 26: Asia Pacific PCIe IP Revenue (undefined), by Application 2025 & 2033
- Figure 27: Asia Pacific PCIe IP Revenue Share (%), by Application 2025 & 2033
- Figure 28: Asia Pacific PCIe IP Revenue (undefined), by Types 2025 & 2033
- Figure 29: Asia Pacific PCIe IP Revenue Share (%), by Types 2025 & 2033
- Figure 30: Asia Pacific PCIe IP Revenue (undefined), by Country 2025 & 2033
- Figure 31: Asia Pacific PCIe IP Revenue Share (%), by Country 2025 & 2033
List of Tables
- Table 1: Global PCIe IP Revenue undefined Forecast, by Application 2020 & 2033
- Table 2: Global PCIe IP Revenue undefined Forecast, by Types 2020 & 2033
- Table 3: Global PCIe IP Revenue undefined Forecast, by Region 2020 & 2033
- Table 4: Global PCIe IP Revenue undefined Forecast, by Application 2020 & 2033
- Table 5: Global PCIe IP Revenue undefined Forecast, by Types 2020 & 2033
- Table 6: Global PCIe IP Revenue undefined Forecast, by Country 2020 & 2033
- Table 7: United States PCIe IP Revenue (undefined) Forecast, by Application 2020 & 2033
- Table 8: Canada PCIe IP Revenue (undefined) Forecast, by Application 2020 & 2033
- Table 9: Mexico PCIe IP Revenue (undefined) Forecast, by Application 2020 & 2033
- Table 10: Global PCIe IP Revenue undefined Forecast, by Application 2020 & 2033
- Table 11: Global PCIe IP Revenue undefined Forecast, by Types 2020 & 2033
- Table 12: Global PCIe IP Revenue undefined Forecast, by Country 2020 & 2033
- Table 13: Brazil PCIe IP Revenue (undefined) Forecast, by Application 2020 & 2033
- Table 14: Argentina PCIe IP Revenue (undefined) Forecast, by Application 2020 & 2033
- Table 15: Rest of South America PCIe IP Revenue (undefined) Forecast, by Application 2020 & 2033
- Table 16: Global PCIe IP Revenue undefined Forecast, by Application 2020 & 2033
- Table 17: Global PCIe IP Revenue undefined Forecast, by Types 2020 & 2033
- Table 18: Global PCIe IP Revenue undefined Forecast, by Country 2020 & 2033
- Table 19: United Kingdom PCIe IP Revenue (undefined) Forecast, by Application 2020 & 2033
- Table 20: Germany PCIe IP Revenue (undefined) Forecast, by Application 2020 & 2033
- Table 21: France PCIe IP Revenue (undefined) Forecast, by Application 2020 & 2033
- Table 22: Italy PCIe IP Revenue (undefined) Forecast, by Application 2020 & 2033
- Table 23: Spain PCIe IP Revenue (undefined) Forecast, by Application 2020 & 2033
- Table 24: Russia PCIe IP Revenue (undefined) Forecast, by Application 2020 & 2033
- Table 25: Benelux PCIe IP Revenue (undefined) Forecast, by Application 2020 & 2033
- Table 26: Nordics PCIe IP Revenue (undefined) Forecast, by Application 2020 & 2033
- Table 27: Rest of Europe PCIe IP Revenue (undefined) Forecast, by Application 2020 & 2033
- Table 28: Global PCIe IP Revenue undefined Forecast, by Application 2020 & 2033
- Table 29: Global PCIe IP Revenue undefined Forecast, by Types 2020 & 2033
- Table 30: Global PCIe IP Revenue undefined Forecast, by Country 2020 & 2033
- Table 31: Turkey PCIe IP Revenue (undefined) Forecast, by Application 2020 & 2033
- Table 32: Israel PCIe IP Revenue (undefined) Forecast, by Application 2020 & 2033
- Table 33: GCC PCIe IP Revenue (undefined) Forecast, by Application 2020 & 2033
- Table 34: North Africa PCIe IP Revenue (undefined) Forecast, by Application 2020 & 2033
- Table 35: South Africa PCIe IP Revenue (undefined) Forecast, by Application 2020 & 2033
- Table 36: Rest of Middle East & Africa PCIe IP Revenue (undefined) Forecast, by Application 2020 & 2033
- Table 37: Global PCIe IP Revenue undefined Forecast, by Application 2020 & 2033
- Table 38: Global PCIe IP Revenue undefined Forecast, by Types 2020 & 2033
- Table 39: Global PCIe IP Revenue undefined Forecast, by Country 2020 & 2033
- Table 40: China PCIe IP Revenue (undefined) Forecast, by Application 2020 & 2033
- Table 41: India PCIe IP Revenue (undefined) Forecast, by Application 2020 & 2033
- Table 42: Japan PCIe IP Revenue (undefined) Forecast, by Application 2020 & 2033
- Table 43: South Korea PCIe IP Revenue (undefined) Forecast, by Application 2020 & 2033
- Table 44: ASEAN PCIe IP Revenue (undefined) Forecast, by Application 2020 & 2033
- Table 45: Oceania PCIe IP Revenue (undefined) Forecast, by Application 2020 & 2033
- Table 46: Rest of Asia Pacific PCIe IP Revenue (undefined) Forecast, by Application 2020 & 2033
Frequently Asked Questions
1. What is the projected Compound Annual Growth Rate (CAGR) of the PCIe IP?
The projected CAGR is approximately 10.3%.
2. Which companies are prominent players in the PCIe IP?
Key companies in the market include Synopsys, ARM, CEVA, Cadence, Rambus, Actt, Arasan, Alphawave.
3. What are the main segments of the PCIe IP?
The market segments include Application, Types.
4. Can you provide details about the market size?
The market size is estimated to be USD XXX N/A as of 2022.
5. What are some drivers contributing to market growth?
N/A
6. What are the notable trends driving market growth?
N/A
7. Are there any restraints impacting market growth?
N/A
8. Can you provide examples of recent developments in the market?
N/A
9. What pricing options are available for accessing the report?
Pricing options include single-user, multi-user, and enterprise licenses priced at USD 3950.00, USD 5925.00, and USD 7900.00 respectively.
10. Is the market size provided in terms of value or volume?
The market size is provided in terms of value, measured in N/A.
11. Are there any specific market keywords associated with the report?
Yes, the market keyword associated with the report is "PCIe IP," which aids in identifying and referencing the specific market segment covered.
12. How do I determine which pricing option suits my needs best?
The pricing options vary based on user requirements and access needs. Individual users may opt for single-user licenses, while businesses requiring broader access may choose multi-user or enterprise licenses for cost-effective access to the report.
13. Are there any additional resources or data provided in the PCIe IP report?
While the report offers comprehensive insights, it's advisable to review the specific contents or supplementary materials provided to ascertain if additional resources or data are available.
14. How can I stay updated on further developments or reports in the PCIe IP?
To stay informed about further developments, trends, and reports in the PCIe IP, consider subscribing to industry newsletters, following relevant companies and organizations, or regularly checking reputable industry news sources and publications.
Methodology
Step 1 - Identification of Relevant Samples Size from Population Database


Step 2 - Approaches for Defining Global Market Size (Value, Volume* & Price*)

Note*: In applicable scenarios
Step 3 - Data Sources
Primary Research
- Web Analytics
- Survey Reports
- Research Institute
- Latest Research Reports
- Opinion Leaders
Secondary Research
- Annual Reports
- White Paper
- Latest Press Release
- Industry Association
- Paid Database
- Investor Presentations

Step 4 - Data Triangulation
Involves using different sources of information in order to increase the validity of a study
These sources are likely to be stakeholders in a program - participants, other researchers, program staff, other community members, and so on.
Then we put all data in single framework & apply various statistical tools to find out the dynamic on the market.
During the analysis stage, feedback from the stakeholder groups would be compared to determine areas of agreement as well as areas of divergence