

Key Insights
The Passive Optical Network (PON) market is experiencing robust growth, driven by the increasing demand for high-bandwidth connectivity across residential, enterprise, and mobile backhaul applications. The market's expansion is fueled by the widespread adoption of fiber-to-the-x (FTTx) technologies, offering superior speed, reliability, and scalability compared to traditional copper-based networks. The shift towards cloud computing, the proliferation of smart devices, and the growing need for high-definition video streaming are significant catalysts. Furthermore, government initiatives promoting broadband infrastructure development in various regions are accelerating market growth. Segmentation analysis reveals that GPON equipment holds a larger market share currently due to its cost-effectiveness and widespread deployment, while EPON is gaining traction in specific niche applications. The component segment is dominated by optical splitters and optical cables, reflecting the crucial role these elements play in the overall PON infrastructure. Major players like ZTE, Huawei, and Nokia are actively investing in R&D to enhance PON technologies, including advancements in 5G and 10G PON solutions, further fueling market expansion. Competition is intense, with companies focusing on strategic partnerships, acquisitions, and technological innovations to maintain a competitive edge.
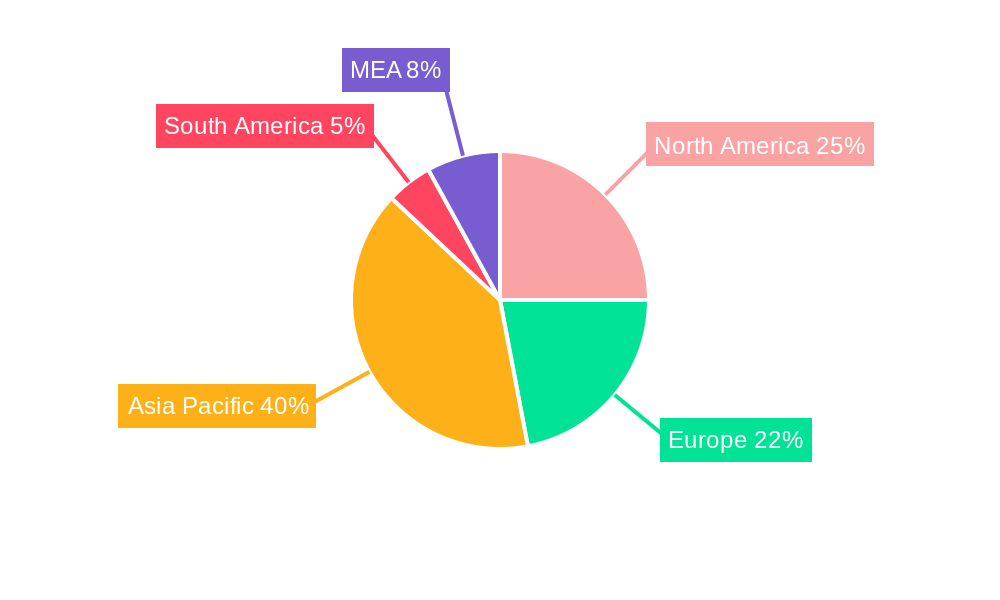
Significant regional variations exist in PON market adoption. North America and Europe are mature markets, with ongoing upgrades and expansions of existing networks. However, the Asia-Pacific region is witnessing the fastest growth, driven by massive infrastructure investments in countries like China and India. The Latin American and Middle Eastern/African markets present considerable growth potential, although they currently lag behind developed regions due to factors like economic conditions and infrastructure limitations. The market’s overall growth is projected to remain robust in the coming years, with continuous technological advancements and expanding applications driving demand. While challenges like high initial investment costs and the need for skilled workforce exist, the long-term benefits of PON technology make it a compelling solution for future network infrastructure. The market is anticipated to surpass $XX billion by 2033, presenting lucrative opportunities for market participants.
Passive Optical Network (PON) Market Report: 2019-2033
Unlocking Growth in the Expanding Passive Optical Network Market: A Comprehensive Analysis
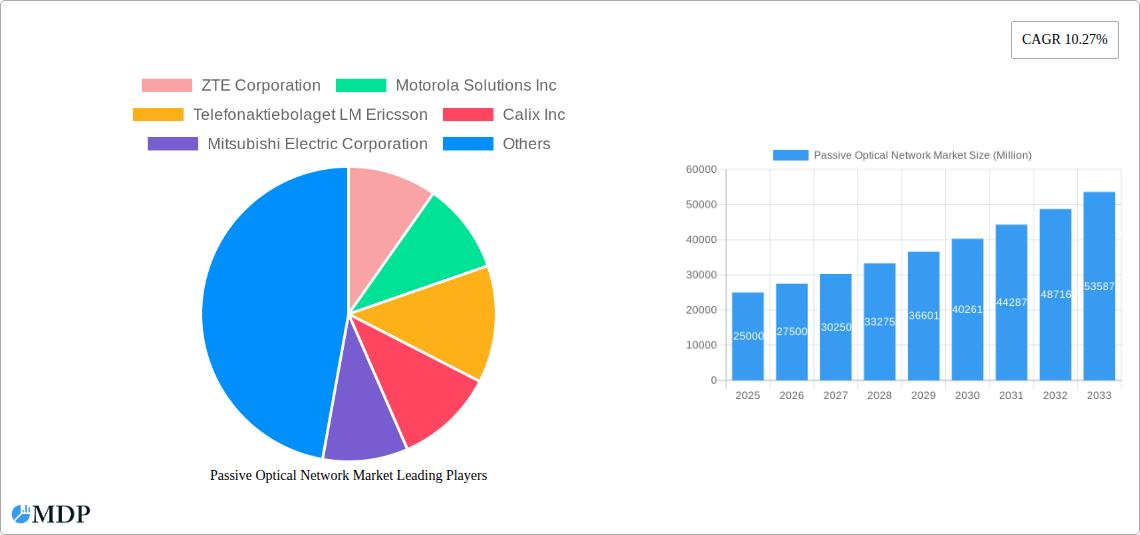
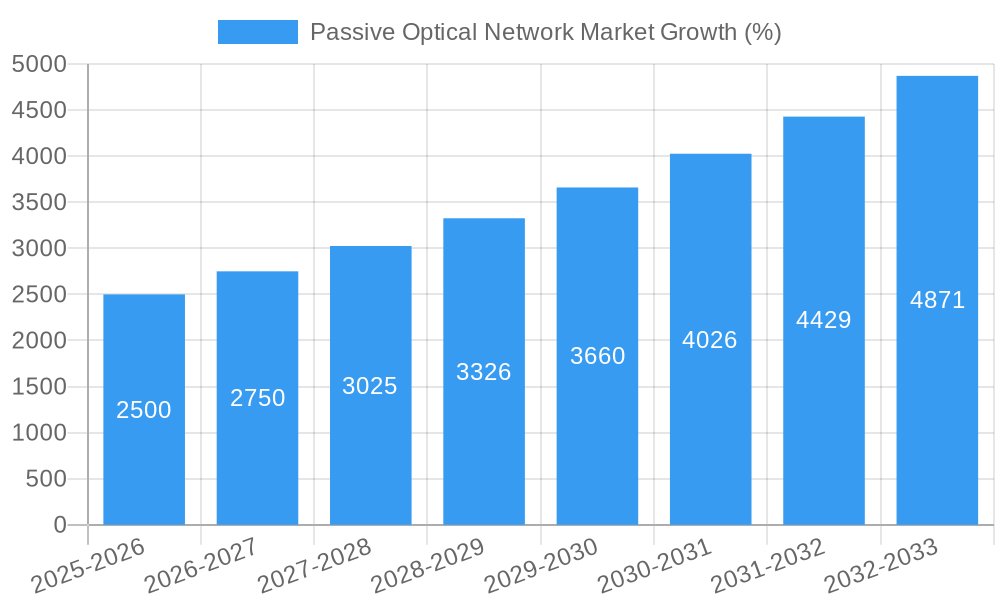
This comprehensive report provides a detailed analysis of the Passive Optical Network (PON) market, offering invaluable insights for investors, industry stakeholders, and strategic decision-makers. Covering the period from 2019 to 2033, with a focus on 2025, this report examines market dynamics, leading players, technological advancements, and future growth opportunities. The market is projected to reach xx Million by 2033, exhibiting a significant CAGR of xx% during the forecast period (2025-2033).
Passive Optical Network Market Market Dynamics & Concentration
The Passive Optical Network (PON) market is characterized by a moderate level of concentration, with key players such as ZTE Corporation, Huawei Technologies Co Ltd, Nokia Corporation, and others holding significant market share. The market's dynamic nature is shaped by several factors:
- Innovation Drivers: Continuous advancements in optical fiber technology, particularly in higher bandwidth capabilities (like XGS-PON and NG-PON2) and improved cost-effectiveness, are driving market growth. The increasing demand for high-speed internet access fuels innovation in PON technologies.
- Regulatory Frameworks: Government initiatives promoting broadband infrastructure development and digital transformation significantly influence market expansion. Favorable regulatory policies in various regions create opportunities for PON deployment.
- Product Substitutes: While alternatives exist, the superior performance and cost-effectiveness of PON solutions in comparison to traditional copper-based networks make it a dominant technology. However, the emergence of wireless technologies might pose a certain level of competition.
- End-User Trends: The proliferation of smart homes, the rise of the Internet of Things (IoT), and the increasing reliance on cloud services are fueling the demand for higher bandwidth capacity – which PON technology effectively addresses. The growing demand for seamless connectivity is directly driving market growth.
- M&A Activities: The recent acquisition of Tibit Communications by Ciena (November 2022) highlights the strategic importance of PON technology and indicates a potential increase in consolidation within the market. The number of M&A deals in the PON sector is estimated to have increased by xx% in 2024 compared to 2019, reflecting the competitive landscape. Market share is expected to shift slightly following recent M&A activity, with top players consolidating their positions.
Passive Optical Network Market Industry Trends & Analysis
The global Passive Optical Network (PON) market is experiencing robust growth, driven by several key trends. The increasing adoption of fiber-to-the-home (FTTH) and fiber-to-the-premises (FTTP) deployments globally is a major catalyst. High-speed internet access requirements for residential and commercial users are driving this market. This trend is further amplified by the rise of 5G networks, which rely heavily on fiber optic infrastructure. The market penetration of PON technology in various regions has increased significantly over the past few years, and this trend is expected to continue throughout the forecast period.
Technological disruptions, such as the introduction of higher-capacity PON standards (e.g., 50G PON and beyond), are constantly pushing the boundaries of performance. Consumer preferences lean toward faster, more reliable internet access, which is directly met by the capabilities of advanced PON systems. The competitive dynamics are marked by continuous product innovation, strategic partnerships, and aggressive market penetration strategies employed by major players. Overall, the market's growth trajectory indicates a positive outlook, with the CAGR remaining strong in the years to come.
Leading Markets & Segments in Passive Optical Network Market
The Asia-Pacific region currently dominates the Passive Optical Network market, driven by robust infrastructure development and substantial government investments in broadband expansion. Specific countries like China and India are key contributors to this regional dominance.
Key Drivers:
- Economic Policies: Favorable government policies and incentives promoting digital infrastructure development significantly boost market growth.
- Infrastructure Development: Extensive investments in fiber optic cable deployments and network upgrades facilitate wider PON adoption.
Dominance Analysis:
- By Structure: The Gigabit Passive Optical Network (GPON) segment currently holds a larger market share compared to Ethernet Passive Optical Network (EPON), primarily due to its higher bandwidth capacity and scalability. However, EPON continues to maintain relevance in certain niche applications.
- By Component: Optical Line Terminals (OLTs) and Optical Network Terminals (ONTs) are the major revenue-generating components, owing to their crucial role in PON system architecture. Optical power splitters and optical cables form a significant market share as well.
Passive Optical Network Market Product Developments
Recent product innovations focus on higher bandwidth capabilities, improved power efficiency, and enhanced network management functionalities. These innovations cater to the evolving needs of high-bandwidth applications like 4K video streaming, online gaming, and virtual reality. The competitive advantages are established through superior performance, cost-effectiveness, and ease of deployment compared to existing technologies. Technological trends revolve around increasing bandwidth, network virtualization, and integration with Software-Defined Networking (SDN) technologies.
Key Drivers of Passive Optical Network Market Growth
Technological advancements in fiber optics, higher bandwidth requirements, increasing adoption of FTTH/FTTP deployments, government initiatives promoting broadband infrastructure, and favorable regulatory environments are all propelling the growth of the Passive Optical Network market. For example, the expansion of 5G networks is directly driving demand for high-bandwidth backhaul solutions, which are effectively met by PON technology.
Challenges in the Passive Optical Network Market Market
The Passive Optical Network market faces challenges such as the high initial investment required for infrastructure deployment, potential supply chain disruptions impacting component availability, and intense competition among major vendors. These factors can affect market growth and profitability, particularly in emerging markets. Regulatory hurdles in certain regions can also hinder market expansion. The overall impact of these challenges is estimated to affect market growth by approximately xx% annually.
Emerging Opportunities in Passive Optical Network Market
The long-term growth of the Passive Optical Network market is fueled by several opportunities. The emergence of next-generation PON technologies (e.g., 50G PON, 100G PON), strategic partnerships to expand market reach, and the increasing demand for high-speed broadband access in underserved regions provide significant growth potential. Furthermore, advancements in network virtualization and software-defined networks are creating new opportunities for market expansion.
Leading Players in the Passive Optical Network Market Sector
- ZTE Corporation
- Motorola Solutions Inc
- Telefonaktiebolaget LM Ericsson
- Calix Inc
- Mitsubishi Electric Corporation
- Verizon Communications Inc
- Huawei Technologies Co Ltd
- Nokia Corporation
- Tellabs Inc
- ADTRAN Inc
Key Milestones in Passive Optical Network Market Industry
- November 2022: Ciena's acquisition of Benu Networks and the planned acquisition of Tibit Communications expands its presence in the next-generation PON market, signaling a shift towards consolidation.
- July 2022: Nokia's installation of a passive optical LAN (POL) solution for Orange in France demonstrates the increasing adoption of PON technology in enterprise settings.
Strategic Outlook for Passive Optical Network Market Market
The future of the Passive Optical Network market appears bright, with continued growth driven by technological advancements, increasing demand for high-speed internet access, and supportive government policies. Strategic partnerships and investments in R&D will play a crucial role in shaping the market landscape in the coming years. The expansion into new markets and the adoption of innovative business models will also contribute to the overall market growth.
Passive Optical Network Market Segmentation
-
1. Structure
- 1.1. Ethernet Passive Optical Network (EPON) Equipment
- 1.2. Gigabit Passive Optical Network (GPON) Equipment
-
2. component
- 2.1. Wavelength Division Multiplexer/De-Multiplexer
- 2.2. Optical filters
- 2.3. Optical power splitters
- 2.4. Optical cables
- 2.5. Optical Line Terminal (OLT)
- 2.6. Optical Network Terminal (ONT)
Passive Optical Network Market Segmentation By Geography
- 1. North America
- 2. Europe
- 3. Asia Pacific
- 4. Latin America
- 5. Middle East
Passive Optical Network Market REPORT HIGHLIGHTS
| Aspects | Details |
|---|---|
| Study Period | 2019-2033 |
| Base Year | 2024 |
| Estimated Year | 2025 |
| Forecast Period | 2025-2033 |
| Historical Period | 2019-2024 |
| Growth Rate | CAGR of 10.27% from 2019-2033 |
| Segmentation |
|
Table of Contents
- 1. Introduction
- 1.1. Research Scope
- 1.2. Market Segmentation
- 1.3. Research Methodology
- 1.4. Definitions and Assumptions
- 2. Executive Summary
- 2.1. Introduction
- 3. Market Dynamics
- 3.1. Introduction
- 3.2. Market Drivers
- 3.2.1. Demand for secure and reliable network operation; Eco-friendly substitute as compared to traditional networks; Low total cost of ownership and high return on investment
- 3.3. Market Restrains
- 3.3.1. High component cost at operator interface
- 3.4. Market Trends
- 3.4.1. GPON Equipments is Expected to Grow Significantly
- 4. Market Factor Analysis
- 4.1. Porters Five Forces
- 4.2. Supply/Value Chain
- 4.3. PESTEL analysis
- 4.4. Market Entropy
- 4.5. Patent/Trademark Analysis
- 5. Global Passive Optical Network Market Analysis, Insights and Forecast, 2019-2031
- 5.1. Market Analysis, Insights and Forecast - by Structure
- 5.1.1. Ethernet Passive Optical Network (EPON) Equipment
- 5.1.2. Gigabit Passive Optical Network (GPON) Equipment
- 5.2. Market Analysis, Insights and Forecast - by component
- 5.2.1. Wavelength Division Multiplexer/De-Multiplexer
- 5.2.2. Optical filters
- 5.2.3. Optical power splitters
- 5.2.4. Optical cables
- 5.2.5. Optical Line Terminal (OLT)
- 5.2.6. Optical Network Terminal (ONT)
- 5.3. Market Analysis, Insights and Forecast - by Region
- 5.3.1. North America
- 5.3.2. Europe
- 5.3.3. Asia Pacific
- 5.3.4. Latin America
- 5.3.5. Middle East
- 5.1. Market Analysis, Insights and Forecast - by Structure
- 6. North America Passive Optical Network Market Analysis, Insights and Forecast, 2019-2031
- 6.1. Market Analysis, Insights and Forecast - by Structure
- 6.1.1. Ethernet Passive Optical Network (EPON) Equipment
- 6.1.2. Gigabit Passive Optical Network (GPON) Equipment
- 6.2. Market Analysis, Insights and Forecast - by component
- 6.2.1. Wavelength Division Multiplexer/De-Multiplexer
- 6.2.2. Optical filters
- 6.2.3. Optical power splitters
- 6.2.4. Optical cables
- 6.2.5. Optical Line Terminal (OLT)
- 6.2.6. Optical Network Terminal (ONT)
- 6.1. Market Analysis, Insights and Forecast - by Structure
- 7. Europe Passive Optical Network Market Analysis, Insights and Forecast, 2019-2031
- 7.1. Market Analysis, Insights and Forecast - by Structure
- 7.1.1. Ethernet Passive Optical Network (EPON) Equipment
- 7.1.2. Gigabit Passive Optical Network (GPON) Equipment
- 7.2. Market Analysis, Insights and Forecast - by component
- 7.2.1. Wavelength Division Multiplexer/De-Multiplexer
- 7.2.2. Optical filters
- 7.2.3. Optical power splitters
- 7.2.4. Optical cables
- 7.2.5. Optical Line Terminal (OLT)
- 7.2.6. Optical Network Terminal (ONT)
- 7.1. Market Analysis, Insights and Forecast - by Structure
- 8. Asia Pacific Passive Optical Network Market Analysis, Insights and Forecast, 2019-2031
- 8.1. Market Analysis, Insights and Forecast - by Structure
- 8.1.1. Ethernet Passive Optical Network (EPON) Equipment
- 8.1.2. Gigabit Passive Optical Network (GPON) Equipment
- 8.2. Market Analysis, Insights and Forecast - by component
- 8.2.1. Wavelength Division Multiplexer/De-Multiplexer
- 8.2.2. Optical filters
- 8.2.3. Optical power splitters
- 8.2.4. Optical cables
- 8.2.5. Optical Line Terminal (OLT)
- 8.2.6. Optical Network Terminal (ONT)
- 8.1. Market Analysis, Insights and Forecast - by Structure
- 9. Latin America Passive Optical Network Market Analysis, Insights and Forecast, 2019-2031
- 9.1. Market Analysis, Insights and Forecast - by Structure
- 9.1.1. Ethernet Passive Optical Network (EPON) Equipment
- 9.1.2. Gigabit Passive Optical Network (GPON) Equipment
- 9.2. Market Analysis, Insights and Forecast - by component
- 9.2.1. Wavelength Division Multiplexer/De-Multiplexer
- 9.2.2. Optical filters
- 9.2.3. Optical power splitters
- 9.2.4. Optical cables
- 9.2.5. Optical Line Terminal (OLT)
- 9.2.6. Optical Network Terminal (ONT)
- 9.1. Market Analysis, Insights and Forecast - by Structure
- 10. Middle East Passive Optical Network Market Analysis, Insights and Forecast, 2019-2031
- 10.1. Market Analysis, Insights and Forecast - by Structure
- 10.1.1. Ethernet Passive Optical Network (EPON) Equipment
- 10.1.2. Gigabit Passive Optical Network (GPON) Equipment
- 10.2. Market Analysis, Insights and Forecast - by component
- 10.2.1. Wavelength Division Multiplexer/De-Multiplexer
- 10.2.2. Optical filters
- 10.2.3. Optical power splitters
- 10.2.4. Optical cables
- 10.2.5. Optical Line Terminal (OLT)
- 10.2.6. Optical Network Terminal (ONT)
- 10.1. Market Analysis, Insights and Forecast - by Structure
- 11. North America Passive Optical Network Market Analysis, Insights and Forecast, 2019-2031
- 11.1. Market Analysis, Insights and Forecast - By Country/Sub-region
- 11.1.1 United States
- 11.1.2 Canada
- 11.1.3 Mexico
- 12. Europe Passive Optical Network Market Analysis, Insights and Forecast, 2019-2031
- 12.1. Market Analysis, Insights and Forecast - By Country/Sub-region
- 12.1.1 Germany
- 12.1.2 United Kingdom
- 12.1.3 France
- 12.1.4 Spain
- 12.1.5 Italy
- 12.1.6 Spain
- 12.1.7 Belgium
- 12.1.8 Netherland
- 12.1.9 Nordics
- 12.1.10 Rest of Europe
- 13. Asia Pacific Passive Optical Network Market Analysis, Insights and Forecast, 2019-2031
- 13.1. Market Analysis, Insights and Forecast - By Country/Sub-region
- 13.1.1 China
- 13.1.2 Japan
- 13.1.3 India
- 13.1.4 South Korea
- 13.1.5 Southeast Asia
- 13.1.6 Australia
- 13.1.7 Indonesia
- 13.1.8 Phillipes
- 13.1.9 Singapore
- 13.1.10 Thailandc
- 13.1.11 Rest of Asia Pacific
- 14. South America Passive Optical Network Market Analysis, Insights and Forecast, 2019-2031
- 14.1. Market Analysis, Insights and Forecast - By Country/Sub-region
- 14.1.1 Brazil
- 14.1.2 Argentina
- 14.1.3 Peru
- 14.1.4 Chile
- 14.1.5 Colombia
- 14.1.6 Ecuador
- 14.1.7 Venezuela
- 14.1.8 Rest of South America
- 15. North America Passive Optical Network Market Analysis, Insights and Forecast, 2019-2031
- 15.1. Market Analysis, Insights and Forecast - By Country/Sub-region
- 15.1.1 United States
- 15.1.2 Canada
- 15.1.3 Mexico
- 16. MEA Passive Optical Network Market Analysis, Insights and Forecast, 2019-2031
- 16.1. Market Analysis, Insights and Forecast - By Country/Sub-region
- 16.1.1 United Arab Emirates
- 16.1.2 Saudi Arabia
- 16.1.3 South Africa
- 16.1.4 Rest of Middle East and Africa
- 17. Competitive Analysis
- 17.1. Global Market Share Analysis 2024
- 17.2. Company Profiles
- 17.2.1 ZTE Corporation
- 17.2.1.1. Overview
- 17.2.1.2. Products
- 17.2.1.3. SWOT Analysis
- 17.2.1.4. Recent Developments
- 17.2.1.5. Financials (Based on Availability)
- 17.2.2 Motorola Solutions Inc
- 17.2.2.1. Overview
- 17.2.2.2. Products
- 17.2.2.3. SWOT Analysis
- 17.2.2.4. Recent Developments
- 17.2.2.5. Financials (Based on Availability)
- 17.2.3 Telefonaktiebolaget LM Ericsson
- 17.2.3.1. Overview
- 17.2.3.2. Products
- 17.2.3.3. SWOT Analysis
- 17.2.3.4. Recent Developments
- 17.2.3.5. Financials (Based on Availability)
- 17.2.4 Calix Inc
- 17.2.4.1. Overview
- 17.2.4.2. Products
- 17.2.4.3. SWOT Analysis
- 17.2.4.4. Recent Developments
- 17.2.4.5. Financials (Based on Availability)
- 17.2.5 Mitsubishi Electric Corporation
- 17.2.5.1. Overview
- 17.2.5.2. Products
- 17.2.5.3. SWOT Analysis
- 17.2.5.4. Recent Developments
- 17.2.5.5. Financials (Based on Availability)
- 17.2.6 Verizon Communications Inc
- 17.2.6.1. Overview
- 17.2.6.2. Products
- 17.2.6.3. SWOT Analysis
- 17.2.6.4. Recent Developments
- 17.2.6.5. Financials (Based on Availability)
- 17.2.7 Huawei Technologies Co Ltd
- 17.2.7.1. Overview
- 17.2.7.2. Products
- 17.2.7.3. SWOT Analysis
- 17.2.7.4. Recent Developments
- 17.2.7.5. Financials (Based on Availability)
- 17.2.8 Nokia Corporation
- 17.2.8.1. Overview
- 17.2.8.2. Products
- 17.2.8.3. SWOT Analysis
- 17.2.8.4. Recent Developments
- 17.2.8.5. Financials (Based on Availability)
- 17.2.9 Tellabs Inc
- 17.2.9.1. Overview
- 17.2.9.2. Products
- 17.2.9.3. SWOT Analysis
- 17.2.9.4. Recent Developments
- 17.2.9.5. Financials (Based on Availability)
- 17.2.10 ADTRAN Inc
- 17.2.10.1. Overview
- 17.2.10.2. Products
- 17.2.10.3. SWOT Analysis
- 17.2.10.4. Recent Developments
- 17.2.10.5. Financials (Based on Availability)
- 17.2.1 ZTE Corporation
List of Figures
- Figure 1: Global Passive Optical Network Market Revenue Breakdown (Million, %) by Region 2024 & 2032
- Figure 2: Global Passive Optical Network Market Volume Breakdown (K Unit, %) by Region 2024 & 2032
- Figure 3: North America Passive Optical Network Market Revenue (Million), by Country 2024 & 2032
- Figure 4: North America Passive Optical Network Market Volume (K Unit), by Country 2024 & 2032
- Figure 5: North America Passive Optical Network Market Revenue Share (%), by Country 2024 & 2032
- Figure 6: North America Passive Optical Network Market Volume Share (%), by Country 2024 & 2032
- Figure 7: Europe Passive Optical Network Market Revenue (Million), by Country 2024 & 2032
- Figure 8: Europe Passive Optical Network Market Volume (K Unit), by Country 2024 & 2032
- Figure 9: Europe Passive Optical Network Market Revenue Share (%), by Country 2024 & 2032
- Figure 10: Europe Passive Optical Network Market Volume Share (%), by Country 2024 & 2032
- Figure 11: Asia Pacific Passive Optical Network Market Revenue (Million), by Country 2024 & 2032
- Figure 12: Asia Pacific Passive Optical Network Market Volume (K Unit), by Country 2024 & 2032
- Figure 13: Asia Pacific Passive Optical Network Market Revenue Share (%), by Country 2024 & 2032
- Figure 14: Asia Pacific Passive Optical Network Market Volume Share (%), by Country 2024 & 2032
- Figure 15: South America Passive Optical Network Market Revenue (Million), by Country 2024 & 2032
- Figure 16: South America Passive Optical Network Market Volume (K Unit), by Country 2024 & 2032
- Figure 17: South America Passive Optical Network Market Revenue Share (%), by Country 2024 & 2032
- Figure 18: South America Passive Optical Network Market Volume Share (%), by Country 2024 & 2032
- Figure 19: North America Passive Optical Network Market Revenue (Million), by Country 2024 & 2032
- Figure 20: North America Passive Optical Network Market Volume (K Unit), by Country 2024 & 2032
- Figure 21: North America Passive Optical Network Market Revenue Share (%), by Country 2024 & 2032
- Figure 22: North America Passive Optical Network Market Volume Share (%), by Country 2024 & 2032
- Figure 23: MEA Passive Optical Network Market Revenue (Million), by Country 2024 & 2032
- Figure 24: MEA Passive Optical Network Market Volume (K Unit), by Country 2024 & 2032
- Figure 25: MEA Passive Optical Network Market Revenue Share (%), by Country 2024 & 2032
- Figure 26: MEA Passive Optical Network Market Volume Share (%), by Country 2024 & 2032
- Figure 27: North America Passive Optical Network Market Revenue (Million), by Structure 2024 & 2032
- Figure 28: North America Passive Optical Network Market Volume (K Unit), by Structure 2024 & 2032
- Figure 29: North America Passive Optical Network Market Revenue Share (%), by Structure 2024 & 2032
- Figure 30: North America Passive Optical Network Market Volume Share (%), by Structure 2024 & 2032
- Figure 31: North America Passive Optical Network Market Revenue (Million), by component 2024 & 2032
- Figure 32: North America Passive Optical Network Market Volume (K Unit), by component 2024 & 2032
- Figure 33: North America Passive Optical Network Market Revenue Share (%), by component 2024 & 2032
- Figure 34: North America Passive Optical Network Market Volume Share (%), by component 2024 & 2032
- Figure 35: North America Passive Optical Network Market Revenue (Million), by Country 2024 & 2032
- Figure 36: North America Passive Optical Network Market Volume (K Unit), by Country 2024 & 2032
- Figure 37: North America Passive Optical Network Market Revenue Share (%), by Country 2024 & 2032
- Figure 38: North America Passive Optical Network Market Volume Share (%), by Country 2024 & 2032
- Figure 39: Europe Passive Optical Network Market Revenue (Million), by Structure 2024 & 2032
- Figure 40: Europe Passive Optical Network Market Volume (K Unit), by Structure 2024 & 2032
- Figure 41: Europe Passive Optical Network Market Revenue Share (%), by Structure 2024 & 2032
- Figure 42: Europe Passive Optical Network Market Volume Share (%), by Structure 2024 & 2032
- Figure 43: Europe Passive Optical Network Market Revenue (Million), by component 2024 & 2032
- Figure 44: Europe Passive Optical Network Market Volume (K Unit), by component 2024 & 2032
- Figure 45: Europe Passive Optical Network Market Revenue Share (%), by component 2024 & 2032
- Figure 46: Europe Passive Optical Network Market Volume Share (%), by component 2024 & 2032
- Figure 47: Europe Passive Optical Network Market Revenue (Million), by Country 2024 & 2032
- Figure 48: Europe Passive Optical Network Market Volume (K Unit), by Country 2024 & 2032
- Figure 49: Europe Passive Optical Network Market Revenue Share (%), by Country 2024 & 2032
- Figure 50: Europe Passive Optical Network Market Volume Share (%), by Country 2024 & 2032
- Figure 51: Asia Pacific Passive Optical Network Market Revenue (Million), by Structure 2024 & 2032
- Figure 52: Asia Pacific Passive Optical Network Market Volume (K Unit), by Structure 2024 & 2032
- Figure 53: Asia Pacific Passive Optical Network Market Revenue Share (%), by Structure 2024 & 2032
- Figure 54: Asia Pacific Passive Optical Network Market Volume Share (%), by Structure 2024 & 2032
- Figure 55: Asia Pacific Passive Optical Network Market Revenue (Million), by component 2024 & 2032
- Figure 56: Asia Pacific Passive Optical Network Market Volume (K Unit), by component 2024 & 2032
- Figure 57: Asia Pacific Passive Optical Network Market Revenue Share (%), by component 2024 & 2032
- Figure 58: Asia Pacific Passive Optical Network Market Volume Share (%), by component 2024 & 2032
- Figure 59: Asia Pacific Passive Optical Network Market Revenue (Million), by Country 2024 & 2032
- Figure 60: Asia Pacific Passive Optical Network Market Volume (K Unit), by Country 2024 & 2032
- Figure 61: Asia Pacific Passive Optical Network Market Revenue Share (%), by Country 2024 & 2032
- Figure 62: Asia Pacific Passive Optical Network Market Volume Share (%), by Country 2024 & 2032
- Figure 63: Latin America Passive Optical Network Market Revenue (Million), by Structure 2024 & 2032
- Figure 64: Latin America Passive Optical Network Market Volume (K Unit), by Structure 2024 & 2032
- Figure 65: Latin America Passive Optical Network Market Revenue Share (%), by Structure 2024 & 2032
- Figure 66: Latin America Passive Optical Network Market Volume Share (%), by Structure 2024 & 2032
- Figure 67: Latin America Passive Optical Network Market Revenue (Million), by component 2024 & 2032
- Figure 68: Latin America Passive Optical Network Market Volume (K Unit), by component 2024 & 2032
- Figure 69: Latin America Passive Optical Network Market Revenue Share (%), by component 2024 & 2032
- Figure 70: Latin America Passive Optical Network Market Volume Share (%), by component 2024 & 2032
- Figure 71: Latin America Passive Optical Network Market Revenue (Million), by Country 2024 & 2032
- Figure 72: Latin America Passive Optical Network Market Volume (K Unit), by Country 2024 & 2032
- Figure 73: Latin America Passive Optical Network Market Revenue Share (%), by Country 2024 & 2032
- Figure 74: Latin America Passive Optical Network Market Volume Share (%), by Country 2024 & 2032
- Figure 75: Middle East Passive Optical Network Market Revenue (Million), by Structure 2024 & 2032
- Figure 76: Middle East Passive Optical Network Market Volume (K Unit), by Structure 2024 & 2032
- Figure 77: Middle East Passive Optical Network Market Revenue Share (%), by Structure 2024 & 2032
- Figure 78: Middle East Passive Optical Network Market Volume Share (%), by Structure 2024 & 2032
- Figure 79: Middle East Passive Optical Network Market Revenue (Million), by component 2024 & 2032
- Figure 80: Middle East Passive Optical Network Market Volume (K Unit), by component 2024 & 2032
- Figure 81: Middle East Passive Optical Network Market Revenue Share (%), by component 2024 & 2032
- Figure 82: Middle East Passive Optical Network Market Volume Share (%), by component 2024 & 2032
- Figure 83: Middle East Passive Optical Network Market Revenue (Million), by Country 2024 & 2032
- Figure 84: Middle East Passive Optical Network Market Volume (K Unit), by Country 2024 & 2032
- Figure 85: Middle East Passive Optical Network Market Revenue Share (%), by Country 2024 & 2032
- Figure 86: Middle East Passive Optical Network Market Volume Share (%), by Country 2024 & 2032
List of Tables
- Table 1: Global Passive Optical Network Market Revenue Million Forecast, by Region 2019 & 2032
- Table 2: Global Passive Optical Network Market Volume K Unit Forecast, by Region 2019 & 2032
- Table 3: Global Passive Optical Network Market Revenue Million Forecast, by Structure 2019 & 2032
- Table 4: Global Passive Optical Network Market Volume K Unit Forecast, by Structure 2019 & 2032
- Table 5: Global Passive Optical Network Market Revenue Million Forecast, by component 2019 & 2032
- Table 6: Global Passive Optical Network Market Volume K Unit Forecast, by component 2019 & 2032
- Table 7: Global Passive Optical Network Market Revenue Million Forecast, by Region 2019 & 2032
- Table 8: Global Passive Optical Network Market Volume K Unit Forecast, by Region 2019 & 2032
- Table 9: Global Passive Optical Network Market Revenue Million Forecast, by Country 2019 & 2032
- Table 10: Global Passive Optical Network Market Volume K Unit Forecast, by Country 2019 & 2032
- Table 11: United States Passive Optical Network Market Revenue (Million) Forecast, by Application 2019 & 2032
- Table 12: United States Passive Optical Network Market Volume (K Unit) Forecast, by Application 2019 & 2032
- Table 13: Canada Passive Optical Network Market Revenue (Million) Forecast, by Application 2019 & 2032
- Table 14: Canada Passive Optical Network Market Volume (K Unit) Forecast, by Application 2019 & 2032
- Table 15: Mexico Passive Optical Network Market Revenue (Million) Forecast, by Application 2019 & 2032
- Table 16: Mexico Passive Optical Network Market Volume (K Unit) Forecast, by Application 2019 & 2032
- Table 17: Global Passive Optical Network Market Revenue Million Forecast, by Country 2019 & 2032
- Table 18: Global Passive Optical Network Market Volume K Unit Forecast, by Country 2019 & 2032
- Table 19: Germany Passive Optical Network Market Revenue (Million) Forecast, by Application 2019 & 2032
- Table 20: Germany Passive Optical Network Market Volume (K Unit) Forecast, by Application 2019 & 2032
- Table 21: United Kingdom Passive Optical Network Market Revenue (Million) Forecast, by Application 2019 & 2032
- Table 22: United Kingdom Passive Optical Network Market Volume (K Unit) Forecast, by Application 2019 & 2032
- Table 23: France Passive Optical Network Market Revenue (Million) Forecast, by Application 2019 & 2032
- Table 24: France Passive Optical Network Market Volume (K Unit) Forecast, by Application 2019 & 2032
- Table 25: Spain Passive Optical Network Market Revenue (Million) Forecast, by Application 2019 & 2032
- Table 26: Spain Passive Optical Network Market Volume (K Unit) Forecast, by Application 2019 & 2032
- Table 27: Italy Passive Optical Network Market Revenue (Million) Forecast, by Application 2019 & 2032
- Table 28: Italy Passive Optical Network Market Volume (K Unit) Forecast, by Application 2019 & 2032
- Table 29: Spain Passive Optical Network Market Revenue (Million) Forecast, by Application 2019 & 2032
- Table 30: Spain Passive Optical Network Market Volume (K Unit) Forecast, by Application 2019 & 2032
- Table 31: Belgium Passive Optical Network Market Revenue (Million) Forecast, by Application 2019 & 2032
- Table 32: Belgium Passive Optical Network Market Volume (K Unit) Forecast, by Application 2019 & 2032
- Table 33: Netherland Passive Optical Network Market Revenue (Million) Forecast, by Application 2019 & 2032
- Table 34: Netherland Passive Optical Network Market Volume (K Unit) Forecast, by Application 2019 & 2032
- Table 35: Nordics Passive Optical Network Market Revenue (Million) Forecast, by Application 2019 & 2032
- Table 36: Nordics Passive Optical Network Market Volume (K Unit) Forecast, by Application 2019 & 2032
- Table 37: Rest of Europe Passive Optical Network Market Revenue (Million) Forecast, by Application 2019 & 2032
- Table 38: Rest of Europe Passive Optical Network Market Volume (K Unit) Forecast, by Application 2019 & 2032
- Table 39: Global Passive Optical Network Market Revenue Million Forecast, by Country 2019 & 2032
- Table 40: Global Passive Optical Network Market Volume K Unit Forecast, by Country 2019 & 2032
- Table 41: China Passive Optical Network Market Revenue (Million) Forecast, by Application 2019 & 2032
- Table 42: China Passive Optical Network Market Volume (K Unit) Forecast, by Application 2019 & 2032
- Table 43: Japan Passive Optical Network Market Revenue (Million) Forecast, by Application 2019 & 2032
- Table 44: Japan Passive Optical Network Market Volume (K Unit) Forecast, by Application 2019 & 2032
- Table 45: India Passive Optical Network Market Revenue (Million) Forecast, by Application 2019 & 2032
- Table 46: India Passive Optical Network Market Volume (K Unit) Forecast, by Application 2019 & 2032
- Table 47: South Korea Passive Optical Network Market Revenue (Million) Forecast, by Application 2019 & 2032
- Table 48: South Korea Passive Optical Network Market Volume (K Unit) Forecast, by Application 2019 & 2032
- Table 49: Southeast Asia Passive Optical Network Market Revenue (Million) Forecast, by Application 2019 & 2032
- Table 50: Southeast Asia Passive Optical Network Market Volume (K Unit) Forecast, by Application 2019 & 2032
- Table 51: Australia Passive Optical Network Market Revenue (Million) Forecast, by Application 2019 & 2032
- Table 52: Australia Passive Optical Network Market Volume (K Unit) Forecast, by Application 2019 & 2032
- Table 53: Indonesia Passive Optical Network Market Revenue (Million) Forecast, by Application 2019 & 2032
- Table 54: Indonesia Passive Optical Network Market Volume (K Unit) Forecast, by Application 2019 & 2032
- Table 55: Phillipes Passive Optical Network Market Revenue (Million) Forecast, by Application 2019 & 2032
- Table 56: Phillipes Passive Optical Network Market Volume (K Unit) Forecast, by Application 2019 & 2032
- Table 57: Singapore Passive Optical Network Market Revenue (Million) Forecast, by Application 2019 & 2032
- Table 58: Singapore Passive Optical Network Market Volume (K Unit) Forecast, by Application 2019 & 2032
- Table 59: Thailandc Passive Optical Network Market Revenue (Million) Forecast, by Application 2019 & 2032
- Table 60: Thailandc Passive Optical Network Market Volume (K Unit) Forecast, by Application 2019 & 2032
- Table 61: Rest of Asia Pacific Passive Optical Network Market Revenue (Million) Forecast, by Application 2019 & 2032
- Table 62: Rest of Asia Pacific Passive Optical Network Market Volume (K Unit) Forecast, by Application 2019 & 2032
- Table 63: Global Passive Optical Network Market Revenue Million Forecast, by Country 2019 & 2032
- Table 64: Global Passive Optical Network Market Volume K Unit Forecast, by Country 2019 & 2032
- Table 65: Brazil Passive Optical Network Market Revenue (Million) Forecast, by Application 2019 & 2032
- Table 66: Brazil Passive Optical Network Market Volume (K Unit) Forecast, by Application 2019 & 2032
- Table 67: Argentina Passive Optical Network Market Revenue (Million) Forecast, by Application 2019 & 2032
- Table 68: Argentina Passive Optical Network Market Volume (K Unit) Forecast, by Application 2019 & 2032
- Table 69: Peru Passive Optical Network Market Revenue (Million) Forecast, by Application 2019 & 2032
- Table 70: Peru Passive Optical Network Market Volume (K Unit) Forecast, by Application 2019 & 2032
- Table 71: Chile Passive Optical Network Market Revenue (Million) Forecast, by Application 2019 & 2032
- Table 72: Chile Passive Optical Network Market Volume (K Unit) Forecast, by Application 2019 & 2032
- Table 73: Colombia Passive Optical Network Market Revenue (Million) Forecast, by Application 2019 & 2032
- Table 74: Colombia Passive Optical Network Market Volume (K Unit) Forecast, by Application 2019 & 2032
- Table 75: Ecuador Passive Optical Network Market Revenue (Million) Forecast, by Application 2019 & 2032
- Table 76: Ecuador Passive Optical Network Market Volume (K Unit) Forecast, by Application 2019 & 2032
- Table 77: Venezuela Passive Optical Network Market Revenue (Million) Forecast, by Application 2019 & 2032
- Table 78: Venezuela Passive Optical Network Market Volume (K Unit) Forecast, by Application 2019 & 2032
- Table 79: Rest of South America Passive Optical Network Market Revenue (Million) Forecast, by Application 2019 & 2032
- Table 80: Rest of South America Passive Optical Network Market Volume (K Unit) Forecast, by Application 2019 & 2032
- Table 81: Global Passive Optical Network Market Revenue Million Forecast, by Country 2019 & 2032
- Table 82: Global Passive Optical Network Market Volume K Unit Forecast, by Country 2019 & 2032
- Table 83: United States Passive Optical Network Market Revenue (Million) Forecast, by Application 2019 & 2032
- Table 84: United States Passive Optical Network Market Volume (K Unit) Forecast, by Application 2019 & 2032
- Table 85: Canada Passive Optical Network Market Revenue (Million) Forecast, by Application 2019 & 2032
- Table 86: Canada Passive Optical Network Market Volume (K Unit) Forecast, by Application 2019 & 2032
- Table 87: Mexico Passive Optical Network Market Revenue (Million) Forecast, by Application 2019 & 2032
- Table 88: Mexico Passive Optical Network Market Volume (K Unit) Forecast, by Application 2019 & 2032
- Table 89: Global Passive Optical Network Market Revenue Million Forecast, by Country 2019 & 2032
- Table 90: Global Passive Optical Network Market Volume K Unit Forecast, by Country 2019 & 2032
- Table 91: United Arab Emirates Passive Optical Network Market Revenue (Million) Forecast, by Application 2019 & 2032
- Table 92: United Arab Emirates Passive Optical Network Market Volume (K Unit) Forecast, by Application 2019 & 2032
- Table 93: Saudi Arabia Passive Optical Network Market Revenue (Million) Forecast, by Application 2019 & 2032
- Table 94: Saudi Arabia Passive Optical Network Market Volume (K Unit) Forecast, by Application 2019 & 2032
- Table 95: South Africa Passive Optical Network Market Revenue (Million) Forecast, by Application 2019 & 2032
- Table 96: South Africa Passive Optical Network Market Volume (K Unit) Forecast, by Application 2019 & 2032
- Table 97: Rest of Middle East and Africa Passive Optical Network Market Revenue (Million) Forecast, by Application 2019 & 2032
- Table 98: Rest of Middle East and Africa Passive Optical Network Market Volume (K Unit) Forecast, by Application 2019 & 2032
- Table 99: Global Passive Optical Network Market Revenue Million Forecast, by Structure 2019 & 2032
- Table 100: Global Passive Optical Network Market Volume K Unit Forecast, by Structure 2019 & 2032
- Table 101: Global Passive Optical Network Market Revenue Million Forecast, by component 2019 & 2032
- Table 102: Global Passive Optical Network Market Volume K Unit Forecast, by component 2019 & 2032
- Table 103: Global Passive Optical Network Market Revenue Million Forecast, by Country 2019 & 2032
- Table 104: Global Passive Optical Network Market Volume K Unit Forecast, by Country 2019 & 2032
- Table 105: Global Passive Optical Network Market Revenue Million Forecast, by Structure 2019 & 2032
- Table 106: Global Passive Optical Network Market Volume K Unit Forecast, by Structure 2019 & 2032
- Table 107: Global Passive Optical Network Market Revenue Million Forecast, by component 2019 & 2032
- Table 108: Global Passive Optical Network Market Volume K Unit Forecast, by component 2019 & 2032
- Table 109: Global Passive Optical Network Market Revenue Million Forecast, by Country 2019 & 2032
- Table 110: Global Passive Optical Network Market Volume K Unit Forecast, by Country 2019 & 2032
- Table 111: Global Passive Optical Network Market Revenue Million Forecast, by Structure 2019 & 2032
- Table 112: Global Passive Optical Network Market Volume K Unit Forecast, by Structure 2019 & 2032
- Table 113: Global Passive Optical Network Market Revenue Million Forecast, by component 2019 & 2032
- Table 114: Global Passive Optical Network Market Volume K Unit Forecast, by component 2019 & 2032
- Table 115: Global Passive Optical Network Market Revenue Million Forecast, by Country 2019 & 2032
- Table 116: Global Passive Optical Network Market Volume K Unit Forecast, by Country 2019 & 2032
- Table 117: Global Passive Optical Network Market Revenue Million Forecast, by Structure 2019 & 2032
- Table 118: Global Passive Optical Network Market Volume K Unit Forecast, by Structure 2019 & 2032
- Table 119: Global Passive Optical Network Market Revenue Million Forecast, by component 2019 & 2032
- Table 120: Global Passive Optical Network Market Volume K Unit Forecast, by component 2019 & 2032
- Table 121: Global Passive Optical Network Market Revenue Million Forecast, by Country 2019 & 2032
- Table 122: Global Passive Optical Network Market Volume K Unit Forecast, by Country 2019 & 2032
- Table 123: Global Passive Optical Network Market Revenue Million Forecast, by Structure 2019 & 2032
- Table 124: Global Passive Optical Network Market Volume K Unit Forecast, by Structure 2019 & 2032
- Table 125: Global Passive Optical Network Market Revenue Million Forecast, by component 2019 & 2032
- Table 126: Global Passive Optical Network Market Volume K Unit Forecast, by component 2019 & 2032
- Table 127: Global Passive Optical Network Market Revenue Million Forecast, by Country 2019 & 2032
- Table 128: Global Passive Optical Network Market Volume K Unit Forecast, by Country 2019 & 2032
Frequently Asked Questions
1. What is the projected Compound Annual Growth Rate (CAGR) of the Passive Optical Network Market?
The projected CAGR is approximately 10.27%.
2. Which companies are prominent players in the Passive Optical Network Market?
Key companies in the market include ZTE Corporation, Motorola Solutions Inc, Telefonaktiebolaget LM Ericsson, Calix Inc, Mitsubishi Electric Corporation, Verizon Communications Inc, Huawei Technologies Co Ltd, Nokia Corporation, Tellabs Inc, ADTRAN Inc.
3. What are the main segments of the Passive Optical Network Market?
The market segments include Structure, component.
4. Can you provide details about the market size?
The market size is estimated to be USD XX Million as of 2022.
5. What are some drivers contributing to market growth?
Demand for secure and reliable network operation; Eco-friendly substitute as compared to traditional networks; Low total cost of ownership and high return on investment.
6. What are the notable trends driving market growth?
GPON Equipments is Expected to Grow Significantly.
7. Are there any restraints impacting market growth?
High component cost at operator interface.
8. Can you provide examples of recent developments in the market?
November 2022: Ciena, the optical networking company, expanded its technology offering into the broadband access, virtualized routing, and subscriber management domains with the acquisition of network-edge telco software specialist Benu Networks and the scheduled acquisition of next-generation passive optical network (PON) vendor Tibit Communications.
9. What pricing options are available for accessing the report?
Pricing options include single-user, multi-user, and enterprise licenses priced at USD 4750, USD 5250, and USD 8750 respectively.
10. Is the market size provided in terms of value or volume?
The market size is provided in terms of value, measured in Million and volume, measured in K Unit.
11. Are there any specific market keywords associated with the report?
Yes, the market keyword associated with the report is "Passive Optical Network Market," which aids in identifying and referencing the specific market segment covered.
12. How do I determine which pricing option suits my needs best?
The pricing options vary based on user requirements and access needs. Individual users may opt for single-user licenses, while businesses requiring broader access may choose multi-user or enterprise licenses for cost-effective access to the report.
13. Are there any additional resources or data provided in the Passive Optical Network Market report?
While the report offers comprehensive insights, it's advisable to review the specific contents or supplementary materials provided to ascertain if additional resources or data are available.
14. How can I stay updated on further developments or reports in the Passive Optical Network Market?
To stay informed about further developments, trends, and reports in the Passive Optical Network Market, consider subscribing to industry newsletters, following relevant companies and organizations, or regularly checking reputable industry news sources and publications.
Methodology
Step 1 - Identification of Relevant Samples Size from Population Database


Step 2 - Approaches for Defining Global Market Size (Value, Volume* & Price*)

Note*: In applicable scenarios
Step 3 - Data Sources
Primary Research
- Web Analytics
- Survey Reports
- Research Institute
- Latest Research Reports
- Opinion Leaders
Secondary Research
- Annual Reports
- White Paper
- Latest Press Release
- Industry Association
- Paid Database
- Investor Presentations

Step 4 - Data Triangulation
Involves using different sources of information in order to increase the validity of a study
These sources are likely to be stakeholders in a program - participants, other researchers, program staff, other community members, and so on.
Then we put all data in single framework & apply various statistical tools to find out the dynamic on the market.
During the analysis stage, feedback from the stakeholder groups would be compared to determine areas of agreement as well as areas of divergence
