

Key Insights
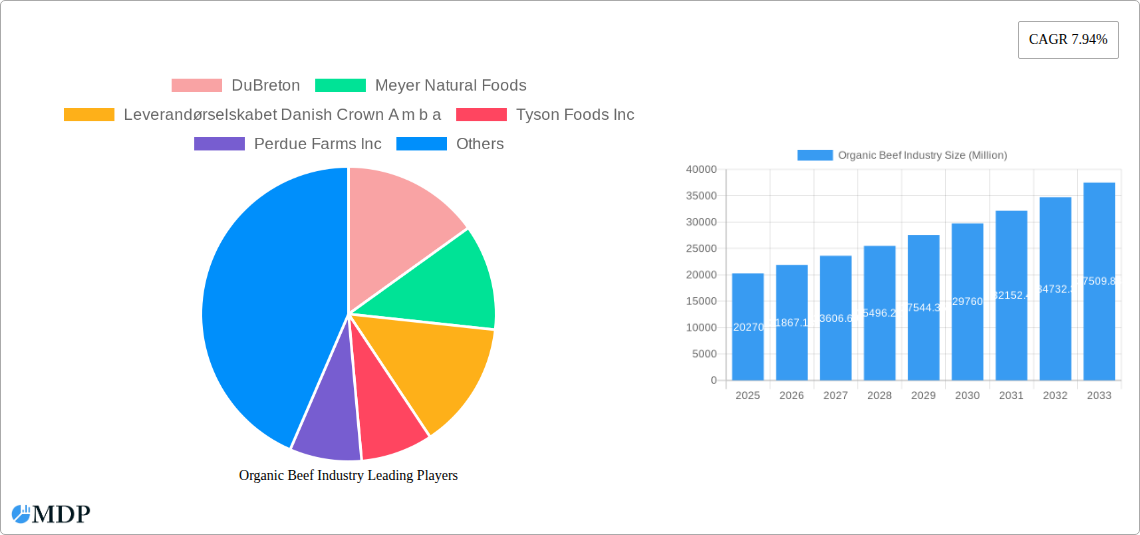
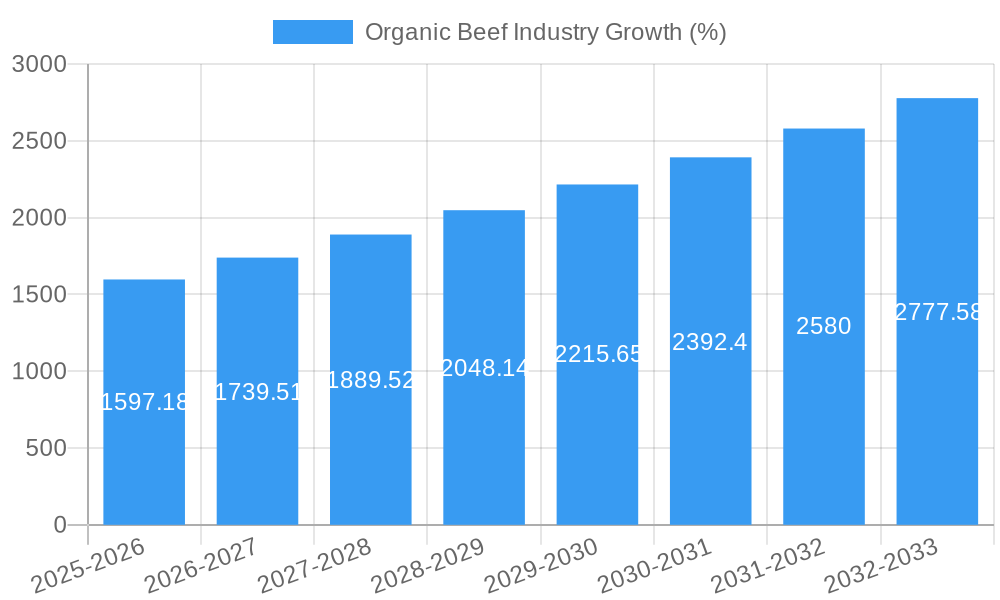
The organic beef market, valued at $20.27 billion in 2025, is experiencing robust growth, projected to expand at a compound annual growth rate (CAGR) of 7.94% from 2025 to 2033. This surge is driven by increasing consumer demand for healthier, sustainably produced food products. Growing awareness of the environmental impact of conventional beef farming and a preference for grass-fed, hormone-free options are significant contributing factors. The rising disposable incomes in developing economies also fuel this demand, particularly in regions like Asia-Pacific and South America, where the market shows considerable potential for growth. Furthermore, the expanding retail landscape, particularly the growth of online retailing and specialty stores catering to health-conscious consumers, provides increased market access for organic beef producers. The market segmentation reveals a preference for organic beef across various distribution channels, with hypermarkets and supermarkets holding a significant share, while online retailing demonstrates strong growth potential. Key players such as DuBreton, Meyer Natural Foods, and Tyson Foods are strategically positioning themselves to capitalize on this market expansion through product diversification, sustainable sourcing initiatives, and enhanced supply chain management. Competition is intense, pushing innovation in product offerings and marketing strategies.
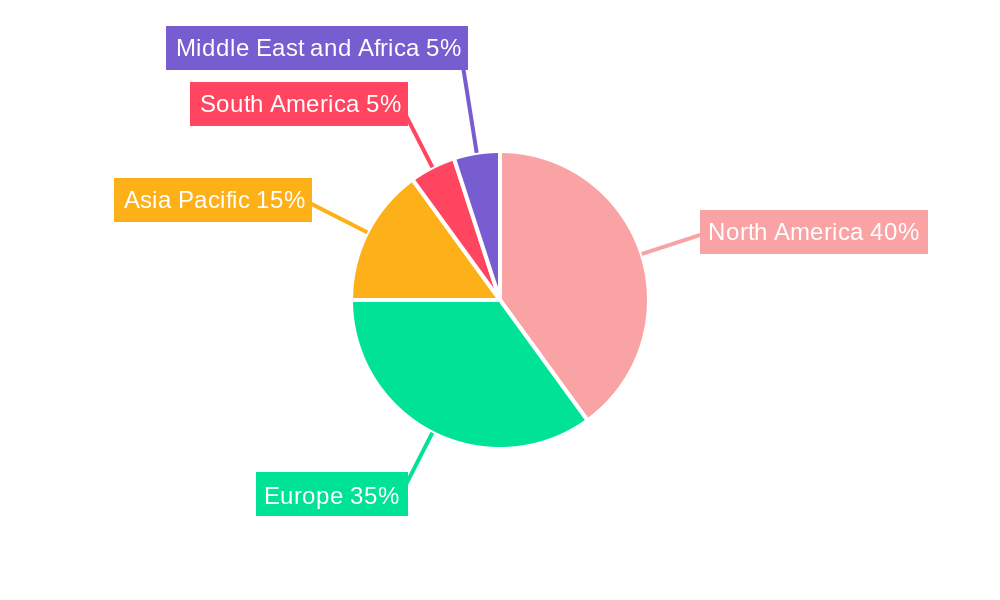
The segmentation by meat type within the organic beef market reveals that while beef holds a dominant share, the "Other Organic Meats" segment, encompassing products like lamb and bison, also contributes significantly, representing an area ripe for future expansion. Geographical analysis reveals North America and Europe as currently leading markets, driven by high consumer awareness and established organic food industries. However, Asia-Pacific displays considerable growth potential due to increasing middle-class populations and shifting dietary habits. Challenges faced by the market include the higher production costs of organic beef, resulting in higher prices for consumers, and ensuring consistent supply to meet the escalating demand. Sustainable farming practices and efficient distribution networks are crucial to mitigate these challenges and achieve continued market expansion. Further research into consumer preferences and innovative packaging solutions are vital for sustained growth within this dynamic sector.
Organic Beef Industry: A Comprehensive Market Report (2019-2033)
This comprehensive report provides a detailed analysis of the global organic beef industry, offering invaluable insights for stakeholders seeking to navigate this dynamic and rapidly evolving market. From market sizing and segmentation to competitive landscapes and future growth projections, this report delivers actionable intelligence for strategic decision-making. The study period covers 2019-2033, with 2025 as the base and estimated year. The forecast period spans 2025-2033, and the historical period encompasses 2019-2024. The global organic beef market is estimated to be worth $XX Million in 2025 and projected to reach $XX Million by 2033, exhibiting a CAGR of XX%.
Organic Beef Industry Market Dynamics & Concentration
The organic beef industry is characterized by a moderately concentrated market structure, with a few major players commanding significant market share. Companies like DuBreton, Tyson Foods Inc, and JBS SA hold substantial positions, though the exact figures fluctuate depending on regional markets and product segments. Market share dynamics are influenced by several factors, including brand recognition, distribution networks, and vertical integration strategies. Innovation, particularly in sustainable farming practices and traceability technologies, is a key driver, attracting both established players and emerging companies. Stringent regulatory frameworks governing organic certification and labeling play a crucial role in shaping market competition and consumer trust. Product substitutes, such as conventionally raised beef, pose a constant competitive challenge, impacting market penetration and growth. Consumer preferences are shifting towards healthier and more ethically sourced products, fueling demand for organic beef. Furthermore, M&A activity within the industry is moderate, with an estimated XX number of deals during the historical period (2019-2024). These mergers and acquisitions often aim to expand market reach, integrate supply chains, and enhance product offerings.
- Market Concentration: High, with top 5 players holding approximately XX% of the global market share in 2025.
- Innovation Drivers: Sustainable farming, traceability technologies, and value-added products.
- Regulatory Frameworks: Stringent organic certification standards impacting production costs and market entry.
- Product Substitutes: Conventionally raised beef, posing a constant competitive threat.
- End-User Trends: Increasing demand for healthy, ethically sourced, and sustainable food options.
- M&A Activity: Estimated XX M&A deals between 2019 and 2024.
Organic Beef Industry Industry Trends & Analysis
The organic beef market is experiencing robust growth, driven by several key factors. Rising consumer awareness of health and environmental concerns is fueling demand for organic products. This trend is further reinforced by increased disposable incomes in developing economies and a growing middle class with greater purchasing power. Technological advancements in organic farming, such as precision agriculture and improved feed management, are enhancing efficiency and productivity, contributing to market expansion. However, the industry also faces challenges. Supply chain complexities, including limited production capacity and transportation constraints, can hinder market growth. Fluctuations in feed prices and other input costs pose risks to profitability. Furthermore, competitive pressures from conventional beef producers necessitates continuous innovation and differentiation strategies. The market penetration of organic beef is currently estimated at XX% globally in 2025, with projections for substantial growth in the forecast period. The CAGR for the forecast period (2025-2033) is estimated to be XX%.
Leading Markets & Segments in Organic Beef Industry
The North American market, particularly the US, currently dominates the global organic beef industry, driven by high consumer demand, robust infrastructure, and established organic farming practices. Within the market segments:
- Type: Beef constitutes the largest segment, followed by poultry and pork, with "Other Organic Meats" holding a smaller share.
- Distribution Channel: Hypermarkets and supermarkets represent the dominant distribution channel, followed by specialty stores and online retailing. Retail and departmental stores also play a significant role.
Key Drivers for North American Dominance:
- High consumer awareness and willingness to pay a premium for organic products.
- Well-developed infrastructure for organic farming and processing.
- Established organic certification and labeling standards.
- Strong government support for sustainable agriculture.
Other regions, including Europe and parts of Asia, are experiencing substantial growth, driven by increasing consumer income, changing dietary habits, and government initiatives promoting sustainable agriculture. However, the North American region remains the clear leader due to its mature market, high demand, and well-established supply chains.
Organic Beef Industry Product Developments
Recent product innovations focus on enhancing convenience, sustainability, and value-added attributes. This includes pre-packaged organic beef cuts, ready-to-cook meals, and organic beef products tailored to specific dietary needs. Technological advancements in packaging extend product shelf life and reduce waste, further enhancing market appeal. Companies are emphasizing transparent traceability systems, allowing consumers to trace the origin and production methods of their beef.
Key Drivers of Organic Beef Industry Growth
Several factors are driving the growth of the organic beef industry:
- Technological Advancements: Improved farming techniques, precision agriculture, and advancements in processing and packaging technologies are boosting production efficiency.
- Economic Factors: Increasing disposable incomes and a growing middle class are driving higher demand for premium food products.
- Regulatory Support: Government initiatives promoting sustainable agriculture and supporting organic farming practices contribute to industry growth. Examples include subsidies, tax incentives and research funding.
Challenges in the Organic Beef Industry Market
The organic beef industry faces several challenges including:
- High Production Costs: Organic farming methods are often more expensive than conventional methods, leading to higher prices for consumers.
- Supply Chain Constraints: Limited production capacity and transportation challenges can restrict market expansion.
- Competition from Conventional Beef: Conventional beef remains a cheaper alternative, posing a continuous competitive pressure. This results in a price differential estimated to be at XX%.
Emerging Opportunities in Organic Beef Industry
The industry is poised for significant growth through strategic partnerships among farmers, processors, and retailers enhancing supply chain efficiency. Technological breakthroughs in precision agriculture and alternative protein sources are unlocking new opportunities for sustainable production and product diversification. Expansion into new geographic markets with high growth potential is also expected to drive long-term growth. Moreover, a growing focus on traceability and transparency will further drive market growth.
Leading Players in the Organic Beef Industry Sector
- DuBreton
- Meyer Natural Foods
- Leverandørselskabet Danish Crown A m b a
- Tyson Foods Inc
- Perdue Farms Inc
- Foster Farms
- Eversfield Organic
- Verde Farms
- Swellington Organic Farm
- JBS SA
Key Milestones in Organic Beef Industry Industry
- 2020: Increased consumer interest in sustainable food products amid the COVID-19 pandemic.
- 2021: Several major players invested heavily in enhancing their supply chains.
- 2022: Launch of several new organic beef products with increased focus on sustainability and traceability.
- 2023: Growing number of partnerships between organic beef producers and retailers.
- 2024: Increased focus on technological advancements to improve efficiency and reduce costs.
Strategic Outlook for Organic Beef Industry Market
The organic beef market presents significant long-term growth potential, driven by consistent consumer demand for healthy and ethically sourced food. Strategic partnerships, technological innovation, and expansion into emerging markets will be key to unlocking this potential. Companies focusing on sustainability, transparency, and value-added products are poised for success in this increasingly competitive yet promising sector. The focus will increasingly shift to addressing sustainability concerns, which will further influence the industry's growth trajectory.
Organic Beef Industry Segmentation
-
1. Type
- 1.1. Poultry
- 1.2. Beef
- 1.3. Pork
- 1.4. Other Organic Meats
-
2. Distribution Channel
- 2.1. Hypermarkets and Supermarkets
- 2.2. Speciality Stores
- 2.3. Online Retailing
- 2.4. Retail and Departmental Stores
Organic Beef Industry Segmentation By Geography
-
1. North America
- 1.1. United States
- 1.2. Canada
- 1.3. Mexico
- 1.4. Rest of North America
-
2. Europe
- 2.1. Germany
- 2.2. United Kingdom
- 2.3. France
- 2.4. Russia
- 2.5. Spain
- 2.6. Rest of Europe
-
3. Asia Pacific
- 3.1. China
- 3.2. Japan
- 3.3. India
- 3.4. South Korea
- 3.5. Rest of Asia Pacific
-
4. South America
- 4.1. Brazil
- 4.2. Argentina
- 4.3. Rest of South America
-
5. Middle East and Africa
- 5.1. UAE
- 5.2. Saudi Arabia
- 5.3. South Africa
- 5.4. Egypt
- 5.5. Rest of Middle East and Africa
Organic Beef Industry REPORT HIGHLIGHTS
| Aspects | Details |
|---|---|
| Study Period | 2019-2033 |
| Base Year | 2024 |
| Estimated Year | 2025 |
| Forecast Period | 2025-2033 |
| Historical Period | 2019-2024 |
| Growth Rate | CAGR of 7.94% from 2019-2033 |
| Segmentation |
|
Table of Contents
- 1. Introduction
- 1.1. Research Scope
- 1.2. Market Segmentation
- 1.3. Research Methodology
- 1.4. Definitions and Assumptions
- 2. Executive Summary
- 2.1. Introduction
- 3. Market Dynamics
- 3.1. Introduction
- 3.2. Market Drivers
- 3.2.1. Increased Health Awareness; Increased availability of organic beef
- 3.3. Market Restrains
- 3.3.1. Organic beef is often more expensive than conventionally produced beef
- 3.4. Market Trends
- 3.4.1. Growing trend towards offering a variety of organic beef products
- 4. Market Factor Analysis
- 4.1. Porters Five Forces
- 4.2. Supply/Value Chain
- 4.3. PESTEL analysis
- 4.4. Market Entropy
- 4.5. Patent/Trademark Analysis
- 5. Global Organic Beef Industry Analysis, Insights and Forecast, 2019-2031
- 5.1. Market Analysis, Insights and Forecast - by Type
- 5.1.1. Poultry
- 5.1.2. Beef
- 5.1.3. Pork
- 5.1.4. Other Organic Meats
- 5.2. Market Analysis, Insights and Forecast - by Distribution Channel
- 5.2.1. Hypermarkets and Supermarkets
- 5.2.2. Speciality Stores
- 5.2.3. Online Retailing
- 5.2.4. Retail and Departmental Stores
- 5.3. Market Analysis, Insights and Forecast - by Region
- 5.3.1. North America
- 5.3.2. Europe
- 5.3.3. Asia Pacific
- 5.3.4. South America
- 5.3.5. Middle East and Africa
- 5.1. Market Analysis, Insights and Forecast - by Type
- 6. North America Organic Beef Industry Analysis, Insights and Forecast, 2019-2031
- 6.1. Market Analysis, Insights and Forecast - by Type
- 6.1.1. Poultry
- 6.1.2. Beef
- 6.1.3. Pork
- 6.1.4. Other Organic Meats
- 6.2. Market Analysis, Insights and Forecast - by Distribution Channel
- 6.2.1. Hypermarkets and Supermarkets
- 6.2.2. Speciality Stores
- 6.2.3. Online Retailing
- 6.2.4. Retail and Departmental Stores
- 6.1. Market Analysis, Insights and Forecast - by Type
- 7. Europe Organic Beef Industry Analysis, Insights and Forecast, 2019-2031
- 7.1. Market Analysis, Insights and Forecast - by Type
- 7.1.1. Poultry
- 7.1.2. Beef
- 7.1.3. Pork
- 7.1.4. Other Organic Meats
- 7.2. Market Analysis, Insights and Forecast - by Distribution Channel
- 7.2.1. Hypermarkets and Supermarkets
- 7.2.2. Speciality Stores
- 7.2.3. Online Retailing
- 7.2.4. Retail and Departmental Stores
- 7.1. Market Analysis, Insights and Forecast - by Type
- 8. Asia Pacific Organic Beef Industry Analysis, Insights and Forecast, 2019-2031
- 8.1. Market Analysis, Insights and Forecast - by Type
- 8.1.1. Poultry
- 8.1.2. Beef
- 8.1.3. Pork
- 8.1.4. Other Organic Meats
- 8.2. Market Analysis, Insights and Forecast - by Distribution Channel
- 8.2.1. Hypermarkets and Supermarkets
- 8.2.2. Speciality Stores
- 8.2.3. Online Retailing
- 8.2.4. Retail and Departmental Stores
- 8.1. Market Analysis, Insights and Forecast - by Type
- 9. South America Organic Beef Industry Analysis, Insights and Forecast, 2019-2031
- 9.1. Market Analysis, Insights and Forecast - by Type
- 9.1.1. Poultry
- 9.1.2. Beef
- 9.1.3. Pork
- 9.1.4. Other Organic Meats
- 9.2. Market Analysis, Insights and Forecast - by Distribution Channel
- 9.2.1. Hypermarkets and Supermarkets
- 9.2.2. Speciality Stores
- 9.2.3. Online Retailing
- 9.2.4. Retail and Departmental Stores
- 9.1. Market Analysis, Insights and Forecast - by Type
- 10. Middle East and Africa Organic Beef Industry Analysis, Insights and Forecast, 2019-2031
- 10.1. Market Analysis, Insights and Forecast - by Type
- 10.1.1. Poultry
- 10.1.2. Beef
- 10.1.3. Pork
- 10.1.4. Other Organic Meats
- 10.2. Market Analysis, Insights and Forecast - by Distribution Channel
- 10.2.1. Hypermarkets and Supermarkets
- 10.2.2. Speciality Stores
- 10.2.3. Online Retailing
- 10.2.4. Retail and Departmental Stores
- 10.1. Market Analysis, Insights and Forecast - by Type
- 11. North America Organic Beef Industry Analysis, Insights and Forecast, 2019-2031
- 11.1. Market Analysis, Insights and Forecast - By Country/Sub-region
- 11.1.1 United States
- 11.1.2 Canada
- 11.1.3 Mexico
- 11.1.4 Rest of North America
- 12. Europe Organic Beef Industry Analysis, Insights and Forecast, 2019-2031
- 12.1. Market Analysis, Insights and Forecast - By Country/Sub-region
- 12.1.1 Germany
- 12.1.2 United Kingdom
- 12.1.3 France
- 12.1.4 Russia
- 12.1.5 Spain
- 12.1.6 Rest of Europe
- 13. Asia Pacific Organic Beef Industry Analysis, Insights and Forecast, 2019-2031
- 13.1. Market Analysis, Insights and Forecast - By Country/Sub-region
- 13.1.1 China
- 13.1.2 Japan
- 13.1.3 India
- 13.1.4 South Korea
- 13.1.5 Rest of Asia Pacific
- 14. South America Organic Beef Industry Analysis, Insights and Forecast, 2019-2031
- 14.1. Market Analysis, Insights and Forecast - By Country/Sub-region
- 14.1.1 Brazil
- 14.1.2 Argentina
- 14.1.3 Rest of South America
- 15. Middle East and Africa Organic Beef Industry Analysis, Insights and Forecast, 2019-2031
- 15.1. Market Analysis, Insights and Forecast - By Country/Sub-region
- 15.1.1 UAE
- 15.1.2 Saudi Arabia
- 15.1.3 South Africa
- 15.1.4 Egypt
- 15.1.5 Rest of Middle East and Africa
- 16. Competitive Analysis
- 16.1. Global Market Share Analysis 2024
- 16.2. Company Profiles
- 16.2.1 DuBreton
- 16.2.1.1. Overview
- 16.2.1.2. Products
- 16.2.1.3. SWOT Analysis
- 16.2.1.4. Recent Developments
- 16.2.1.5. Financials (Based on Availability)
- 16.2.2 Meyer Natural Foods
- 16.2.2.1. Overview
- 16.2.2.2. Products
- 16.2.2.3. SWOT Analysis
- 16.2.2.4. Recent Developments
- 16.2.2.5. Financials (Based on Availability)
- 16.2.3 Leverandørselskabet Danish Crown A m b a
- 16.2.3.1. Overview
- 16.2.3.2. Products
- 16.2.3.3. SWOT Analysis
- 16.2.3.4. Recent Developments
- 16.2.3.5. Financials (Based on Availability)
- 16.2.4 Tyson Foods Inc
- 16.2.4.1. Overview
- 16.2.4.2. Products
- 16.2.4.3. SWOT Analysis
- 16.2.4.4. Recent Developments
- 16.2.4.5. Financials (Based on Availability)
- 16.2.5 Perdue Farms Inc
- 16.2.5.1. Overview
- 16.2.5.2. Products
- 16.2.5.3. SWOT Analysis
- 16.2.5.4. Recent Developments
- 16.2.5.5. Financials (Based on Availability)
- 16.2.6 Foster Farms
- 16.2.6.1. Overview
- 16.2.6.2. Products
- 16.2.6.3. SWOT Analysis
- 16.2.6.4. Recent Developments
- 16.2.6.5. Financials (Based on Availability)
- 16.2.7 Eversfield Organic
- 16.2.7.1. Overview
- 16.2.7.2. Products
- 16.2.7.3. SWOT Analysis
- 16.2.7.4. Recent Developments
- 16.2.7.5. Financials (Based on Availability)
- 16.2.8 Verde Farms
- 16.2.8.1. Overview
- 16.2.8.2. Products
- 16.2.8.3. SWOT Analysis
- 16.2.8.4. Recent Developments
- 16.2.8.5. Financials (Based on Availability)
- 16.2.9 Swellington Organic Farm
- 16.2.9.1. Overview
- 16.2.9.2. Products
- 16.2.9.3. SWOT Analysis
- 16.2.9.4. Recent Developments
- 16.2.9.5. Financials (Based on Availability)
- 16.2.10 JBS SA
- 16.2.10.1. Overview
- 16.2.10.2. Products
- 16.2.10.3. SWOT Analysis
- 16.2.10.4. Recent Developments
- 16.2.10.5. Financials (Based on Availability)
- 16.2.1 DuBreton
List of Figures
- Figure 1: Global Organic Beef Industry Revenue Breakdown (Million, %) by Region 2024 & 2032
- Figure 2: Global Organic Beef Industry Volume Breakdown (K Tons, %) by Region 2024 & 2032
- Figure 3: North America Organic Beef Industry Revenue (Million), by Country 2024 & 2032
- Figure 4: North America Organic Beef Industry Volume (K Tons), by Country 2024 & 2032
- Figure 5: North America Organic Beef Industry Revenue Share (%), by Country 2024 & 2032
- Figure 6: North America Organic Beef Industry Volume Share (%), by Country 2024 & 2032
- Figure 7: Europe Organic Beef Industry Revenue (Million), by Country 2024 & 2032
- Figure 8: Europe Organic Beef Industry Volume (K Tons), by Country 2024 & 2032
- Figure 9: Europe Organic Beef Industry Revenue Share (%), by Country 2024 & 2032
- Figure 10: Europe Organic Beef Industry Volume Share (%), by Country 2024 & 2032
- Figure 11: Asia Pacific Organic Beef Industry Revenue (Million), by Country 2024 & 2032
- Figure 12: Asia Pacific Organic Beef Industry Volume (K Tons), by Country 2024 & 2032
- Figure 13: Asia Pacific Organic Beef Industry Revenue Share (%), by Country 2024 & 2032
- Figure 14: Asia Pacific Organic Beef Industry Volume Share (%), by Country 2024 & 2032
- Figure 15: South America Organic Beef Industry Revenue (Million), by Country 2024 & 2032
- Figure 16: South America Organic Beef Industry Volume (K Tons), by Country 2024 & 2032
- Figure 17: South America Organic Beef Industry Revenue Share (%), by Country 2024 & 2032
- Figure 18: South America Organic Beef Industry Volume Share (%), by Country 2024 & 2032
- Figure 19: Middle East and Africa Organic Beef Industry Revenue (Million), by Country 2024 & 2032
- Figure 20: Middle East and Africa Organic Beef Industry Volume (K Tons), by Country 2024 & 2032
- Figure 21: Middle East and Africa Organic Beef Industry Revenue Share (%), by Country 2024 & 2032
- Figure 22: Middle East and Africa Organic Beef Industry Volume Share (%), by Country 2024 & 2032
- Figure 23: North America Organic Beef Industry Revenue (Million), by Type 2024 & 2032
- Figure 24: North America Organic Beef Industry Volume (K Tons), by Type 2024 & 2032
- Figure 25: North America Organic Beef Industry Revenue Share (%), by Type 2024 & 2032
- Figure 26: North America Organic Beef Industry Volume Share (%), by Type 2024 & 2032
- Figure 27: North America Organic Beef Industry Revenue (Million), by Distribution Channel 2024 & 2032
- Figure 28: North America Organic Beef Industry Volume (K Tons), by Distribution Channel 2024 & 2032
- Figure 29: North America Organic Beef Industry Revenue Share (%), by Distribution Channel 2024 & 2032
- Figure 30: North America Organic Beef Industry Volume Share (%), by Distribution Channel 2024 & 2032
- Figure 31: North America Organic Beef Industry Revenue (Million), by Country 2024 & 2032
- Figure 32: North America Organic Beef Industry Volume (K Tons), by Country 2024 & 2032
- Figure 33: North America Organic Beef Industry Revenue Share (%), by Country 2024 & 2032
- Figure 34: North America Organic Beef Industry Volume Share (%), by Country 2024 & 2032
- Figure 35: Europe Organic Beef Industry Revenue (Million), by Type 2024 & 2032
- Figure 36: Europe Organic Beef Industry Volume (K Tons), by Type 2024 & 2032
- Figure 37: Europe Organic Beef Industry Revenue Share (%), by Type 2024 & 2032
- Figure 38: Europe Organic Beef Industry Volume Share (%), by Type 2024 & 2032
- Figure 39: Europe Organic Beef Industry Revenue (Million), by Distribution Channel 2024 & 2032
- Figure 40: Europe Organic Beef Industry Volume (K Tons), by Distribution Channel 2024 & 2032
- Figure 41: Europe Organic Beef Industry Revenue Share (%), by Distribution Channel 2024 & 2032
- Figure 42: Europe Organic Beef Industry Volume Share (%), by Distribution Channel 2024 & 2032
- Figure 43: Europe Organic Beef Industry Revenue (Million), by Country 2024 & 2032
- Figure 44: Europe Organic Beef Industry Volume (K Tons), by Country 2024 & 2032
- Figure 45: Europe Organic Beef Industry Revenue Share (%), by Country 2024 & 2032
- Figure 46: Europe Organic Beef Industry Volume Share (%), by Country 2024 & 2032
- Figure 47: Asia Pacific Organic Beef Industry Revenue (Million), by Type 2024 & 2032
- Figure 48: Asia Pacific Organic Beef Industry Volume (K Tons), by Type 2024 & 2032
- Figure 49: Asia Pacific Organic Beef Industry Revenue Share (%), by Type 2024 & 2032
- Figure 50: Asia Pacific Organic Beef Industry Volume Share (%), by Type 2024 & 2032
- Figure 51: Asia Pacific Organic Beef Industry Revenue (Million), by Distribution Channel 2024 & 2032
- Figure 52: Asia Pacific Organic Beef Industry Volume (K Tons), by Distribution Channel 2024 & 2032
- Figure 53: Asia Pacific Organic Beef Industry Revenue Share (%), by Distribution Channel 2024 & 2032
- Figure 54: Asia Pacific Organic Beef Industry Volume Share (%), by Distribution Channel 2024 & 2032
- Figure 55: Asia Pacific Organic Beef Industry Revenue (Million), by Country 2024 & 2032
- Figure 56: Asia Pacific Organic Beef Industry Volume (K Tons), by Country 2024 & 2032
- Figure 57: Asia Pacific Organic Beef Industry Revenue Share (%), by Country 2024 & 2032
- Figure 58: Asia Pacific Organic Beef Industry Volume Share (%), by Country 2024 & 2032
- Figure 59: South America Organic Beef Industry Revenue (Million), by Type 2024 & 2032
- Figure 60: South America Organic Beef Industry Volume (K Tons), by Type 2024 & 2032
- Figure 61: South America Organic Beef Industry Revenue Share (%), by Type 2024 & 2032
- Figure 62: South America Organic Beef Industry Volume Share (%), by Type 2024 & 2032
- Figure 63: South America Organic Beef Industry Revenue (Million), by Distribution Channel 2024 & 2032
- Figure 64: South America Organic Beef Industry Volume (K Tons), by Distribution Channel 2024 & 2032
- Figure 65: South America Organic Beef Industry Revenue Share (%), by Distribution Channel 2024 & 2032
- Figure 66: South America Organic Beef Industry Volume Share (%), by Distribution Channel 2024 & 2032
- Figure 67: South America Organic Beef Industry Revenue (Million), by Country 2024 & 2032
- Figure 68: South America Organic Beef Industry Volume (K Tons), by Country 2024 & 2032
- Figure 69: South America Organic Beef Industry Revenue Share (%), by Country 2024 & 2032
- Figure 70: South America Organic Beef Industry Volume Share (%), by Country 2024 & 2032
- Figure 71: Middle East and Africa Organic Beef Industry Revenue (Million), by Type 2024 & 2032
- Figure 72: Middle East and Africa Organic Beef Industry Volume (K Tons), by Type 2024 & 2032
- Figure 73: Middle East and Africa Organic Beef Industry Revenue Share (%), by Type 2024 & 2032
- Figure 74: Middle East and Africa Organic Beef Industry Volume Share (%), by Type 2024 & 2032
- Figure 75: Middle East and Africa Organic Beef Industry Revenue (Million), by Distribution Channel 2024 & 2032
- Figure 76: Middle East and Africa Organic Beef Industry Volume (K Tons), by Distribution Channel 2024 & 2032
- Figure 77: Middle East and Africa Organic Beef Industry Revenue Share (%), by Distribution Channel 2024 & 2032
- Figure 78: Middle East and Africa Organic Beef Industry Volume Share (%), by Distribution Channel 2024 & 2032
- Figure 79: Middle East and Africa Organic Beef Industry Revenue (Million), by Country 2024 & 2032
- Figure 80: Middle East and Africa Organic Beef Industry Volume (K Tons), by Country 2024 & 2032
- Figure 81: Middle East and Africa Organic Beef Industry Revenue Share (%), by Country 2024 & 2032
- Figure 82: Middle East and Africa Organic Beef Industry Volume Share (%), by Country 2024 & 2032
List of Tables
- Table 1: Global Organic Beef Industry Revenue Million Forecast, by Region 2019 & 2032
- Table 2: Global Organic Beef Industry Volume K Tons Forecast, by Region 2019 & 2032
- Table 3: Global Organic Beef Industry Revenue Million Forecast, by Type 2019 & 2032
- Table 4: Global Organic Beef Industry Volume K Tons Forecast, by Type 2019 & 2032
- Table 5: Global Organic Beef Industry Revenue Million Forecast, by Distribution Channel 2019 & 2032
- Table 6: Global Organic Beef Industry Volume K Tons Forecast, by Distribution Channel 2019 & 2032
- Table 7: Global Organic Beef Industry Revenue Million Forecast, by Region 2019 & 2032
- Table 8: Global Organic Beef Industry Volume K Tons Forecast, by Region 2019 & 2032
- Table 9: Global Organic Beef Industry Revenue Million Forecast, by Country 2019 & 2032
- Table 10: Global Organic Beef Industry Volume K Tons Forecast, by Country 2019 & 2032
- Table 11: United States Organic Beef Industry Revenue (Million) Forecast, by Application 2019 & 2032
- Table 12: United States Organic Beef Industry Volume (K Tons) Forecast, by Application 2019 & 2032
- Table 13: Canada Organic Beef Industry Revenue (Million) Forecast, by Application 2019 & 2032
- Table 14: Canada Organic Beef Industry Volume (K Tons) Forecast, by Application 2019 & 2032
- Table 15: Mexico Organic Beef Industry Revenue (Million) Forecast, by Application 2019 & 2032
- Table 16: Mexico Organic Beef Industry Volume (K Tons) Forecast, by Application 2019 & 2032
- Table 17: Rest of North America Organic Beef Industry Revenue (Million) Forecast, by Application 2019 & 2032
- Table 18: Rest of North America Organic Beef Industry Volume (K Tons) Forecast, by Application 2019 & 2032
- Table 19: Global Organic Beef Industry Revenue Million Forecast, by Country 2019 & 2032
- Table 20: Global Organic Beef Industry Volume K Tons Forecast, by Country 2019 & 2032
- Table 21: Germany Organic Beef Industry Revenue (Million) Forecast, by Application 2019 & 2032
- Table 22: Germany Organic Beef Industry Volume (K Tons) Forecast, by Application 2019 & 2032
- Table 23: United Kingdom Organic Beef Industry Revenue (Million) Forecast, by Application 2019 & 2032
- Table 24: United Kingdom Organic Beef Industry Volume (K Tons) Forecast, by Application 2019 & 2032
- Table 25: France Organic Beef Industry Revenue (Million) Forecast, by Application 2019 & 2032
- Table 26: France Organic Beef Industry Volume (K Tons) Forecast, by Application 2019 & 2032
- Table 27: Russia Organic Beef Industry Revenue (Million) Forecast, by Application 2019 & 2032
- Table 28: Russia Organic Beef Industry Volume (K Tons) Forecast, by Application 2019 & 2032
- Table 29: Spain Organic Beef Industry Revenue (Million) Forecast, by Application 2019 & 2032
- Table 30: Spain Organic Beef Industry Volume (K Tons) Forecast, by Application 2019 & 2032
- Table 31: Rest of Europe Organic Beef Industry Revenue (Million) Forecast, by Application 2019 & 2032
- Table 32: Rest of Europe Organic Beef Industry Volume (K Tons) Forecast, by Application 2019 & 2032
- Table 33: Global Organic Beef Industry Revenue Million Forecast, by Country 2019 & 2032
- Table 34: Global Organic Beef Industry Volume K Tons Forecast, by Country 2019 & 2032
- Table 35: China Organic Beef Industry Revenue (Million) Forecast, by Application 2019 & 2032
- Table 36: China Organic Beef Industry Volume (K Tons) Forecast, by Application 2019 & 2032
- Table 37: Japan Organic Beef Industry Revenue (Million) Forecast, by Application 2019 & 2032
- Table 38: Japan Organic Beef Industry Volume (K Tons) Forecast, by Application 2019 & 2032
- Table 39: India Organic Beef Industry Revenue (Million) Forecast, by Application 2019 & 2032
- Table 40: India Organic Beef Industry Volume (K Tons) Forecast, by Application 2019 & 2032
- Table 41: South Korea Organic Beef Industry Revenue (Million) Forecast, by Application 2019 & 2032
- Table 42: South Korea Organic Beef Industry Volume (K Tons) Forecast, by Application 2019 & 2032
- Table 43: Rest of Asia Pacific Organic Beef Industry Revenue (Million) Forecast, by Application 2019 & 2032
- Table 44: Rest of Asia Pacific Organic Beef Industry Volume (K Tons) Forecast, by Application 2019 & 2032
- Table 45: Global Organic Beef Industry Revenue Million Forecast, by Country 2019 & 2032
- Table 46: Global Organic Beef Industry Volume K Tons Forecast, by Country 2019 & 2032
- Table 47: Brazil Organic Beef Industry Revenue (Million) Forecast, by Application 2019 & 2032
- Table 48: Brazil Organic Beef Industry Volume (K Tons) Forecast, by Application 2019 & 2032
- Table 49: Argentina Organic Beef Industry Revenue (Million) Forecast, by Application 2019 & 2032
- Table 50: Argentina Organic Beef Industry Volume (K Tons) Forecast, by Application 2019 & 2032
- Table 51: Rest of South America Organic Beef Industry Revenue (Million) Forecast, by Application 2019 & 2032
- Table 52: Rest of South America Organic Beef Industry Volume (K Tons) Forecast, by Application 2019 & 2032
- Table 53: Global Organic Beef Industry Revenue Million Forecast, by Country 2019 & 2032
- Table 54: Global Organic Beef Industry Volume K Tons Forecast, by Country 2019 & 2032
- Table 55: UAE Organic Beef Industry Revenue (Million) Forecast, by Application 2019 & 2032
- Table 56: UAE Organic Beef Industry Volume (K Tons) Forecast, by Application 2019 & 2032
- Table 57: Saudi Arabia Organic Beef Industry Revenue (Million) Forecast, by Application 2019 & 2032
- Table 58: Saudi Arabia Organic Beef Industry Volume (K Tons) Forecast, by Application 2019 & 2032
- Table 59: South Africa Organic Beef Industry Revenue (Million) Forecast, by Application 2019 & 2032
- Table 60: South Africa Organic Beef Industry Volume (K Tons) Forecast, by Application 2019 & 2032
- Table 61: Egypt Organic Beef Industry Revenue (Million) Forecast, by Application 2019 & 2032
- Table 62: Egypt Organic Beef Industry Volume (K Tons) Forecast, by Application 2019 & 2032
- Table 63: Rest of Middle East and Africa Organic Beef Industry Revenue (Million) Forecast, by Application 2019 & 2032
- Table 64: Rest of Middle East and Africa Organic Beef Industry Volume (K Tons) Forecast, by Application 2019 & 2032
- Table 65: Global Organic Beef Industry Revenue Million Forecast, by Type 2019 & 2032
- Table 66: Global Organic Beef Industry Volume K Tons Forecast, by Type 2019 & 2032
- Table 67: Global Organic Beef Industry Revenue Million Forecast, by Distribution Channel 2019 & 2032
- Table 68: Global Organic Beef Industry Volume K Tons Forecast, by Distribution Channel 2019 & 2032
- Table 69: Global Organic Beef Industry Revenue Million Forecast, by Country 2019 & 2032
- Table 70: Global Organic Beef Industry Volume K Tons Forecast, by Country 2019 & 2032
- Table 71: United States Organic Beef Industry Revenue (Million) Forecast, by Application 2019 & 2032
- Table 72: United States Organic Beef Industry Volume (K Tons) Forecast, by Application 2019 & 2032
- Table 73: Canada Organic Beef Industry Revenue (Million) Forecast, by Application 2019 & 2032
- Table 74: Canada Organic Beef Industry Volume (K Tons) Forecast, by Application 2019 & 2032
- Table 75: Mexico Organic Beef Industry Revenue (Million) Forecast, by Application 2019 & 2032
- Table 76: Mexico Organic Beef Industry Volume (K Tons) Forecast, by Application 2019 & 2032
- Table 77: Rest of North America Organic Beef Industry Revenue (Million) Forecast, by Application 2019 & 2032
- Table 78: Rest of North America Organic Beef Industry Volume (K Tons) Forecast, by Application 2019 & 2032
- Table 79: Global Organic Beef Industry Revenue Million Forecast, by Type 2019 & 2032
- Table 80: Global Organic Beef Industry Volume K Tons Forecast, by Type 2019 & 2032
- Table 81: Global Organic Beef Industry Revenue Million Forecast, by Distribution Channel 2019 & 2032
- Table 82: Global Organic Beef Industry Volume K Tons Forecast, by Distribution Channel 2019 & 2032
- Table 83: Global Organic Beef Industry Revenue Million Forecast, by Country 2019 & 2032
- Table 84: Global Organic Beef Industry Volume K Tons Forecast, by Country 2019 & 2032
- Table 85: Germany Organic Beef Industry Revenue (Million) Forecast, by Application 2019 & 2032
- Table 86: Germany Organic Beef Industry Volume (K Tons) Forecast, by Application 2019 & 2032
- Table 87: United Kingdom Organic Beef Industry Revenue (Million) Forecast, by Application 2019 & 2032
- Table 88: United Kingdom Organic Beef Industry Volume (K Tons) Forecast, by Application 2019 & 2032
- Table 89: France Organic Beef Industry Revenue (Million) Forecast, by Application 2019 & 2032
- Table 90: France Organic Beef Industry Volume (K Tons) Forecast, by Application 2019 & 2032
- Table 91: Russia Organic Beef Industry Revenue (Million) Forecast, by Application 2019 & 2032
- Table 92: Russia Organic Beef Industry Volume (K Tons) Forecast, by Application 2019 & 2032
- Table 93: Spain Organic Beef Industry Revenue (Million) Forecast, by Application 2019 & 2032
- Table 94: Spain Organic Beef Industry Volume (K Tons) Forecast, by Application 2019 & 2032
- Table 95: Rest of Europe Organic Beef Industry Revenue (Million) Forecast, by Application 2019 & 2032
- Table 96: Rest of Europe Organic Beef Industry Volume (K Tons) Forecast, by Application 2019 & 2032
- Table 97: Global Organic Beef Industry Revenue Million Forecast, by Type 2019 & 2032
- Table 98: Global Organic Beef Industry Volume K Tons Forecast, by Type 2019 & 2032
- Table 99: Global Organic Beef Industry Revenue Million Forecast, by Distribution Channel 2019 & 2032
- Table 100: Global Organic Beef Industry Volume K Tons Forecast, by Distribution Channel 2019 & 2032
- Table 101: Global Organic Beef Industry Revenue Million Forecast, by Country 2019 & 2032
- Table 102: Global Organic Beef Industry Volume K Tons Forecast, by Country 2019 & 2032
- Table 103: China Organic Beef Industry Revenue (Million) Forecast, by Application 2019 & 2032
- Table 104: China Organic Beef Industry Volume (K Tons) Forecast, by Application 2019 & 2032
- Table 105: Japan Organic Beef Industry Revenue (Million) Forecast, by Application 2019 & 2032
- Table 106: Japan Organic Beef Industry Volume (K Tons) Forecast, by Application 2019 & 2032
- Table 107: India Organic Beef Industry Revenue (Million) Forecast, by Application 2019 & 2032
- Table 108: India Organic Beef Industry Volume (K Tons) Forecast, by Application 2019 & 2032
- Table 109: South Korea Organic Beef Industry Revenue (Million) Forecast, by Application 2019 & 2032
- Table 110: South Korea Organic Beef Industry Volume (K Tons) Forecast, by Application 2019 & 2032
- Table 111: Rest of Asia Pacific Organic Beef Industry Revenue (Million) Forecast, by Application 2019 & 2032
- Table 112: Rest of Asia Pacific Organic Beef Industry Volume (K Tons) Forecast, by Application 2019 & 2032
- Table 113: Global Organic Beef Industry Revenue Million Forecast, by Type 2019 & 2032
- Table 114: Global Organic Beef Industry Volume K Tons Forecast, by Type 2019 & 2032
- Table 115: Global Organic Beef Industry Revenue Million Forecast, by Distribution Channel 2019 & 2032
- Table 116: Global Organic Beef Industry Volume K Tons Forecast, by Distribution Channel 2019 & 2032
- Table 117: Global Organic Beef Industry Revenue Million Forecast, by Country 2019 & 2032
- Table 118: Global Organic Beef Industry Volume K Tons Forecast, by Country 2019 & 2032
- Table 119: Brazil Organic Beef Industry Revenue (Million) Forecast, by Application 2019 & 2032
- Table 120: Brazil Organic Beef Industry Volume (K Tons) Forecast, by Application 2019 & 2032
- Table 121: Argentina Organic Beef Industry Revenue (Million) Forecast, by Application 2019 & 2032
- Table 122: Argentina Organic Beef Industry Volume (K Tons) Forecast, by Application 2019 & 2032
- Table 123: Rest of South America Organic Beef Industry Revenue (Million) Forecast, by Application 2019 & 2032
- Table 124: Rest of South America Organic Beef Industry Volume (K Tons) Forecast, by Application 2019 & 2032
- Table 125: Global Organic Beef Industry Revenue Million Forecast, by Type 2019 & 2032
- Table 126: Global Organic Beef Industry Volume K Tons Forecast, by Type 2019 & 2032
- Table 127: Global Organic Beef Industry Revenue Million Forecast, by Distribution Channel 2019 & 2032
- Table 128: Global Organic Beef Industry Volume K Tons Forecast, by Distribution Channel 2019 & 2032
- Table 129: Global Organic Beef Industry Revenue Million Forecast, by Country 2019 & 2032
- Table 130: Global Organic Beef Industry Volume K Tons Forecast, by Country 2019 & 2032
- Table 131: UAE Organic Beef Industry Revenue (Million) Forecast, by Application 2019 & 2032
- Table 132: UAE Organic Beef Industry Volume (K Tons) Forecast, by Application 2019 & 2032
- Table 133: Saudi Arabia Organic Beef Industry Revenue (Million) Forecast, by Application 2019 & 2032
- Table 134: Saudi Arabia Organic Beef Industry Volume (K Tons) Forecast, by Application 2019 & 2032
- Table 135: South Africa Organic Beef Industry Revenue (Million) Forecast, by Application 2019 & 2032
- Table 136: South Africa Organic Beef Industry Volume (K Tons) Forecast, by Application 2019 & 2032
- Table 137: Egypt Organic Beef Industry Revenue (Million) Forecast, by Application 2019 & 2032
- Table 138: Egypt Organic Beef Industry Volume (K Tons) Forecast, by Application 2019 & 2032
- Table 139: Rest of Middle East and Africa Organic Beef Industry Revenue (Million) Forecast, by Application 2019 & 2032
- Table 140: Rest of Middle East and Africa Organic Beef Industry Volume (K Tons) Forecast, by Application 2019 & 2032
Frequently Asked Questions
1. What is the projected Compound Annual Growth Rate (CAGR) of the Organic Beef Industry?
The projected CAGR is approximately 7.94%.
2. Which companies are prominent players in the Organic Beef Industry?
Key companies in the market include DuBreton, Meyer Natural Foods, Leverandørselskabet Danish Crown A m b a, Tyson Foods Inc, Perdue Farms Inc, Foster Farms, Eversfield Organic, Verde Farms, Swellington Organic Farm, JBS SA.
3. What are the main segments of the Organic Beef Industry?
The market segments include Type, Distribution Channel.
4. Can you provide details about the market size?
The market size is estimated to be USD 20.27 Million as of 2022.
5. What are some drivers contributing to market growth?
Increased Health Awareness; Increased availability of organic beef.
6. What are the notable trends driving market growth?
Growing trend towards offering a variety of organic beef products.
7. Are there any restraints impacting market growth?
Organic beef is often more expensive than conventionally produced beef.
8. Can you provide examples of recent developments in the market?
N/A
9. What pricing options are available for accessing the report?
Pricing options include single-user, multi-user, and enterprise licenses priced at USD 4750, USD 5250, and USD 8750 respectively.
10. Is the market size provided in terms of value or volume?
The market size is provided in terms of value, measured in Million and volume, measured in K Tons.
11. Are there any specific market keywords associated with the report?
Yes, the market keyword associated with the report is "Organic Beef Industry," which aids in identifying and referencing the specific market segment covered.
12. How do I determine which pricing option suits my needs best?
The pricing options vary based on user requirements and access needs. Individual users may opt for single-user licenses, while businesses requiring broader access may choose multi-user or enterprise licenses for cost-effective access to the report.
13. Are there any additional resources or data provided in the Organic Beef Industry report?
While the report offers comprehensive insights, it's advisable to review the specific contents or supplementary materials provided to ascertain if additional resources or data are available.
14. How can I stay updated on further developments or reports in the Organic Beef Industry?
To stay informed about further developments, trends, and reports in the Organic Beef Industry, consider subscribing to industry newsletters, following relevant companies and organizations, or regularly checking reputable industry news sources and publications.
Methodology
Step 1 - Identification of Relevant Samples Size from Population Database


Step 2 - Approaches for Defining Global Market Size (Value, Volume* & Price*)

Note*: In applicable scenarios
Step 3 - Data Sources
Primary Research
- Web Analytics
- Survey Reports
- Research Institute
- Latest Research Reports
- Opinion Leaders
Secondary Research
- Annual Reports
- White Paper
- Latest Press Release
- Industry Association
- Paid Database
- Investor Presentations

Step 4 - Data Triangulation
Involves using different sources of information in order to increase the validity of a study
These sources are likely to be stakeholders in a program - participants, other researchers, program staff, other community members, and so on.
Then we put all data in single framework & apply various statistical tools to find out the dynamic on the market.
During the analysis stage, feedback from the stakeholder groups would be compared to determine areas of agreement as well as areas of divergence
