

Key Insights
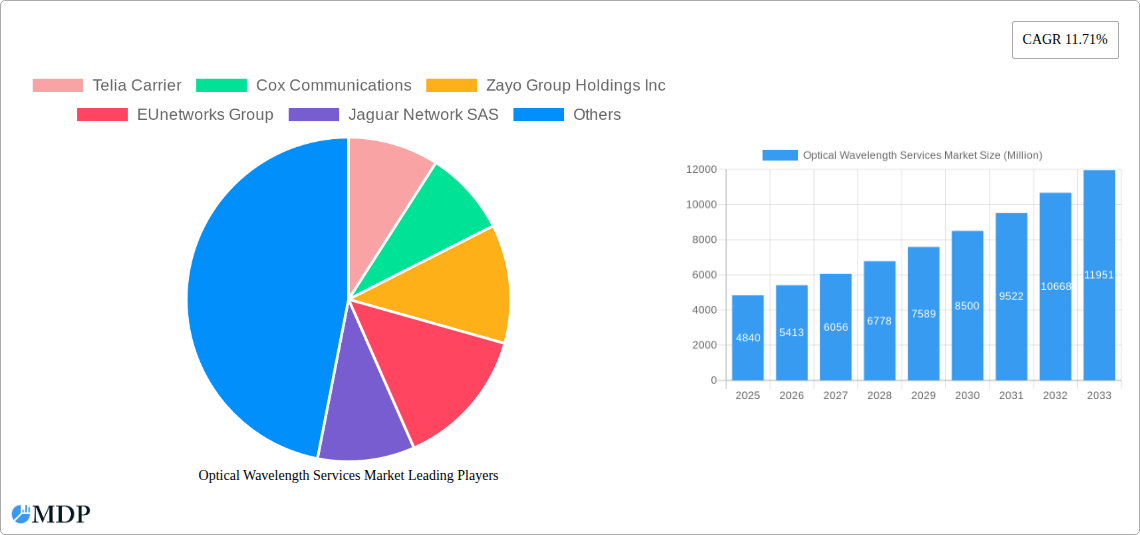
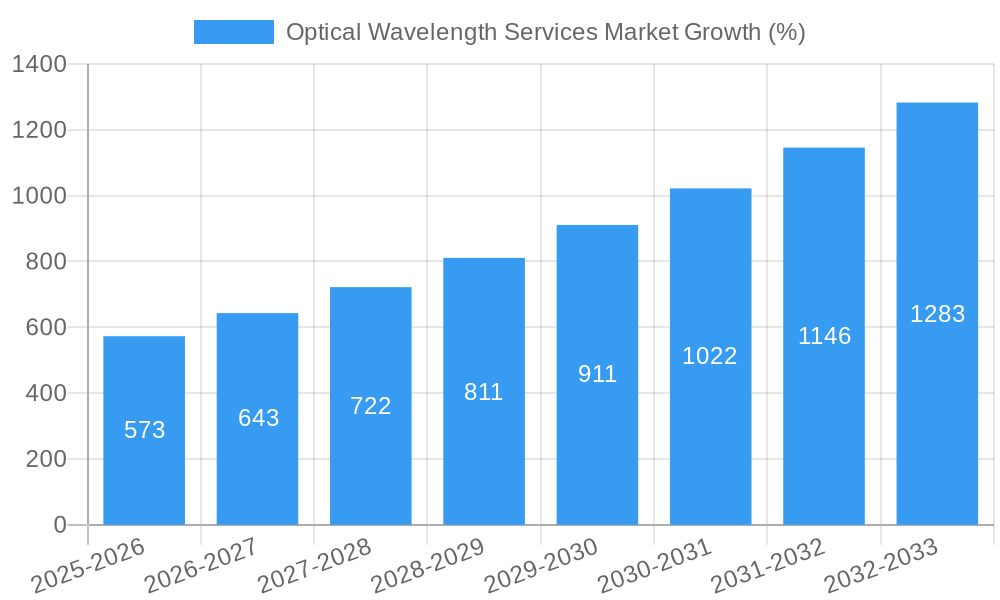
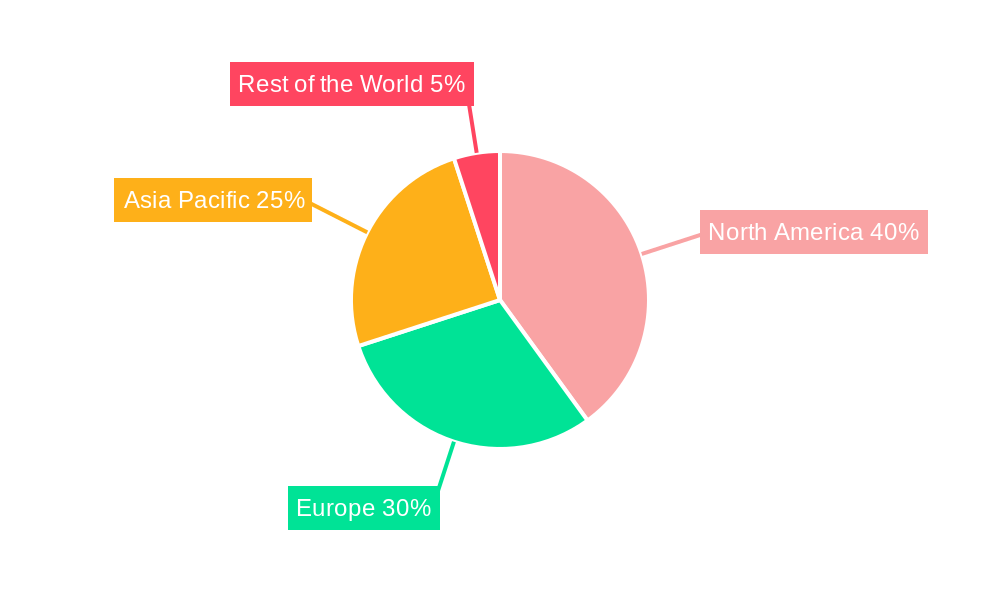
The Optical Wavelength Services market is experiencing robust growth, projected to reach $4.84 billion in 2025 and maintain a Compound Annual Growth Rate (CAGR) of 11.71% from 2025 to 2033. This expansion is fueled by the increasing demand for high-bandwidth connectivity across various sectors, including telecommunications, cloud computing, and data centers. The proliferation of 5G networks and the burgeoning adoption of cloud-based services are key drivers, necessitating robust and scalable optical wavelength solutions to manage the exponential growth in data traffic. Furthermore, the continuous advancements in optical networking technologies, such as coherent optical transmission and software-defined networking (SDN), are enabling higher capacity and more efficient network operations, further stimulating market growth. While the market faces certain restraints, such as the high initial investment costs associated with deploying optical wavelength infrastructure and the potential for fiber optic cable damage during installation, these challenges are being mitigated by ongoing technological advancements and innovative deployment strategies. The market is segmented by bandwidth capacity (less than 10 Gbps, 40 Gbps, 100 Gbps, and more than 100 Gbps), with higher bandwidth segments demonstrating faster growth rates due to increasing data demands. Major players like Telia Carrier, Verizon Communications, and Lumen Technologies are actively shaping the market landscape through strategic partnerships, acquisitions, and continuous innovation. Geographical distribution shows a strong presence across North America, Europe, and Asia Pacific, with North America currently holding a significant market share driven by the concentrated presence of major technology hubs and data centers.
The forecast period (2025-2033) anticipates continued market expansion, driven by the persistent need for high-speed, low-latency connectivity. The Asia-Pacific region is projected to witness significant growth during this period, fueled by expanding digital economies and increasing infrastructure investments in emerging markets. Competition among major players is expected to intensify, leading to innovative service offerings, price optimization, and strategic collaborations to gain market share. The increasing adoption of virtualization and automation in network management will further shape the market, driving efficiency and cost reductions. The continued development and deployment of next-generation optical technologies will remain crucial in meeting the escalating demands for bandwidth and network performance, thereby ensuring the sustained growth trajectory of the Optical Wavelength Services market in the coming years.
Optical Wavelength Services Market Report: 2019-2033 Forecast
This comprehensive report provides a detailed analysis of the Optical Wavelength Services Market, offering actionable insights for industry stakeholders. Covering the period 2019-2033, with a base year of 2025, this study examines market dynamics, trends, leading players, and future growth opportunities. The report projects a market value of xx Million by 2033, presenting a robust CAGR of xx% during the forecast period (2025-2033).
Optical Wavelength Services Market Market Dynamics & Concentration
The Optical Wavelength Services Market is characterized by a moderately concentrated landscape, with several key players holding significant market share. The market's concentration ratio (CRx) for the top 5 players is estimated at xx% in 2025. Innovation in higher bandwidth capabilities (e.g., 400Gbps) and the increasing demand for high-speed, low-latency connections are key drivers. Regulatory frameworks, particularly concerning network infrastructure and data privacy, significantly influence market growth. Fiber optic cables, though currently dominant, face competition from other technologies, though these remain niche players at present. The market is witnessing a surge in M&A activity, with xx deals recorded between 2019 and 2024, reflecting consolidation efforts and strategic expansion among industry players. End-user trends reveal a strong preference for high-bandwidth services, especially in data-intensive industries like cloud computing and media streaming.
- Market Concentration: CR5 estimated at xx% in 2025.
- Innovation Drivers: 400Gbps and beyond bandwidth capabilities, improved network efficiency, and advanced software-defined networking (SDN).
- Regulatory Landscape: Policies related to network infrastructure development and data security significantly influence market growth.
- Product Substitutes: Limited direct substitutes, though alternative technologies are emerging as competitive threats.
- End-User Trends: Increasing demand for high-bandwidth services from data-intensive sectors.
- M&A Activity: xx deals recorded between 2019 and 2024.
Optical Wavelength Services Market Industry Trends & Analysis
The Optical Wavelength Services Market is experiencing significant growth driven by the expanding adoption of cloud computing, the rise of 5G networks, and the increasing demand for high-bandwidth applications like video streaming and online gaming. Technological advancements, such as the deployment of coherent optical transmission systems and the development of 400Gbps and beyond wavelength services, are further accelerating market growth. Consumer preferences are shifting towards higher bandwidth and more reliable network connections, fueling the demand for advanced optical wavelength services. The competitive landscape is dynamic, with major players investing heavily in network infrastructure upgrades and expanding their service offerings to maintain a competitive edge. The market is expected to experience a robust CAGR of xx% during the forecast period, with market penetration steadily increasing across various regions and industries. The penetration rate is projected to reach xx% by 2033.
Leading Markets & Segments in Optical Wavelength Services Market
The North American region currently dominates the Optical Wavelength Services Market, driven by robust investments in telecommunications infrastructure and the high concentration of data centers. Within bandwidth segments, the demand for 100Gbps and above services is experiencing the fastest growth, driven by the increasing adoption of high-bandwidth applications.
- North America Dominance: Driven by robust infrastructure investments and high data center density.
- High-Bandwidth Segment Growth (100Gbps+): Fueled by the rising demand for high-bandwidth applications like cloud computing and video streaming.
- Key Drivers:
- Extensive fiber optic network infrastructure.
- Favorable regulatory policies.
- High concentration of data centers.
- Strong investment in telecommunications technology.
Optical Wavelength Services Market Product Developments
Recent product developments focus on increasing bandwidth capabilities, improving network efficiency, and enhancing service flexibility. The introduction of 400Gbps and higher wavelength services, coupled with advancements in coherent optical transmission, is enabling providers to offer higher speeds and greater capacity to meet growing customer demands. These developments align with broader industry trends towards software-defined networking (SDN) and network function virtualization (NFV), enhancing network agility and reducing operational costs. This market fit addresses the demand for scalable and cost-effective high-bandwidth solutions.
Key Drivers of Optical Wavelength Services Market Growth
Several factors are driving the growth of the Optical Wavelength Services Market. Technological advancements, particularly in coherent optical transmission and higher bandwidth solutions (400Gbps and beyond), are enabling faster speeds and greater capacity. The explosive growth of data-intensive applications, such as cloud computing, video streaming, and online gaming, necessitates high-bandwidth connectivity. Favorable regulatory policies in many regions are supporting infrastructure development and fostering competition. Finally, substantial investments by telecommunication companies in network infrastructure upgrades are further propelling market growth.
Challenges in the Optical Wavelength Services Market Market
Despite the significant growth potential, the Optical Wavelength Services Market faces several challenges. High initial capital investment for infrastructure deployment can be a barrier to entry for new players. Competition among established players is intense, leading to price pressures. Furthermore, regulatory hurdles and permitting processes in some regions can delay network expansion. Supply chain disruptions impacting the availability of crucial components can also hinder market growth, especially considering the specialized components needed in optical transmission. These challenges combine to restrict market expansion and profitability in the short term.
Emerging Opportunities in Optical Wavelength Services Market
The Optical Wavelength Services Market presents several exciting long-term opportunities. The continuous evolution of coherent optical technology holds the promise of significantly increasing bandwidth and improving transmission efficiency. Strategic partnerships between telecommunication companies and cloud providers can unlock new market segments and drive service adoption. Finally, expansion into emerging markets with growing infrastructure investment provides a significant opportunity for market growth.
Leading Players in the Optical Wavelength Services Market Sector
- Telia Carrier
- Cox Communications
- Zayo Group Holdings Inc
- EUnetworks Group
- Jaguar Network SAS
- Charter Communications
- Comcast Corporation
- Exascale Limite
- Verizon Communications Inc
- GTT Communications Inc
- Crown Castle Inc
- CarrierBid Communications
- Colt Technology Services Group Limited
- Nokia Corporation
- Lumen Technologies Inc
- Windstream Holdings Inc
- AT&T Inc
- T-Mobile US Inc
Key Milestones in Optical Wavelength Services Market Industry
- January 2023: Lumen Technologies launched 400Gbps wavelength networks across 70 US markets, covering 240 data centers and offering a self-service tool for clients. This significantly expands high-bandwidth service availability.
- October 2022: LOGIX Fiber Networks and Ciena partnered to launch 100Gbps wavelength services, addressing rising demand driven by cloud services, video streaming, and content consumption. This partnership showcases collaborative efforts to meet expanding market needs.
Strategic Outlook for Optical Wavelength Services Market Market
The Optical Wavelength Services Market is poised for sustained growth driven by ongoing technological advancements, expanding data consumption, and increasing investments in network infrastructure. Strategic partnerships, targeted expansion into emerging markets, and the development of innovative service offerings present significant opportunities for growth and market share gains. The future of this market is bright, promising substantial growth over the next decade, particularly with the rise of new technologies and increased connectivity demands.
Optical Wavelength Services Market Segmentation
-
1. Bandwidth
- 1.1. Less than 10 Gbps
- 1.2. 40 Gbps
- 1.3. 100 Gbps
- 1.4. More Than 100 Gbps
Optical Wavelength Services Market Segmentation By Geography
- 1. North America
- 2. Europe
- 3. Asia Pacific
- 4. Rest of the World
Optical Wavelength Services Market REPORT HIGHLIGHTS
| Aspects | Details |
|---|---|
| Study Period | 2019-2033 |
| Base Year | 2024 |
| Estimated Year | 2025 |
| Forecast Period | 2025-2033 |
| Historical Period | 2019-2024 |
| Growth Rate | CAGR of 11.71% from 2019-2033 |
| Segmentation |
|
Table of Contents
- 1. Introduction
- 1.1. Research Scope
- 1.2. Market Segmentation
- 1.3. Research Methodology
- 1.4. Definitions and Assumptions
- 2. Executive Summary
- 2.1. Introduction
- 3. Market Dynamics
- 3.1. Introduction
- 3.2. Market Drivers
- 3.2.1. Growing Demand for the Internet; Accelerated Bandwidth-intensive Applications
- 3.3. Market Restrains
- 3.3.1. Limited Availability of Incremental Bandwidth; Increasing Demand for Virtual Connectivity
- 3.4. Market Trends
- 3.4.1. Less than 10 Gbps Bandwidth Segment is Expected to Hold Significant Market Share
- 4. Market Factor Analysis
- 4.1. Porters Five Forces
- 4.2. Supply/Value Chain
- 4.3. PESTEL analysis
- 4.4. Market Entropy
- 4.5. Patent/Trademark Analysis
- 5. Global Optical Wavelength Services Market Analysis, Insights and Forecast, 2019-2031
- 5.1. Market Analysis, Insights and Forecast - by Bandwidth
- 5.1.1. Less than 10 Gbps
- 5.1.2. 40 Gbps
- 5.1.3. 100 Gbps
- 5.1.4. More Than 100 Gbps
- 5.2. Market Analysis, Insights and Forecast - by Region
- 5.2.1. North America
- 5.2.2. Europe
- 5.2.3. Asia Pacific
- 5.2.4. Rest of the World
- 5.1. Market Analysis, Insights and Forecast - by Bandwidth
- 6. North America Optical Wavelength Services Market Analysis, Insights and Forecast, 2019-2031
- 6.1. Market Analysis, Insights and Forecast - by Bandwidth
- 6.1.1. Less than 10 Gbps
- 6.1.2. 40 Gbps
- 6.1.3. 100 Gbps
- 6.1.4. More Than 100 Gbps
- 6.1. Market Analysis, Insights and Forecast - by Bandwidth
- 7. Europe Optical Wavelength Services Market Analysis, Insights and Forecast, 2019-2031
- 7.1. Market Analysis, Insights and Forecast - by Bandwidth
- 7.1.1. Less than 10 Gbps
- 7.1.2. 40 Gbps
- 7.1.3. 100 Gbps
- 7.1.4. More Than 100 Gbps
- 7.1. Market Analysis, Insights and Forecast - by Bandwidth
- 8. Asia Pacific Optical Wavelength Services Market Analysis, Insights and Forecast, 2019-2031
- 8.1. Market Analysis, Insights and Forecast - by Bandwidth
- 8.1.1. Less than 10 Gbps
- 8.1.2. 40 Gbps
- 8.1.3. 100 Gbps
- 8.1.4. More Than 100 Gbps
- 8.1. Market Analysis, Insights and Forecast - by Bandwidth
- 9. Rest of the World Optical Wavelength Services Market Analysis, Insights and Forecast, 2019-2031
- 9.1. Market Analysis, Insights and Forecast - by Bandwidth
- 9.1.1. Less than 10 Gbps
- 9.1.2. 40 Gbps
- 9.1.3. 100 Gbps
- 9.1.4. More Than 100 Gbps
- 9.1. Market Analysis, Insights and Forecast - by Bandwidth
- 10. North America Optical Wavelength Services Market Analysis, Insights and Forecast, 2019-2031
- 10.1. Market Analysis, Insights and Forecast - By Country/Sub-region
- 10.1.1.
- 11. Europe Optical Wavelength Services Market Analysis, Insights and Forecast, 2019-2031
- 11.1. Market Analysis, Insights and Forecast - By Country/Sub-region
- 11.1.1.
- 12. Asia Pacific Optical Wavelength Services Market Analysis, Insights and Forecast, 2019-2031
- 12.1. Market Analysis, Insights and Forecast - By Country/Sub-region
- 12.1.1.
- 13. Rest of the World Optical Wavelength Services Market Analysis, Insights and Forecast, 2019-2031
- 13.1. Market Analysis, Insights and Forecast - By Country/Sub-region
- 13.1.1.
- 14. Competitive Analysis
- 14.1. Global Market Share Analysis 2024
- 14.2. Company Profiles
- 14.2.1 Telia Carrier
- 14.2.1.1. Overview
- 14.2.1.2. Products
- 14.2.1.3. SWOT Analysis
- 14.2.1.4. Recent Developments
- 14.2.1.5. Financials (Based on Availability)
- 14.2.2 Cox Communications
- 14.2.2.1. Overview
- 14.2.2.2. Products
- 14.2.2.3. SWOT Analysis
- 14.2.2.4. Recent Developments
- 14.2.2.5. Financials (Based on Availability)
- 14.2.3 Zayo Group Holdings Inc
- 14.2.3.1. Overview
- 14.2.3.2. Products
- 14.2.3.3. SWOT Analysis
- 14.2.3.4. Recent Developments
- 14.2.3.5. Financials (Based on Availability)
- 14.2.4 EUnetworks Group
- 14.2.4.1. Overview
- 14.2.4.2. Products
- 14.2.4.3. SWOT Analysis
- 14.2.4.4. Recent Developments
- 14.2.4.5. Financials (Based on Availability)
- 14.2.5 Jaguar Network SAS
- 14.2.5.1. Overview
- 14.2.5.2. Products
- 14.2.5.3. SWOT Analysis
- 14.2.5.4. Recent Developments
- 14.2.5.5. Financials (Based on Availability)
- 14.2.6 Charter Communications
- 14.2.6.1. Overview
- 14.2.6.2. Products
- 14.2.6.3. SWOT Analysis
- 14.2.6.4. Recent Developments
- 14.2.6.5. Financials (Based on Availability)
- 14.2.7 Comcast Corporation
- 14.2.7.1. Overview
- 14.2.7.2. Products
- 14.2.7.3. SWOT Analysis
- 14.2.7.4. Recent Developments
- 14.2.7.5. Financials (Based on Availability)
- 14.2.8 Exascale Limite
- 14.2.8.1. Overview
- 14.2.8.2. Products
- 14.2.8.3. SWOT Analysis
- 14.2.8.4. Recent Developments
- 14.2.8.5. Financials (Based on Availability)
- 14.2.9 Verizon Communications Inc
- 14.2.9.1. Overview
- 14.2.9.2. Products
- 14.2.9.3. SWOT Analysis
- 14.2.9.4. Recent Developments
- 14.2.9.5. Financials (Based on Availability)
- 14.2.10 GTT Communications Inc
- 14.2.10.1. Overview
- 14.2.10.2. Products
- 14.2.10.3. SWOT Analysis
- 14.2.10.4. Recent Developments
- 14.2.10.5. Financials (Based on Availability)
- 14.2.11 Crown Castle Inc
- 14.2.11.1. Overview
- 14.2.11.2. Products
- 14.2.11.3. SWOT Analysis
- 14.2.11.4. Recent Developments
- 14.2.11.5. Financials (Based on Availability)
- 14.2.12 CarrierBid Communications
- 14.2.12.1. Overview
- 14.2.12.2. Products
- 14.2.12.3. SWOT Analysis
- 14.2.12.4. Recent Developments
- 14.2.12.5. Financials (Based on Availability)
- 14.2.13 Colt Technology Services Group Limited
- 14.2.13.1. Overview
- 14.2.13.2. Products
- 14.2.13.3. SWOT Analysis
- 14.2.13.4. Recent Developments
- 14.2.13.5. Financials (Based on Availability)
- 14.2.14 Nokia Corporation
- 14.2.14.1. Overview
- 14.2.14.2. Products
- 14.2.14.3. SWOT Analysis
- 14.2.14.4. Recent Developments
- 14.2.14.5. Financials (Based on Availability)
- 14.2.15 Lumen Technologies Inc
- 14.2.15.1. Overview
- 14.2.15.2. Products
- 14.2.15.3. SWOT Analysis
- 14.2.15.4. Recent Developments
- 14.2.15.5. Financials (Based on Availability)
- 14.2.16 Windstream Holdings Inc
- 14.2.16.1. Overview
- 14.2.16.2. Products
- 14.2.16.3. SWOT Analysis
- 14.2.16.4. Recent Developments
- 14.2.16.5. Financials (Based on Availability)
- 14.2.17 AT&T Inc
- 14.2.17.1. Overview
- 14.2.17.2. Products
- 14.2.17.3. SWOT Analysis
- 14.2.17.4. Recent Developments
- 14.2.17.5. Financials (Based on Availability)
- 14.2.18 T-Mobile US Inc
- 14.2.18.1. Overview
- 14.2.18.2. Products
- 14.2.18.3. SWOT Analysis
- 14.2.18.4. Recent Developments
- 14.2.18.5. Financials (Based on Availability)
- 14.2.1 Telia Carrier
List of Figures
- Figure 1: Global Optical Wavelength Services Market Revenue Breakdown (Million, %) by Region 2024 & 2032
- Figure 2: North America Optical Wavelength Services Market Revenue (Million), by Country 2024 & 2032
- Figure 3: North America Optical Wavelength Services Market Revenue Share (%), by Country 2024 & 2032
- Figure 4: Europe Optical Wavelength Services Market Revenue (Million), by Country 2024 & 2032
- Figure 5: Europe Optical Wavelength Services Market Revenue Share (%), by Country 2024 & 2032
- Figure 6: Asia Pacific Optical Wavelength Services Market Revenue (Million), by Country 2024 & 2032
- Figure 7: Asia Pacific Optical Wavelength Services Market Revenue Share (%), by Country 2024 & 2032
- Figure 8: Rest of the World Optical Wavelength Services Market Revenue (Million), by Country 2024 & 2032
- Figure 9: Rest of the World Optical Wavelength Services Market Revenue Share (%), by Country 2024 & 2032
- Figure 10: North America Optical Wavelength Services Market Revenue (Million), by Bandwidth 2024 & 2032
- Figure 11: North America Optical Wavelength Services Market Revenue Share (%), by Bandwidth 2024 & 2032
- Figure 12: North America Optical Wavelength Services Market Revenue (Million), by Country 2024 & 2032
- Figure 13: North America Optical Wavelength Services Market Revenue Share (%), by Country 2024 & 2032
- Figure 14: Europe Optical Wavelength Services Market Revenue (Million), by Bandwidth 2024 & 2032
- Figure 15: Europe Optical Wavelength Services Market Revenue Share (%), by Bandwidth 2024 & 2032
- Figure 16: Europe Optical Wavelength Services Market Revenue (Million), by Country 2024 & 2032
- Figure 17: Europe Optical Wavelength Services Market Revenue Share (%), by Country 2024 & 2032
- Figure 18: Asia Pacific Optical Wavelength Services Market Revenue (Million), by Bandwidth 2024 & 2032
- Figure 19: Asia Pacific Optical Wavelength Services Market Revenue Share (%), by Bandwidth 2024 & 2032
- Figure 20: Asia Pacific Optical Wavelength Services Market Revenue (Million), by Country 2024 & 2032
- Figure 21: Asia Pacific Optical Wavelength Services Market Revenue Share (%), by Country 2024 & 2032
- Figure 22: Rest of the World Optical Wavelength Services Market Revenue (Million), by Bandwidth 2024 & 2032
- Figure 23: Rest of the World Optical Wavelength Services Market Revenue Share (%), by Bandwidth 2024 & 2032
- Figure 24: Rest of the World Optical Wavelength Services Market Revenue (Million), by Country 2024 & 2032
- Figure 25: Rest of the World Optical Wavelength Services Market Revenue Share (%), by Country 2024 & 2032
List of Tables
- Table 1: Global Optical Wavelength Services Market Revenue Million Forecast, by Region 2019 & 2032
- Table 2: Global Optical Wavelength Services Market Revenue Million Forecast, by Bandwidth 2019 & 2032
- Table 3: Global Optical Wavelength Services Market Revenue Million Forecast, by Region 2019 & 2032
- Table 4: Global Optical Wavelength Services Market Revenue Million Forecast, by Country 2019 & 2032
- Table 5: Optical Wavelength Services Market Revenue (Million) Forecast, by Application 2019 & 2032
- Table 6: Global Optical Wavelength Services Market Revenue Million Forecast, by Country 2019 & 2032
- Table 7: Optical Wavelength Services Market Revenue (Million) Forecast, by Application 2019 & 2032
- Table 8: Global Optical Wavelength Services Market Revenue Million Forecast, by Country 2019 & 2032
- Table 9: Optical Wavelength Services Market Revenue (Million) Forecast, by Application 2019 & 2032
- Table 10: Global Optical Wavelength Services Market Revenue Million Forecast, by Country 2019 & 2032
- Table 11: Optical Wavelength Services Market Revenue (Million) Forecast, by Application 2019 & 2032
- Table 12: Global Optical Wavelength Services Market Revenue Million Forecast, by Bandwidth 2019 & 2032
- Table 13: Global Optical Wavelength Services Market Revenue Million Forecast, by Country 2019 & 2032
- Table 14: Global Optical Wavelength Services Market Revenue Million Forecast, by Bandwidth 2019 & 2032
- Table 15: Global Optical Wavelength Services Market Revenue Million Forecast, by Country 2019 & 2032
- Table 16: Global Optical Wavelength Services Market Revenue Million Forecast, by Bandwidth 2019 & 2032
- Table 17: Global Optical Wavelength Services Market Revenue Million Forecast, by Country 2019 & 2032
- Table 18: Global Optical Wavelength Services Market Revenue Million Forecast, by Bandwidth 2019 & 2032
- Table 19: Global Optical Wavelength Services Market Revenue Million Forecast, by Country 2019 & 2032
Frequently Asked Questions
1. What is the projected Compound Annual Growth Rate (CAGR) of the Optical Wavelength Services Market?
The projected CAGR is approximately 11.71%.
2. Which companies are prominent players in the Optical Wavelength Services Market?
Key companies in the market include Telia Carrier, Cox Communications, Zayo Group Holdings Inc, EUnetworks Group, Jaguar Network SAS, Charter Communications, Comcast Corporation, Exascale Limite, Verizon Communications Inc, GTT Communications Inc, Crown Castle Inc, CarrierBid Communications, Colt Technology Services Group Limited, Nokia Corporation, Lumen Technologies Inc, Windstream Holdings Inc, AT&T Inc, T-Mobile US Inc.
3. What are the main segments of the Optical Wavelength Services Market?
The market segments include Bandwidth.
4. Can you provide details about the market size?
The market size is estimated to be USD 4.84 Million as of 2022.
5. What are some drivers contributing to market growth?
Growing Demand for the Internet; Accelerated Bandwidth-intensive Applications.
6. What are the notable trends driving market growth?
Less than 10 Gbps Bandwidth Segment is Expected to Hold Significant Market Share.
7. Are there any restraints impacting market growth?
Limited Availability of Incremental Bandwidth; Increasing Demand for Virtual Connectivity.
8. Can you provide examples of recent developments in the market?
January 2023: Lumen Technologies started distributing 400 Gbps wavelength networks in the United States. The company will serve 70 markets across the country, covering 240 data centers with more than 50 TB of 400 G wavelengths. Additionally, Lumen will provide its clients with a self-service tool that allows them to quote, design, and build their wavelengths across Lumen's North American Network.
9. What pricing options are available for accessing the report?
Pricing options include single-user, multi-user, and enterprise licenses priced at USD 4750, USD 5250, and USD 8750 respectively.
10. Is the market size provided in terms of value or volume?
The market size is provided in terms of value, measured in Million.
11. Are there any specific market keywords associated with the report?
Yes, the market keyword associated with the report is "Optical Wavelength Services Market," which aids in identifying and referencing the specific market segment covered.
12. How do I determine which pricing option suits my needs best?
The pricing options vary based on user requirements and access needs. Individual users may opt for single-user licenses, while businesses requiring broader access may choose multi-user or enterprise licenses for cost-effective access to the report.
13. Are there any additional resources or data provided in the Optical Wavelength Services Market report?
While the report offers comprehensive insights, it's advisable to review the specific contents or supplementary materials provided to ascertain if additional resources or data are available.
14. How can I stay updated on further developments or reports in the Optical Wavelength Services Market?
To stay informed about further developments, trends, and reports in the Optical Wavelength Services Market, consider subscribing to industry newsletters, following relevant companies and organizations, or regularly checking reputable industry news sources and publications.
Methodology
Step 1 - Identification of Relevant Samples Size from Population Database


Step 2 - Approaches for Defining Global Market Size (Value, Volume* & Price*)

Note*: In applicable scenarios
Step 3 - Data Sources
Primary Research
- Web Analytics
- Survey Reports
- Research Institute
- Latest Research Reports
- Opinion Leaders
Secondary Research
- Annual Reports
- White Paper
- Latest Press Release
- Industry Association
- Paid Database
- Investor Presentations

Step 4 - Data Triangulation
Involves using different sources of information in order to increase the validity of a study
These sources are likely to be stakeholders in a program - participants, other researchers, program staff, other community members, and so on.
Then we put all data in single framework & apply various statistical tools to find out the dynamic on the market.
During the analysis stage, feedback from the stakeholder groups would be compared to determine areas of agreement as well as areas of divergence
