

Key Insights
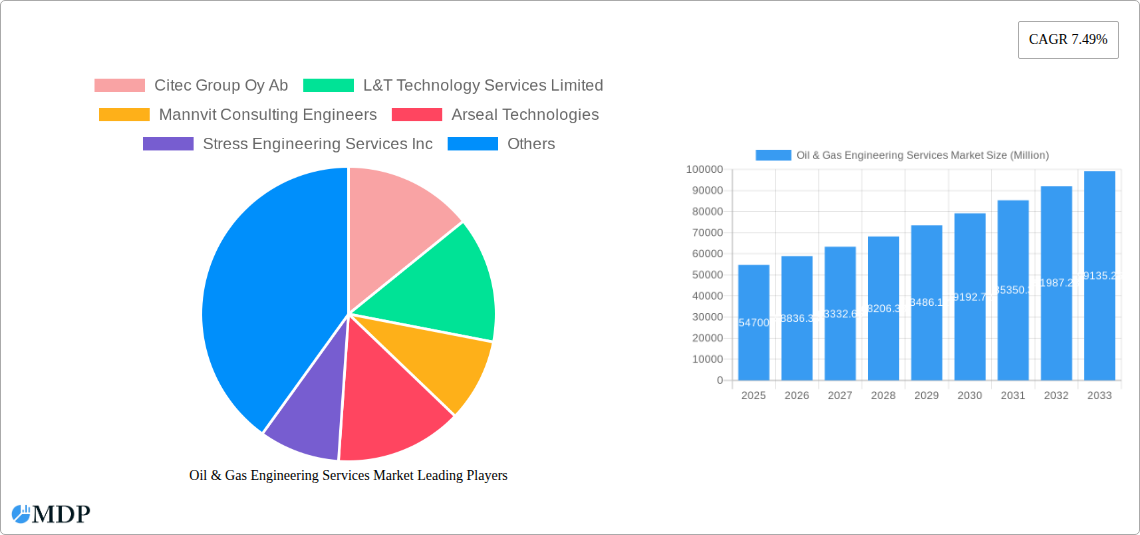
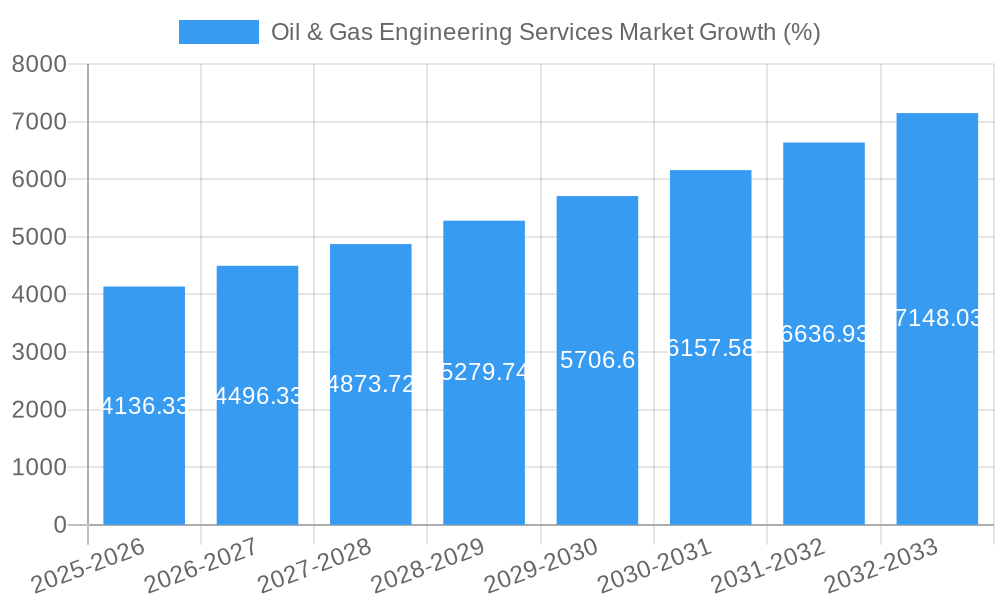
The Oil & Gas Engineering Services market is poised for significant growth, projected to reach \$54.70 billion in 2025 and maintain a Compound Annual Growth Rate (CAGR) of 7.49% from 2025 to 2033. This expansion is driven by several key factors. Firstly, increasing global energy demand necessitates substantial investment in new oil and gas infrastructure, creating a robust demand for engineering services across upstream, midstream, and downstream operations. Secondly, the ongoing transition towards cleaner energy sources is indirectly fueling growth, as many companies require engineering expertise to adapt existing infrastructure and explore carbon capture and storage technologies. Finally, technological advancements, such as digitalization and automation in engineering processes, are enhancing efficiency and driving down costs, making engineering services more accessible and attractive. The market is segmented by type (upstream, midstream, and downstream), reflecting the diverse needs within the oil and gas value chain. Major players like Citec Group Oy Ab, L&T Technology Services Limited, and Wood PLC are actively shaping the market landscape through technological innovation and strategic acquisitions.
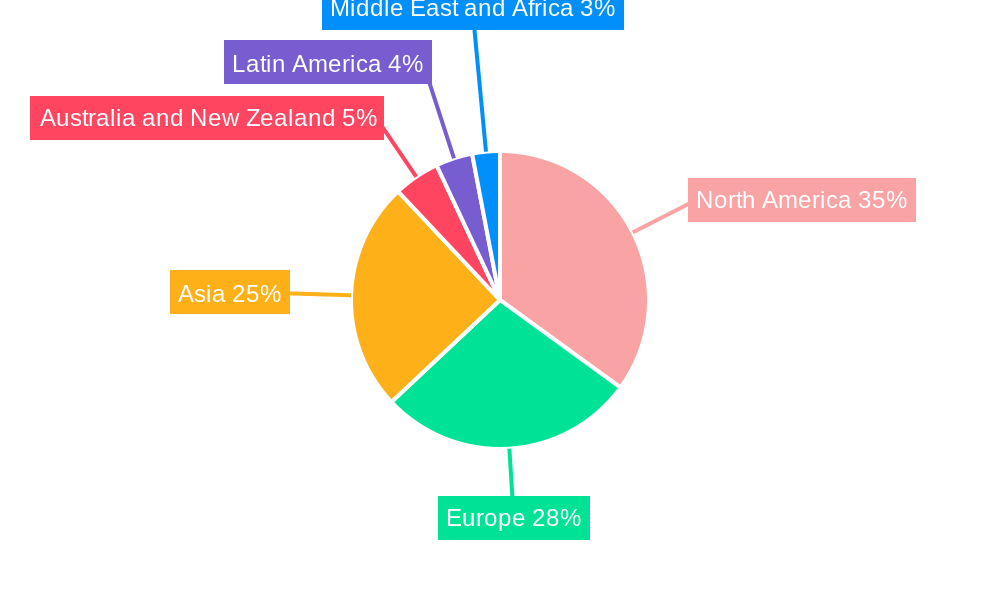
Growth across different regions is anticipated to vary, reflecting unique market dynamics and regulatory landscapes. North America and Europe, with their established oil and gas industries and significant investment in infrastructure upgrades, are expected to hold substantial market shares. However, Asia-Pacific is projected to witness the fastest growth due to rapid industrialization and expanding energy consumption. While regulatory hurdles and environmental concerns pose some restraints, the overall market outlook remains positive, driven by the persistent need for reliable energy supplies and the ongoing evolution of the oil and gas sector. The market’s continued expansion will depend on sustained investment in both traditional and renewable energy sources and the success of companies in adapting to the global energy transition. Competition will intensify as established firms and new entrants vie for market share, leading to price optimization and innovations in service delivery.
Oil & Gas Engineering Services Market Report: 2019-2033
Unlocking Growth in the Dynamic Oil & Gas Engineering Services Market: A Comprehensive Analysis from 2019 to 2033
This comprehensive report provides an in-depth analysis of the Oil & Gas Engineering Services market, offering valuable insights for stakeholders across the industry. Covering the period from 2019 to 2033, with a base year of 2025 and a forecast period spanning 2025-2033, this report is essential for strategic decision-making and informed investment strategies. The market is valued at xx Million in 2025 and is projected to reach xx Million by 2033, exhibiting a CAGR of xx%.
Oil & Gas Engineering Services Market Dynamics & Concentration
The Oil & Gas Engineering Services market is characterized by a moderate level of concentration, with a few large players and numerous smaller specialized firms. Market share is currently dominated by a handful of multinational companies, accounting for approximately xx% of the total market. However, the market also exhibits a significant presence of smaller, regional players specializing in niche services or geographic areas. Innovation is a key driver, with companies constantly seeking to improve efficiency, reduce costs, and enhance safety through technological advancements in areas like digitalization and automation. The regulatory landscape plays a crucial role, with evolving environmental regulations and safety standards significantly impacting operational strategies and investment decisions. Product substitutes, while limited, are increasingly emerging in specific niches, particularly in the renewable energy sector. End-user trends reveal a growing focus on sustainability, cost optimization, and integrated solutions. M&A activity is relatively frequent, with an estimated xx number of deals annually, driven by the need to expand capabilities, access new markets, and consolidate market share.
- Market Concentration: Moderately concentrated with xx% market share held by top players.
- Innovation Drivers: Digitalization, automation, and sustainable technologies.
- Regulatory Frameworks: Stringent environmental regulations and safety standards.
- Product Substitutes: Increasing presence of renewable energy solutions in certain niches.
- End-User Trends: Growing emphasis on sustainability and cost-effectiveness.
- M&A Activity: Approximately xx deals annually, driven by expansion and consolidation.
Oil & Gas Engineering Services Market Industry Trends & Analysis
The Oil & Gas Engineering Services market is experiencing dynamic growth driven by several factors. Increased exploration and production activities, particularly in unconventional resources, fuels demand for specialized engineering services. Technological advancements, such as advanced analytics and digital twins, are enhancing efficiency and optimizing operations. Consumer preferences are shifting towards integrated, holistic solutions that encompass the entire value chain, from upstream exploration to downstream processing and distribution. The competitive landscape is highly dynamic, with companies vying for market share through innovation, strategic partnerships, and geographic expansion. The market demonstrates a strong correlation with global energy demand, experiencing periods of expansion during periods of high energy consumption and facing challenges during economic downturns. The integration of Artificial Intelligence (AI) and Machine Learning (ML) for predictive maintenance and operational optimization is steadily increasing market penetration.
Leading Markets & Segments in Oil & Gas Engineering Services Market
The Upstream segment currently represents the largest share of the Oil & Gas Engineering Services market, driven by significant investment in exploration and production activities globally. Key drivers within this segment include the ongoing exploration of unconventional resources such as shale gas and tight oil, and the development of deepwater and arctic projects. Specific regions exhibiting strong growth include the Middle East, North America, and parts of Asia.
- Upstream Segment Drivers:
- Exploration and production of unconventional resources (shale gas, tight oil).
- Development of deepwater and arctic projects.
- Significant investments in exploration and production infrastructure.
- Midstream Segment: Focuses on transportation and storage, with growth spurred by pipeline expansion and storage facility development.
- Downstream Segment: Includes refining, processing, and distribution; influenced by fluctuations in global fuel demand and refinery modernization projects.
The dominance of the Upstream segment is attributed to the higher capital expenditure associated with exploration and production compared to midstream and downstream activities. Government policies supporting energy independence and energy security also significantly contribute to the growth of the upstream segment.
Oil & Gas Engineering Services Market Product Developments
Recent product innovations focus on digital solutions, including advanced simulation software, data analytics platforms, and digital twin technologies for improved asset management and operational efficiency. These innovations enhance safety, reduce downtime, and optimize resource allocation. The market is seeing a growing demand for integrated engineering solutions that provide a holistic approach to project development, encompassing all stages from concept design to construction and commissioning.
Key Drivers of Oil & Gas Engineering Services Market Growth
Several key factors propel the growth of the Oil & Gas Engineering Services market. Firstly, the increasing global demand for energy fuels investment in exploration and production, driving demand for engineering services. Secondly, advancements in technologies such as AI and automation enhance efficiency and productivity. Finally, government regulations mandating higher safety and environmental standards create new opportunities for specialized engineering expertise.
Challenges in the Oil & Gas Engineering Services Market
The market faces challenges like volatile oil and gas prices impacting investment decisions, stringent environmental regulations increasing operational costs, and geopolitical instability creating uncertainty. Supply chain disruptions further complicate operations, while intense competition among engineering firms puts pressure on pricing and margins. These factors impact overall market growth and profitability, demanding robust risk management strategies and adaptability.
Emerging Opportunities in Oil & Gas Engineering Services Market
The integration of renewable energy sources into the existing oil and gas infrastructure opens up new opportunities. Strategic partnerships between traditional engineering firms and technology companies foster innovation, while expansion into emerging markets presents further growth potential.
Leading Players in the Oil & Gas Engineering Services Sector
- Citec Group Oy Ab
- L&T Technology Services Limited
- Mannvit Consulting Engineers
- Arseal Technologies
- Stress Engineering Services Inc
- Wood PLC
- Lloyd's Register Group Services Limited
- M&H
- WSP Global Inc
- Hatch Ltd
- Element Materials Technology
- Toyo Engineering Corporation
- Tetra Tech Inc
- QuEST Global Services Pte Ltd
Key Milestones in Oil & Gas Engineering Services Market Industry
- March 2024: Genesis selected for Offshore Systems Engineering Services for the Northern Endurance Partnership's CCS infrastructure project in the UK. This signifies a significant push towards decarbonization and highlights the increasing demand for engineering services in the CCS sector.
- March 2024: Genesis and Beicip announce a collaboration to provide integrated solutions for field development planning, emphasizing a growing need for holistic, sustainable approaches in project development. This partnership underscores the market's shift towards integrated solutions and sustainable practices.
Strategic Outlook for Oil & Gas Engineering Services Market
The Oil & Gas Engineering Services market is poised for continued growth, driven by increasing energy demand and technological advancements. Strategic partnerships, investments in digital technologies, and expansion into emerging markets are key growth accelerators. Companies that effectively adapt to evolving regulations and embrace sustainable practices are best positioned for long-term success.
Oil & Gas Engineering Services Market Segmentation
-
1. Type
- 1.1. Downstream
- 1.2. Midstream
- 1.3. Upstream
Oil & Gas Engineering Services Market Segmentation By Geography
- 1. North America
- 2. Europe
- 3. Asia
- 4. Australia and New Zealand
- 5. Latin America
- 6. Middle East and Africa
Oil & Gas Engineering Services Market REPORT HIGHLIGHTS
| Aspects | Details |
|---|---|
| Study Period | 2019-2033 |
| Base Year | 2024 |
| Estimated Year | 2025 |
| Forecast Period | 2025-2033 |
| Historical Period | 2019-2024 |
| Growth Rate | CAGR of 7.49% from 2019-2033 |
| Segmentation |
|
Table of Contents
- 1. Introduction
- 1.1. Research Scope
- 1.2. Market Segmentation
- 1.3. Research Methodology
- 1.4. Definitions and Assumptions
- 2. Executive Summary
- 2.1. Introduction
- 3. Market Dynamics
- 3.1. Introduction
- 3.2. Market Drivers
- 3.2.1. Growing Adoption of Automation in the Oil and Gas Industry to Aid Growth of Design and Engineering Services; Ongoing Efforts to Enhance Cost and Operational Efficiency in the Oil and Gas Industry; Industry 4.0 Practices Such as Extended Reality and BIM 4D to Reduce TTM
- 3.3. Market Restrains
- 3.3.1. The Market is Susceptible to Fluctuations in the Oil and Gas Prices as Well as Other Macroeconomic Changes; Operational and Compliance-related Challenges
- 3.4. Market Trends
- 3.4.1. Downstream Segment to Exhibit Significant Growth
- 4. Market Factor Analysis
- 4.1. Porters Five Forces
- 4.2. Supply/Value Chain
- 4.3. PESTEL analysis
- 4.4. Market Entropy
- 4.5. Patent/Trademark Analysis
- 5. Global Oil & Gas Engineering Services Market Analysis, Insights and Forecast, 2019-2031
- 5.1. Market Analysis, Insights and Forecast - by Type
- 5.1.1. Downstream
- 5.1.2. Midstream
- 5.1.3. Upstream
- 5.2. Market Analysis, Insights and Forecast - by Region
- 5.2.1. North America
- 5.2.2. Europe
- 5.2.3. Asia
- 5.2.4. Australia and New Zealand
- 5.2.5. Latin America
- 5.2.6. Middle East and Africa
- 5.1. Market Analysis, Insights and Forecast - by Type
- 6. North America Oil & Gas Engineering Services Market Analysis, Insights and Forecast, 2019-2031
- 6.1. Market Analysis, Insights and Forecast - by Type
- 6.1.1. Downstream
- 6.1.2. Midstream
- 6.1.3. Upstream
- 6.1. Market Analysis, Insights and Forecast - by Type
- 7. Europe Oil & Gas Engineering Services Market Analysis, Insights and Forecast, 2019-2031
- 7.1. Market Analysis, Insights and Forecast - by Type
- 7.1.1. Downstream
- 7.1.2. Midstream
- 7.1.3. Upstream
- 7.1. Market Analysis, Insights and Forecast - by Type
- 8. Asia Oil & Gas Engineering Services Market Analysis, Insights and Forecast, 2019-2031
- 8.1. Market Analysis, Insights and Forecast - by Type
- 8.1.1. Downstream
- 8.1.2. Midstream
- 8.1.3. Upstream
- 8.1. Market Analysis, Insights and Forecast - by Type
- 9. Australia and New Zealand Oil & Gas Engineering Services Market Analysis, Insights and Forecast, 2019-2031
- 9.1. Market Analysis, Insights and Forecast - by Type
- 9.1.1. Downstream
- 9.1.2. Midstream
- 9.1.3. Upstream
- 9.1. Market Analysis, Insights and Forecast - by Type
- 10. Latin America Oil & Gas Engineering Services Market Analysis, Insights and Forecast, 2019-2031
- 10.1. Market Analysis, Insights and Forecast - by Type
- 10.1.1. Downstream
- 10.1.2. Midstream
- 10.1.3. Upstream
- 10.1. Market Analysis, Insights and Forecast - by Type
- 11. Middle East and Africa Oil & Gas Engineering Services Market Analysis, Insights and Forecast, 2019-2031
- 11.1. Market Analysis, Insights and Forecast - by Type
- 11.1.1. Downstream
- 11.1.2. Midstream
- 11.1.3. Upstream
- 11.1. Market Analysis, Insights and Forecast - by Type
- 12. North America Oil & Gas Engineering Services Market Analysis, Insights and Forecast, 2019-2031
- 12.1. Market Analysis, Insights and Forecast - By Country/Sub-region
- 12.1.1.
- 13. Europe Oil & Gas Engineering Services Market Analysis, Insights and Forecast, 2019-2031
- 13.1. Market Analysis, Insights and Forecast - By Country/Sub-region
- 13.1.1.
- 14. Asia Oil & Gas Engineering Services Market Analysis, Insights and Forecast, 2019-2031
- 14.1. Market Analysis, Insights and Forecast - By Country/Sub-region
- 14.1.1.
- 15. Australia and New Zealand Oil & Gas Engineering Services Market Analysis, Insights and Forecast, 2019-2031
- 15.1. Market Analysis, Insights and Forecast - By Country/Sub-region
- 15.1.1.
- 16. Latin America Oil & Gas Engineering Services Market Analysis, Insights and Forecast, 2019-2031
- 16.1. Market Analysis, Insights and Forecast - By Country/Sub-region
- 16.1.1.
- 17. Middle East and Africa Oil & Gas Engineering Services Market Analysis, Insights and Forecast, 2019-2031
- 17.1. Market Analysis, Insights and Forecast - By Country/Sub-region
- 17.1.1.
- 18. Competitive Analysis
- 18.1. Global Market Share Analysis 2024
- 18.2. Company Profiles
- 18.2.1 Citec Group Oy Ab
- 18.2.1.1. Overview
- 18.2.1.2. Products
- 18.2.1.3. SWOT Analysis
- 18.2.1.4. Recent Developments
- 18.2.1.5. Financials (Based on Availability)
- 18.2.2 L&T Technology Services Limited
- 18.2.2.1. Overview
- 18.2.2.2. Products
- 18.2.2.3. SWOT Analysis
- 18.2.2.4. Recent Developments
- 18.2.2.5. Financials (Based on Availability)
- 18.2.3 Mannvit Consulting Engineers
- 18.2.3.1. Overview
- 18.2.3.2. Products
- 18.2.3.3. SWOT Analysis
- 18.2.3.4. Recent Developments
- 18.2.3.5. Financials (Based on Availability)
- 18.2.4 Arseal Technologies
- 18.2.4.1. Overview
- 18.2.4.2. Products
- 18.2.4.3. SWOT Analysis
- 18.2.4.4. Recent Developments
- 18.2.4.5. Financials (Based on Availability)
- 18.2.5 Stress Engineering Services Inc
- 18.2.5.1. Overview
- 18.2.5.2. Products
- 18.2.5.3. SWOT Analysis
- 18.2.5.4. Recent Developments
- 18.2.5.5. Financials (Based on Availability)
- 18.2.6 Wood PLC
- 18.2.6.1. Overview
- 18.2.6.2. Products
- 18.2.6.3. SWOT Analysis
- 18.2.6.4. Recent Developments
- 18.2.6.5. Financials (Based on Availability)
- 18.2.7 Lloyd's Register Group Services Limite
- 18.2.7.1. Overview
- 18.2.7.2. Products
- 18.2.7.3. SWOT Analysis
- 18.2.7.4. Recent Developments
- 18.2.7.5. Financials (Based on Availability)
- 18.2.8 M&H
- 18.2.8.1. Overview
- 18.2.8.2. Products
- 18.2.8.3. SWOT Analysis
- 18.2.8.4. Recent Developments
- 18.2.8.5. Financials (Based on Availability)
- 18.2.9 WSP Global Inc
- 18.2.9.1. Overview
- 18.2.9.2. Products
- 18.2.9.3. SWOT Analysis
- 18.2.9.4. Recent Developments
- 18.2.9.5. Financials (Based on Availability)
- 18.2.10 Hatch Ltd
- 18.2.10.1. Overview
- 18.2.10.2. Products
- 18.2.10.3. SWOT Analysis
- 18.2.10.4. Recent Developments
- 18.2.10.5. Financials (Based on Availability)
- 18.2.11 Element Materials Technology
- 18.2.11.1. Overview
- 18.2.11.2. Products
- 18.2.11.3. SWOT Analysis
- 18.2.11.4. Recent Developments
- 18.2.11.5. Financials (Based on Availability)
- 18.2.12 Toyo Engineering Corporation
- 18.2.12.1. Overview
- 18.2.12.2. Products
- 18.2.12.3. SWOT Analysis
- 18.2.12.4. Recent Developments
- 18.2.12.5. Financials (Based on Availability)
- 18.2.13 Tetra Tech Inc
- 18.2.13.1. Overview
- 18.2.13.2. Products
- 18.2.13.3. SWOT Analysis
- 18.2.13.4. Recent Developments
- 18.2.13.5. Financials (Based on Availability)
- 18.2.14 QuEST Global Services Pte Ltd
- 18.2.14.1. Overview
- 18.2.14.2. Products
- 18.2.14.3. SWOT Analysis
- 18.2.14.4. Recent Developments
- 18.2.14.5. Financials (Based on Availability)
- 18.2.1 Citec Group Oy Ab
List of Figures
- Figure 1: Global Oil & Gas Engineering Services Market Revenue Breakdown (Million, %) by Region 2024 & 2032
- Figure 2: North America Oil & Gas Engineering Services Market Revenue (Million), by Country 2024 & 2032
- Figure 3: North America Oil & Gas Engineering Services Market Revenue Share (%), by Country 2024 & 2032
- Figure 4: Europe Oil & Gas Engineering Services Market Revenue (Million), by Country 2024 & 2032
- Figure 5: Europe Oil & Gas Engineering Services Market Revenue Share (%), by Country 2024 & 2032
- Figure 6: Asia Oil & Gas Engineering Services Market Revenue (Million), by Country 2024 & 2032
- Figure 7: Asia Oil & Gas Engineering Services Market Revenue Share (%), by Country 2024 & 2032
- Figure 8: Australia and New Zealand Oil & Gas Engineering Services Market Revenue (Million), by Country 2024 & 2032
- Figure 9: Australia and New Zealand Oil & Gas Engineering Services Market Revenue Share (%), by Country 2024 & 2032
- Figure 10: Latin America Oil & Gas Engineering Services Market Revenue (Million), by Country 2024 & 2032
- Figure 11: Latin America Oil & Gas Engineering Services Market Revenue Share (%), by Country 2024 & 2032
- Figure 12: Middle East and Africa Oil & Gas Engineering Services Market Revenue (Million), by Country 2024 & 2032
- Figure 13: Middle East and Africa Oil & Gas Engineering Services Market Revenue Share (%), by Country 2024 & 2032
- Figure 14: North America Oil & Gas Engineering Services Market Revenue (Million), by Type 2024 & 2032
- Figure 15: North America Oil & Gas Engineering Services Market Revenue Share (%), by Type 2024 & 2032
- Figure 16: North America Oil & Gas Engineering Services Market Revenue (Million), by Country 2024 & 2032
- Figure 17: North America Oil & Gas Engineering Services Market Revenue Share (%), by Country 2024 & 2032
- Figure 18: Europe Oil & Gas Engineering Services Market Revenue (Million), by Type 2024 & 2032
- Figure 19: Europe Oil & Gas Engineering Services Market Revenue Share (%), by Type 2024 & 2032
- Figure 20: Europe Oil & Gas Engineering Services Market Revenue (Million), by Country 2024 & 2032
- Figure 21: Europe Oil & Gas Engineering Services Market Revenue Share (%), by Country 2024 & 2032
- Figure 22: Asia Oil & Gas Engineering Services Market Revenue (Million), by Type 2024 & 2032
- Figure 23: Asia Oil & Gas Engineering Services Market Revenue Share (%), by Type 2024 & 2032
- Figure 24: Asia Oil & Gas Engineering Services Market Revenue (Million), by Country 2024 & 2032
- Figure 25: Asia Oil & Gas Engineering Services Market Revenue Share (%), by Country 2024 & 2032
- Figure 26: Australia and New Zealand Oil & Gas Engineering Services Market Revenue (Million), by Type 2024 & 2032
- Figure 27: Australia and New Zealand Oil & Gas Engineering Services Market Revenue Share (%), by Type 2024 & 2032
- Figure 28: Australia and New Zealand Oil & Gas Engineering Services Market Revenue (Million), by Country 2024 & 2032
- Figure 29: Australia and New Zealand Oil & Gas Engineering Services Market Revenue Share (%), by Country 2024 & 2032
- Figure 30: Latin America Oil & Gas Engineering Services Market Revenue (Million), by Type 2024 & 2032
- Figure 31: Latin America Oil & Gas Engineering Services Market Revenue Share (%), by Type 2024 & 2032
- Figure 32: Latin America Oil & Gas Engineering Services Market Revenue (Million), by Country 2024 & 2032
- Figure 33: Latin America Oil & Gas Engineering Services Market Revenue Share (%), by Country 2024 & 2032
- Figure 34: Middle East and Africa Oil & Gas Engineering Services Market Revenue (Million), by Type 2024 & 2032
- Figure 35: Middle East and Africa Oil & Gas Engineering Services Market Revenue Share (%), by Type 2024 & 2032
- Figure 36: Middle East and Africa Oil & Gas Engineering Services Market Revenue (Million), by Country 2024 & 2032
- Figure 37: Middle East and Africa Oil & Gas Engineering Services Market Revenue Share (%), by Country 2024 & 2032
List of Tables
- Table 1: Global Oil & Gas Engineering Services Market Revenue Million Forecast, by Region 2019 & 2032
- Table 2: Global Oil & Gas Engineering Services Market Revenue Million Forecast, by Type 2019 & 2032
- Table 3: Global Oil & Gas Engineering Services Market Revenue Million Forecast, by Region 2019 & 2032
- Table 4: Global Oil & Gas Engineering Services Market Revenue Million Forecast, by Country 2019 & 2032
- Table 5: Oil & Gas Engineering Services Market Revenue (Million) Forecast, by Application 2019 & 2032
- Table 6: Global Oil & Gas Engineering Services Market Revenue Million Forecast, by Country 2019 & 2032
- Table 7: Oil & Gas Engineering Services Market Revenue (Million) Forecast, by Application 2019 & 2032
- Table 8: Global Oil & Gas Engineering Services Market Revenue Million Forecast, by Country 2019 & 2032
- Table 9: Oil & Gas Engineering Services Market Revenue (Million) Forecast, by Application 2019 & 2032
- Table 10: Global Oil & Gas Engineering Services Market Revenue Million Forecast, by Country 2019 & 2032
- Table 11: Oil & Gas Engineering Services Market Revenue (Million) Forecast, by Application 2019 & 2032
- Table 12: Global Oil & Gas Engineering Services Market Revenue Million Forecast, by Country 2019 & 2032
- Table 13: Oil & Gas Engineering Services Market Revenue (Million) Forecast, by Application 2019 & 2032
- Table 14: Global Oil & Gas Engineering Services Market Revenue Million Forecast, by Country 2019 & 2032
- Table 15: Oil & Gas Engineering Services Market Revenue (Million) Forecast, by Application 2019 & 2032
- Table 16: Global Oil & Gas Engineering Services Market Revenue Million Forecast, by Type 2019 & 2032
- Table 17: Global Oil & Gas Engineering Services Market Revenue Million Forecast, by Country 2019 & 2032
- Table 18: Global Oil & Gas Engineering Services Market Revenue Million Forecast, by Type 2019 & 2032
- Table 19: Global Oil & Gas Engineering Services Market Revenue Million Forecast, by Country 2019 & 2032
- Table 20: Global Oil & Gas Engineering Services Market Revenue Million Forecast, by Type 2019 & 2032
- Table 21: Global Oil & Gas Engineering Services Market Revenue Million Forecast, by Country 2019 & 2032
- Table 22: Global Oil & Gas Engineering Services Market Revenue Million Forecast, by Type 2019 & 2032
- Table 23: Global Oil & Gas Engineering Services Market Revenue Million Forecast, by Country 2019 & 2032
- Table 24: Global Oil & Gas Engineering Services Market Revenue Million Forecast, by Type 2019 & 2032
- Table 25: Global Oil & Gas Engineering Services Market Revenue Million Forecast, by Country 2019 & 2032
- Table 26: Global Oil & Gas Engineering Services Market Revenue Million Forecast, by Type 2019 & 2032
- Table 27: Global Oil & Gas Engineering Services Market Revenue Million Forecast, by Country 2019 & 2032
Frequently Asked Questions
1. What is the projected Compound Annual Growth Rate (CAGR) of the Oil & Gas Engineering Services Market?
The projected CAGR is approximately 7.49%.
2. Which companies are prominent players in the Oil & Gas Engineering Services Market?
Key companies in the market include Citec Group Oy Ab, L&T Technology Services Limited, Mannvit Consulting Engineers, Arseal Technologies, Stress Engineering Services Inc, Wood PLC, Lloyd's Register Group Services Limite, M&H, WSP Global Inc, Hatch Ltd, Element Materials Technology, Toyo Engineering Corporation, Tetra Tech Inc, QuEST Global Services Pte Ltd.
3. What are the main segments of the Oil & Gas Engineering Services Market?
The market segments include Type.
4. Can you provide details about the market size?
The market size is estimated to be USD 54.70 Million as of 2022.
5. What are some drivers contributing to market growth?
Growing Adoption of Automation in the Oil and Gas Industry to Aid Growth of Design and Engineering Services; Ongoing Efforts to Enhance Cost and Operational Efficiency in the Oil and Gas Industry; Industry 4.0 Practices Such as Extended Reality and BIM 4D to Reduce TTM.
6. What are the notable trends driving market growth?
Downstream Segment to Exhibit Significant Growth.
7. Are there any restraints impacting market growth?
The Market is Susceptible to Fluctuations in the Oil and Gas Prices as Well as Other Macroeconomic Changes; Operational and Compliance-related Challenges.
8. Can you provide examples of recent developments in the market?
March 2024 - Genesis has been selected to provide Offshore Systems Engineering Services for the Northern Endurance Partnership part of the East Coast Cluster in the UK, These projects are actively bringing together communities, business, and academia to deliver the carbon capture and storage (CCS) infrastructure needed to decarbonise this key industrial heartland of the UK.
9. What pricing options are available for accessing the report?
Pricing options include single-user, multi-user, and enterprise licenses priced at USD 4750, USD 5250, and USD 8750 respectively.
10. Is the market size provided in terms of value or volume?
The market size is provided in terms of value, measured in Million.
11. Are there any specific market keywords associated with the report?
Yes, the market keyword associated with the report is "Oil & Gas Engineering Services Market," which aids in identifying and referencing the specific market segment covered.
12. How do I determine which pricing option suits my needs best?
The pricing options vary based on user requirements and access needs. Individual users may opt for single-user licenses, while businesses requiring broader access may choose multi-user or enterprise licenses for cost-effective access to the report.
13. Are there any additional resources or data provided in the Oil & Gas Engineering Services Market report?
While the report offers comprehensive insights, it's advisable to review the specific contents or supplementary materials provided to ascertain if additional resources or data are available.
14. How can I stay updated on further developments or reports in the Oil & Gas Engineering Services Market?
To stay informed about further developments, trends, and reports in the Oil & Gas Engineering Services Market, consider subscribing to industry newsletters, following relevant companies and organizations, or regularly checking reputable industry news sources and publications.
Methodology
Step 1 - Identification of Relevant Samples Size from Population Database


Step 2 - Approaches for Defining Global Market Size (Value, Volume* & Price*)

Note*: In applicable scenarios
Step 3 - Data Sources
Primary Research
- Web Analytics
- Survey Reports
- Research Institute
- Latest Research Reports
- Opinion Leaders
Secondary Research
- Annual Reports
- White Paper
- Latest Press Release
- Industry Association
- Paid Database
- Investor Presentations

Step 4 - Data Triangulation
Involves using different sources of information in order to increase the validity of a study
These sources are likely to be stakeholders in a program - participants, other researchers, program staff, other community members, and so on.
Then we put all data in single framework & apply various statistical tools to find out the dynamic on the market.
During the analysis stage, feedback from the stakeholder groups would be compared to determine areas of agreement as well as areas of divergence
