

Key Insights
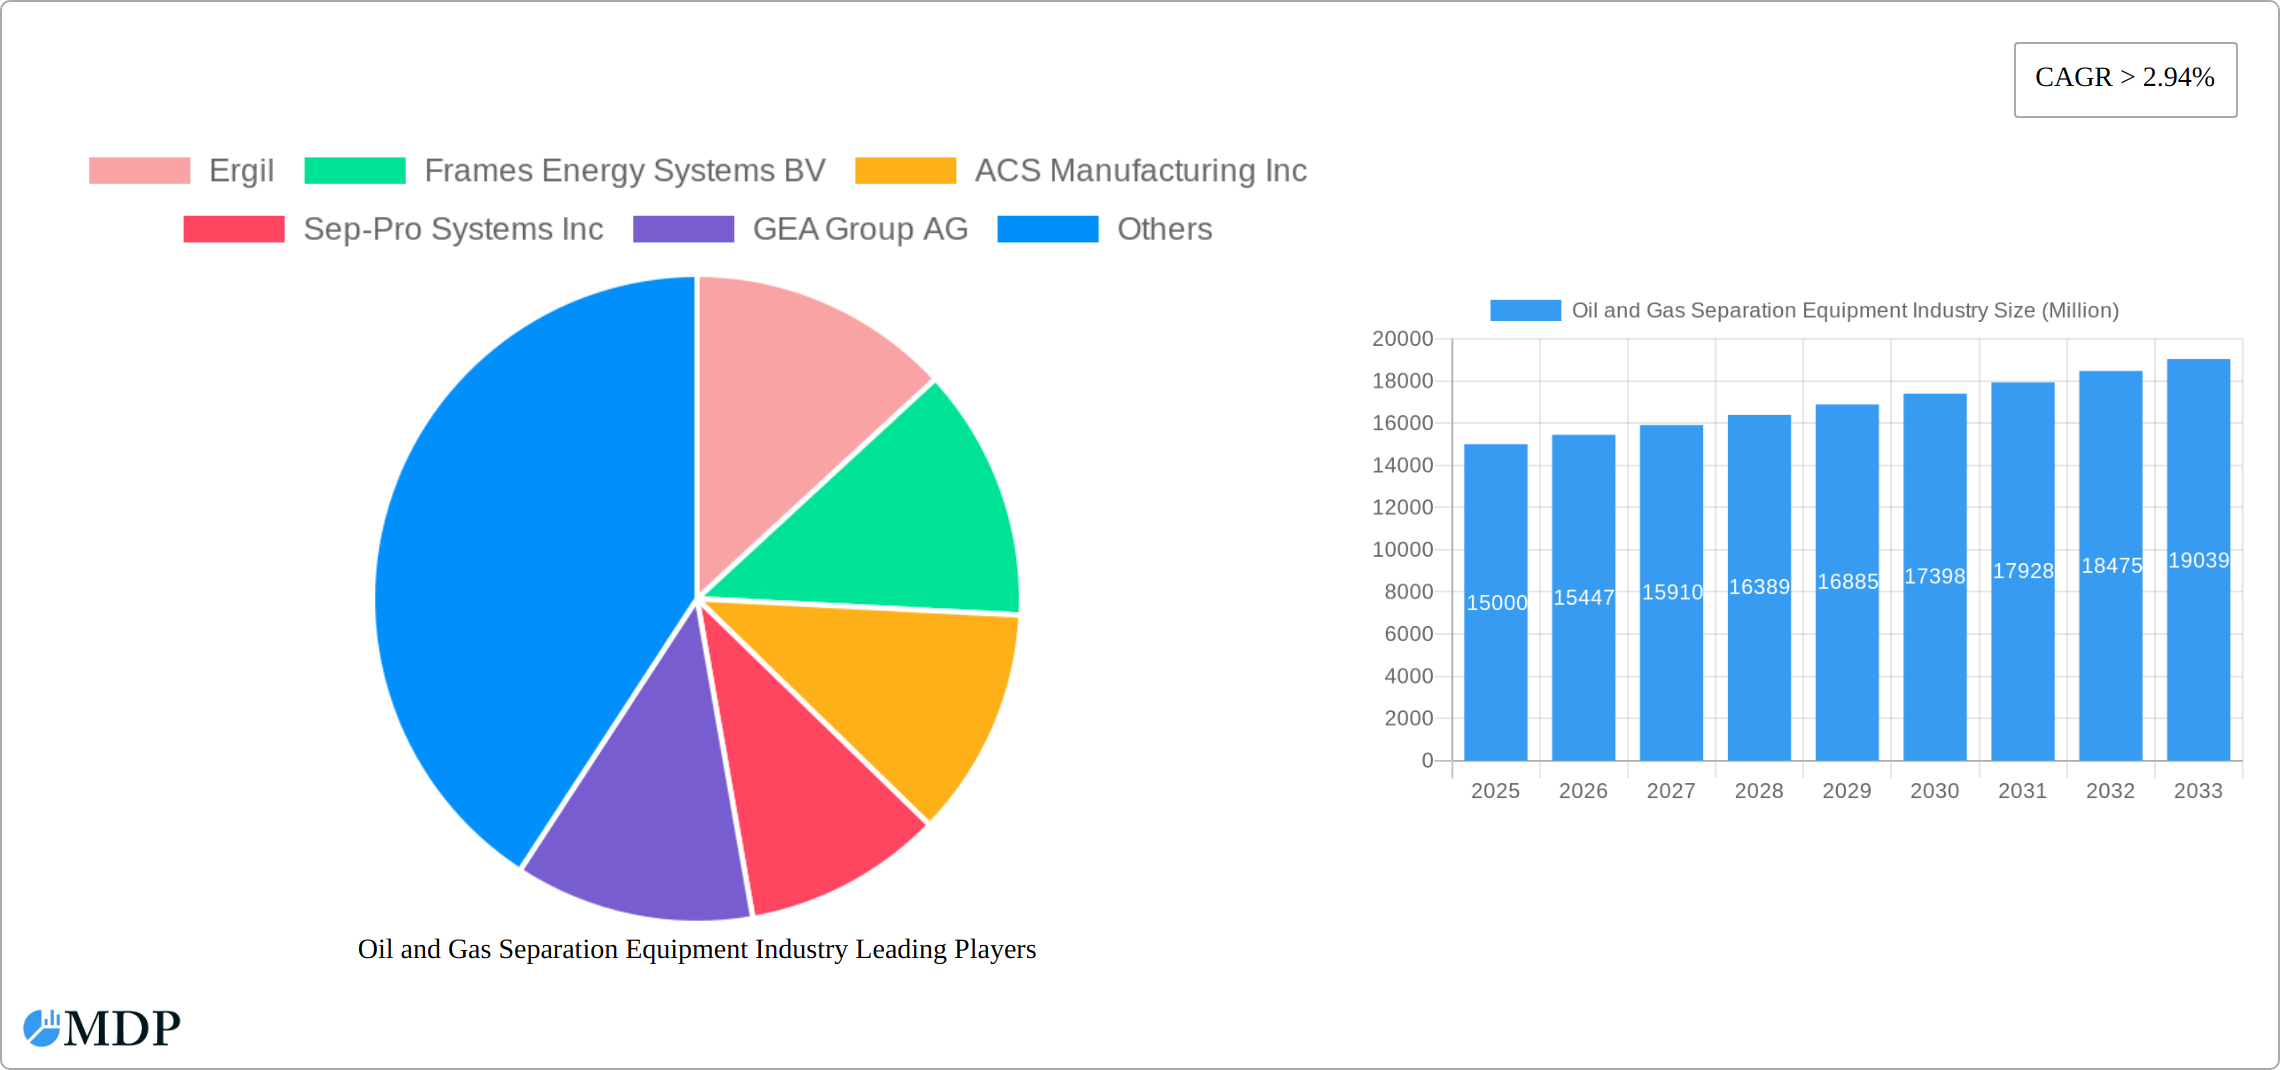
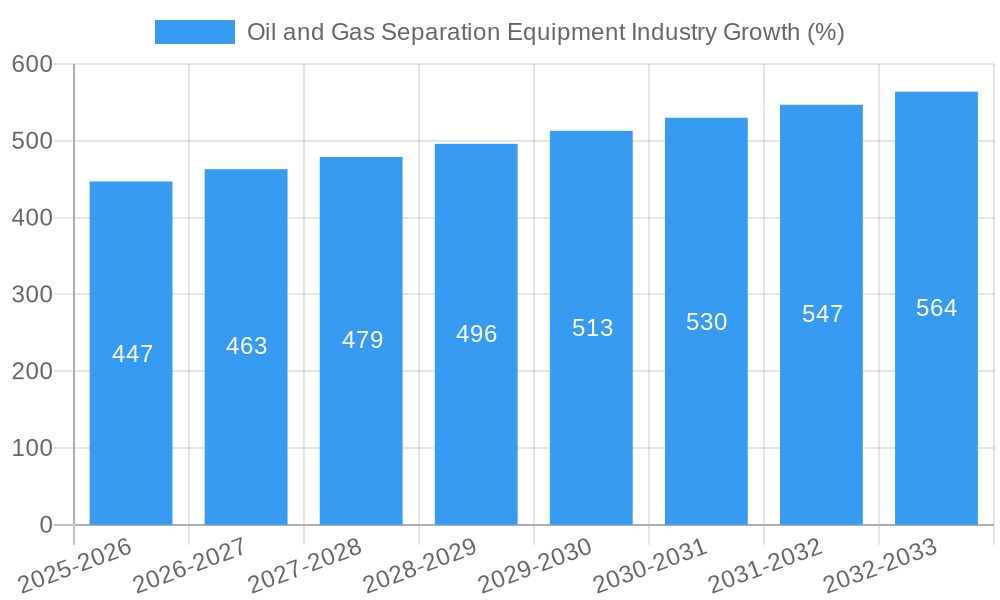
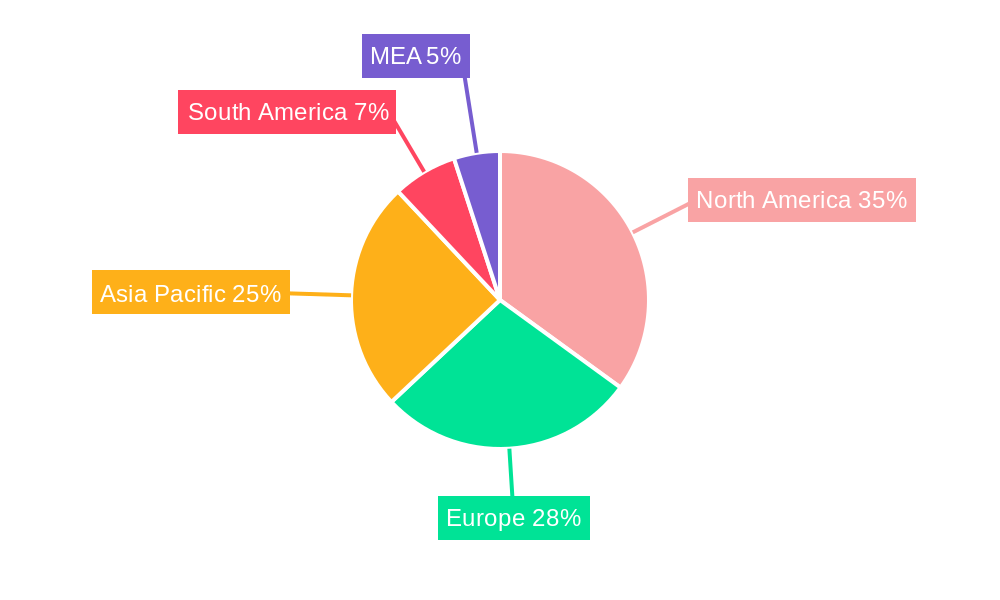
The Oil and Gas Separation Equipment market is experiencing robust growth, projected to maintain a CAGR exceeding 2.94% from 2025 to 2033. This expansion is driven by several key factors. Firstly, the increasing demand for oil and gas globally fuels the need for efficient separation technologies to process these resources effectively. Secondly, stringent environmental regulations are pushing the adoption of advanced separation equipment that minimizes emissions and waste. Technological advancements, particularly in the development of more efficient two-phase and three-phase separators, also contribute significantly to market growth. The market is segmented by area of application (upstream and downstream), vessel orientation (horizontal, vertical, spherical), and separator type (two-phase and three-phase). Upstream applications currently dominate, but downstream is showing accelerated growth due to increasing refinery capacity expansions and upgrades. Major players like Halliburton, Schlumberger, and GEA Group AG are driving innovation and consolidating their market share through mergers and acquisitions, technology enhancements, and geographical expansion. The geographical distribution shows significant market presence in North America and Europe, followed by the Asia-Pacific region, which is experiencing rapid growth due to the increasing oil and gas exploration and production activities. Competition is fierce, with companies focusing on differentiation through superior technology, service offerings, and regional focus.
The market's growth trajectory is also influenced by several restraints. Fluctuations in oil and gas prices create uncertainty in investment decisions. The high capital expenditure required for advanced separation equipment can be a barrier to entry for smaller companies. Furthermore, the complexities of integrating new technologies into existing infrastructure can pose challenges for some operators. However, the long-term outlook remains positive, driven by increasing energy demand and the imperative for cleaner energy production. The market is expected to witness a surge in the adoption of smart separation technologies integrated with data analytics and remote monitoring capabilities, enhancing efficiency and operational optimization. The continuous development of robust and environmentally friendly separation solutions will be crucial for sustained market expansion.
Oil & Gas Separation Equipment Market Report: 2019-2033
Dive deep into the dynamic world of oil and gas separation equipment with this comprehensive market analysis. This report provides a detailed examination of the global Oil & Gas Separation Equipment industry, offering actionable insights for stakeholders across the value chain. From market sizing and segmentation to competitive landscapes and future projections, this report is your essential guide to navigating this crucial sector. The study period covers 2019-2033, with 2025 serving as the base and estimated year. The forecast period spans 2025-2033, while the historical period encompasses 2019-2024.
Oil and Gas Separation Equipment Industry Market Dynamics & Concentration
The global oil and gas separation equipment market is characterized by moderate concentration, with several major players holding significant market share. The market size in 2025 is estimated at $XX Million. Key factors influencing market dynamics include continuous innovation in separation technologies, evolving regulatory landscapes focusing on environmental compliance, the emergence of substitute technologies (e.g., advanced membrane filtration), and shifting end-user preferences towards enhanced efficiency and reduced operational costs. Mergers and acquisitions (M&A) activity remains a significant driver of market consolidation. In the historical period (2019-2024), approximately XX M&A deals were recorded, resulting in a market share shift towards larger players.
- Market Concentration: Moderate, with the top 5 players accounting for approximately XX% of the market share in 2025.
- Innovation Drivers: Stringent emission regulations, demand for higher separation efficiency, and the need for cost optimization are driving innovation.
- Regulatory Frameworks: Government regulations related to environmental protection and safety standards significantly influence market dynamics.
- Product Substitutes: Advancements in membrane technology and other separation methods pose a potential threat to traditional equipment.
- End-User Trends: Growing emphasis on automation, digitalization, and remote operation is reshaping the market.
- M&A Activities: Consolidation through mergers and acquisitions is expected to continue shaping the competitive landscape.
Oil and Gas Separation Equipment Industry Industry Trends & Analysis
The oil and gas separation equipment market is experiencing robust growth, driven by several key factors. The increasing demand for oil and gas globally, coupled with ongoing exploration and production activities, especially in unconventional resources, is fueling market expansion. Technological advancements, such as improved automation and digitalization, enhance efficiency and reduce operational costs, creating further demand. Consumer preferences are shifting towards more sustainable and environmentally friendly solutions, leading to the adoption of improved separation technologies with lower emissions. The market is witnessing intense competition, characterized by pricing pressures and continuous innovation. The Compound Annual Growth Rate (CAGR) for the forecast period (2025-2033) is projected to be XX%, with market penetration reaching approximately XX% by 2033.
Leading Markets & Segments in Oil and Gas Separation Equipment Industry
The Upstream segment within the Area of Application dominates the market, driven by the significant investment in oil and gas exploration and production. Geographically, North America and the Middle East are leading regions, fueled by substantial oil and gas reserves and ongoing production expansions.
Key Drivers:
- Upstream: High investments in exploration and production, particularly in unconventional resources (shale gas, tight oil).
- Downstream: Growing demand for refined products and petrochemicals.
- Offshore: Increasing offshore exploration and production activities.
- Horizontal Separators: Wide applicability in various applications, including upstream and downstream processing.
- Two-phase Separators: Simple design and cost-effectiveness.
Dominance Analysis:
The upstream segment currently commands the largest market share due to higher investment in exploration and production. The North American market is leading due to significant shale gas production and refining capacity. Horizontal separators hold a significant market share due to their versatility. Two-phase separators are the most prevalent type, owing to their simpler design and lower cost.
Oil and Gas Separation Equipment Industry Product Developments
Recent product innovations focus on enhancing efficiency, reducing footprint, and improving environmental performance. New designs incorporate advanced materials, improved automation features, and sophisticated process control systems. These developments cater to the increasing demand for higher separation efficiency, reduced operational costs, and enhanced environmental compliance. Companies are also investing in the development of modular and customizable separation systems to meet the diverse needs of various applications.
Key Drivers of Oil and Gas Separation Equipment Growth
Several factors are driving the growth of the oil and gas separation equipment market. Technological advancements, such as the development of more efficient and compact separators, are enhancing operational efficiency and reducing costs. Government regulations promoting environmental protection are encouraging the adoption of cleaner technologies. The ever-increasing global demand for energy, particularly in developing economies, is further fueling market growth. The growing prevalence of offshore and unconventional oil and gas extraction is creating new opportunities for specialized equipment.
Challenges in the Oil and Gas Separation Equipment Industry Market
The industry faces challenges such as fluctuating oil and gas prices, which impact investment decisions. Supply chain disruptions can cause delays and increase costs. Stringent environmental regulations increase compliance costs. Intense competition from established and emerging players creates pricing pressures. These factors negatively influence profitability and market growth projections. For example, the recent supply chain bottlenecks are estimated to have impacted market growth by approximately XX Million in 2024.
Emerging Opportunities in Oil and Gas Separation Equipment Industry
Significant opportunities exist for companies that can develop and deploy innovative and sustainable solutions. The growing need for efficient and environmentally friendly separation technologies opens avenues for technological breakthroughs. Strategic partnerships to expand market reach and integrate solutions can offer significant growth potential. Entering new and emerging markets with robust growth projections will provide further expansion opportunities.
Leading Players in the Oil and Gas Separation Equipment Industry Sector
- Ergil
- Frames Energy Systems BV
- ACS Manufacturing Inc
- Sep-Pro Systems Inc
- GEA Group AG
- Halliburton Company
- Schlumberger Limited
- Pentair PLC
- Alfa Laval AB
Key Milestones in Oil and Gas Separation Equipment Industry Industry
- 2021: Introduction of a new high-efficiency three-phase separator by GEA Group AG.
- 2022: Merger between two major players in the horizontal separator market, leading to market consolidation.
- 2023: Launch of a new compact separator design by Schlumberger Limited, reducing operational footprint.
- 2024: Significant investments in R&D for improving efficiency and reducing environmental impact by various players.
Strategic Outlook for Oil and Gas Separation Equipment Market
The oil and gas separation equipment market is poised for continued growth, driven by technological innovation, increasing demand for energy, and stringent environmental regulations. Strategic partnerships, expansion into new markets, and a focus on sustainability will be crucial for companies to thrive. Opportunities exist for companies to develop innovative solutions that address the evolving needs of the oil and gas industry, paving the way for long-term market success and significant growth potential.
Oil and Gas Separation Equipment Industry Segmentation
-
1. Vessel Orientation
- 1.1. Horizontal Separator
- 1.2. Vertical Separator
- 1.3. Spherical Separator
-
2. Type
- 2.1. Two-phase Separator
- 2.2. Three-phase Separator
-
3. Area of Application
-
3.1. Upstream
- 3.1.1. Onshore
- 3.1.2. Offshore
- 3.2. Downstream
-
3.1. Upstream
Oil and Gas Separation Equipment Industry Segmentation By Geography
- 1. North America
- 2. Europe
- 3. Asia Pacific
- 4. South America
- 5. Middle East and Africa
Oil and Gas Separation Equipment Industry REPORT HIGHLIGHTS
| Aspects | Details |
|---|---|
| Study Period | 2019-2033 |
| Base Year | 2024 |
| Estimated Year | 2025 |
| Forecast Period | 2025-2033 |
| Historical Period | 2019-2024 |
| Growth Rate | CAGR of > 2.94% from 2019-2033 |
| Segmentation |
|
Table of Contents
- 1. Introduction
- 1.1. Research Scope
- 1.2. Market Segmentation
- 1.3. Research Methodology
- 1.4. Definitions and Assumptions
- 2. Executive Summary
- 2.1. Introduction
- 3. Market Dynamics
- 3.1. Introduction
- 3.2. Market Drivers
- 3.2.1. 4.; Increasing Industrialization across the World4.; Expansion and Development of New Power Plants
- 3.3. Market Restrains
- 3.3.1. 4.; Increasing Adoption of Renewable Energy
- 3.4. Market Trends
- 3.4.1. Upstream Sector to Dominate the Market
- 4. Market Factor Analysis
- 4.1. Porters Five Forces
- 4.2. Supply/Value Chain
- 4.3. PESTEL analysis
- 4.4. Market Entropy
- 4.5. Patent/Trademark Analysis
- 5. Global Oil and Gas Separation Equipment Industry Analysis, Insights and Forecast, 2019-2031
- 5.1. Market Analysis, Insights and Forecast - by Vessel Orientation
- 5.1.1. Horizontal Separator
- 5.1.2. Vertical Separator
- 5.1.3. Spherical Separator
- 5.2. Market Analysis, Insights and Forecast - by Type
- 5.2.1. Two-phase Separator
- 5.2.2. Three-phase Separator
- 5.3. Market Analysis, Insights and Forecast - by Area of Application
- 5.3.1. Upstream
- 5.3.1.1. Onshore
- 5.3.1.2. Offshore
- 5.3.2. Downstream
- 5.3.1. Upstream
- 5.4. Market Analysis, Insights and Forecast - by Region
- 5.4.1. North America
- 5.4.2. Europe
- 5.4.3. Asia Pacific
- 5.4.4. South America
- 5.4.5. Middle East and Africa
- 5.1. Market Analysis, Insights and Forecast - by Vessel Orientation
- 6. North America Oil and Gas Separation Equipment Industry Analysis, Insights and Forecast, 2019-2031
- 6.1. Market Analysis, Insights and Forecast - by Vessel Orientation
- 6.1.1. Horizontal Separator
- 6.1.2. Vertical Separator
- 6.1.3. Spherical Separator
- 6.2. Market Analysis, Insights and Forecast - by Type
- 6.2.1. Two-phase Separator
- 6.2.2. Three-phase Separator
- 6.3. Market Analysis, Insights and Forecast - by Area of Application
- 6.3.1. Upstream
- 6.3.1.1. Onshore
- 6.3.1.2. Offshore
- 6.3.2. Downstream
- 6.3.1. Upstream
- 6.1. Market Analysis, Insights and Forecast - by Vessel Orientation
- 7. Europe Oil and Gas Separation Equipment Industry Analysis, Insights and Forecast, 2019-2031
- 7.1. Market Analysis, Insights and Forecast - by Vessel Orientation
- 7.1.1. Horizontal Separator
- 7.1.2. Vertical Separator
- 7.1.3. Spherical Separator
- 7.2. Market Analysis, Insights and Forecast - by Type
- 7.2.1. Two-phase Separator
- 7.2.2. Three-phase Separator
- 7.3. Market Analysis, Insights and Forecast - by Area of Application
- 7.3.1. Upstream
- 7.3.1.1. Onshore
- 7.3.1.2. Offshore
- 7.3.2. Downstream
- 7.3.1. Upstream
- 7.1. Market Analysis, Insights and Forecast - by Vessel Orientation
- 8. Asia Pacific Oil and Gas Separation Equipment Industry Analysis, Insights and Forecast, 2019-2031
- 8.1. Market Analysis, Insights and Forecast - by Vessel Orientation
- 8.1.1. Horizontal Separator
- 8.1.2. Vertical Separator
- 8.1.3. Spherical Separator
- 8.2. Market Analysis, Insights and Forecast - by Type
- 8.2.1. Two-phase Separator
- 8.2.2. Three-phase Separator
- 8.3. Market Analysis, Insights and Forecast - by Area of Application
- 8.3.1. Upstream
- 8.3.1.1. Onshore
- 8.3.1.2. Offshore
- 8.3.2. Downstream
- 8.3.1. Upstream
- 8.1. Market Analysis, Insights and Forecast - by Vessel Orientation
- 9. South America Oil and Gas Separation Equipment Industry Analysis, Insights and Forecast, 2019-2031
- 9.1. Market Analysis, Insights and Forecast - by Vessel Orientation
- 9.1.1. Horizontal Separator
- 9.1.2. Vertical Separator
- 9.1.3. Spherical Separator
- 9.2. Market Analysis, Insights and Forecast - by Type
- 9.2.1. Two-phase Separator
- 9.2.2. Three-phase Separator
- 9.3. Market Analysis, Insights and Forecast - by Area of Application
- 9.3.1. Upstream
- 9.3.1.1. Onshore
- 9.3.1.2. Offshore
- 9.3.2. Downstream
- 9.3.1. Upstream
- 9.1. Market Analysis, Insights and Forecast - by Vessel Orientation
- 10. Middle East and Africa Oil and Gas Separation Equipment Industry Analysis, Insights and Forecast, 2019-2031
- 10.1. Market Analysis, Insights and Forecast - by Vessel Orientation
- 10.1.1. Horizontal Separator
- 10.1.2. Vertical Separator
- 10.1.3. Spherical Separator
- 10.2. Market Analysis, Insights and Forecast - by Type
- 10.2.1. Two-phase Separator
- 10.2.2. Three-phase Separator
- 10.3. Market Analysis, Insights and Forecast - by Area of Application
- 10.3.1. Upstream
- 10.3.1.1. Onshore
- 10.3.1.2. Offshore
- 10.3.2. Downstream
- 10.3.1. Upstream
- 10.1. Market Analysis, Insights and Forecast - by Vessel Orientation
- 11. North America Oil and Gas Separation Equipment Industry Analysis, Insights and Forecast, 2019-2031
- 11.1. Market Analysis, Insights and Forecast - By Country/Sub-region
- 11.1.1 United States
- 11.1.2 Canada
- 11.1.3 Mexico
- 12. Europe Oil and Gas Separation Equipment Industry Analysis, Insights and Forecast, 2019-2031
- 12.1. Market Analysis, Insights and Forecast - By Country/Sub-region
- 12.1.1 Germany
- 12.1.2 United Kingdom
- 12.1.3 France
- 12.1.4 Spain
- 12.1.5 Italy
- 12.1.6 Spain
- 12.1.7 Belgium
- 12.1.8 Netherland
- 12.1.9 Nordics
- 12.1.10 Rest of Europe
- 13. Asia Pacific Oil and Gas Separation Equipment Industry Analysis, Insights and Forecast, 2019-2031
- 13.1. Market Analysis, Insights and Forecast - By Country/Sub-region
- 13.1.1 China
- 13.1.2 Japan
- 13.1.3 India
- 13.1.4 South Korea
- 13.1.5 Southeast Asia
- 13.1.6 Australia
- 13.1.7 Indonesia
- 13.1.8 Phillipes
- 13.1.9 Singapore
- 13.1.10 Thailandc
- 13.1.11 Rest of Asia Pacific
- 14. South America Oil and Gas Separation Equipment Industry Analysis, Insights and Forecast, 2019-2031
- 14.1. Market Analysis, Insights and Forecast - By Country/Sub-region
- 14.1.1 Brazil
- 14.1.2 Argentina
- 14.1.3 Peru
- 14.1.4 Chile
- 14.1.5 Colombia
- 14.1.6 Ecuador
- 14.1.7 Venezuela
- 14.1.8 Rest of South America
- 15. North America Oil and Gas Separation Equipment Industry Analysis, Insights and Forecast, 2019-2031
- 15.1. Market Analysis, Insights and Forecast - By Country/Sub-region
- 15.1.1 United States
- 15.1.2 Canada
- 15.1.3 Mexico
- 16. MEA Oil and Gas Separation Equipment Industry Analysis, Insights and Forecast, 2019-2031
- 16.1. Market Analysis, Insights and Forecast - By Country/Sub-region
- 16.1.1 United Arab Emirates
- 16.1.2 Saudi Arabia
- 16.1.3 South Africa
- 16.1.4 Rest of Middle East and Africa
- 17. Competitive Analysis
- 17.1. Global Market Share Analysis 2024
- 17.2. Company Profiles
- 17.2.1 Ergil
- 17.2.1.1. Overview
- 17.2.1.2. Products
- 17.2.1.3. SWOT Analysis
- 17.2.1.4. Recent Developments
- 17.2.1.5. Financials (Based on Availability)
- 17.2.2 Frames Energy Systems BV
- 17.2.2.1. Overview
- 17.2.2.2. Products
- 17.2.2.3. SWOT Analysis
- 17.2.2.4. Recent Developments
- 17.2.2.5. Financials (Based on Availability)
- 17.2.3 ACS Manufacturing Inc
- 17.2.3.1. Overview
- 17.2.3.2. Products
- 17.2.3.3. SWOT Analysis
- 17.2.3.4. Recent Developments
- 17.2.3.5. Financials (Based on Availability)
- 17.2.4 Sep-Pro Systems Inc
- 17.2.4.1. Overview
- 17.2.4.2. Products
- 17.2.4.3. SWOT Analysis
- 17.2.4.4. Recent Developments
- 17.2.4.5. Financials (Based on Availability)
- 17.2.5 GEA Group AG
- 17.2.5.1. Overview
- 17.2.5.2. Products
- 17.2.5.3. SWOT Analysis
- 17.2.5.4. Recent Developments
- 17.2.5.5. Financials (Based on Availability)
- 17.2.6 Halliburton Company*List Not Exhaustive
- 17.2.6.1. Overview
- 17.2.6.2. Products
- 17.2.6.3. SWOT Analysis
- 17.2.6.4. Recent Developments
- 17.2.6.5. Financials (Based on Availability)
- 17.2.7 Schlumberger Limited
- 17.2.7.1. Overview
- 17.2.7.2. Products
- 17.2.7.3. SWOT Analysis
- 17.2.7.4. Recent Developments
- 17.2.7.5. Financials (Based on Availability)
- 17.2.8 Pentair PLC
- 17.2.8.1. Overview
- 17.2.8.2. Products
- 17.2.8.3. SWOT Analysis
- 17.2.8.4. Recent Developments
- 17.2.8.5. Financials (Based on Availability)
- 17.2.9 Alfa Laval AB
- 17.2.9.1. Overview
- 17.2.9.2. Products
- 17.2.9.3. SWOT Analysis
- 17.2.9.4. Recent Developments
- 17.2.9.5. Financials (Based on Availability)
- 17.2.1 Ergil
List of Figures
- Figure 1: Global Oil and Gas Separation Equipment Industry Revenue Breakdown (Million, %) by Region 2024 & 2032
- Figure 2: North America Oil and Gas Separation Equipment Industry Revenue (Million), by Country 2024 & 2032
- Figure 3: North America Oil and Gas Separation Equipment Industry Revenue Share (%), by Country 2024 & 2032
- Figure 4: Europe Oil and Gas Separation Equipment Industry Revenue (Million), by Country 2024 & 2032
- Figure 5: Europe Oil and Gas Separation Equipment Industry Revenue Share (%), by Country 2024 & 2032
- Figure 6: Asia Pacific Oil and Gas Separation Equipment Industry Revenue (Million), by Country 2024 & 2032
- Figure 7: Asia Pacific Oil and Gas Separation Equipment Industry Revenue Share (%), by Country 2024 & 2032
- Figure 8: South America Oil and Gas Separation Equipment Industry Revenue (Million), by Country 2024 & 2032
- Figure 9: South America Oil and Gas Separation Equipment Industry Revenue Share (%), by Country 2024 & 2032
- Figure 10: North America Oil and Gas Separation Equipment Industry Revenue (Million), by Country 2024 & 2032
- Figure 11: North America Oil and Gas Separation Equipment Industry Revenue Share (%), by Country 2024 & 2032
- Figure 12: MEA Oil and Gas Separation Equipment Industry Revenue (Million), by Country 2024 & 2032
- Figure 13: MEA Oil and Gas Separation Equipment Industry Revenue Share (%), by Country 2024 & 2032
- Figure 14: North America Oil and Gas Separation Equipment Industry Revenue (Million), by Vessel Orientation 2024 & 2032
- Figure 15: North America Oil and Gas Separation Equipment Industry Revenue Share (%), by Vessel Orientation 2024 & 2032
- Figure 16: North America Oil and Gas Separation Equipment Industry Revenue (Million), by Type 2024 & 2032
- Figure 17: North America Oil and Gas Separation Equipment Industry Revenue Share (%), by Type 2024 & 2032
- Figure 18: North America Oil and Gas Separation Equipment Industry Revenue (Million), by Area of Application 2024 & 2032
- Figure 19: North America Oil and Gas Separation Equipment Industry Revenue Share (%), by Area of Application 2024 & 2032
- Figure 20: North America Oil and Gas Separation Equipment Industry Revenue (Million), by Country 2024 & 2032
- Figure 21: North America Oil and Gas Separation Equipment Industry Revenue Share (%), by Country 2024 & 2032
- Figure 22: Europe Oil and Gas Separation Equipment Industry Revenue (Million), by Vessel Orientation 2024 & 2032
- Figure 23: Europe Oil and Gas Separation Equipment Industry Revenue Share (%), by Vessel Orientation 2024 & 2032
- Figure 24: Europe Oil and Gas Separation Equipment Industry Revenue (Million), by Type 2024 & 2032
- Figure 25: Europe Oil and Gas Separation Equipment Industry Revenue Share (%), by Type 2024 & 2032
- Figure 26: Europe Oil and Gas Separation Equipment Industry Revenue (Million), by Area of Application 2024 & 2032
- Figure 27: Europe Oil and Gas Separation Equipment Industry Revenue Share (%), by Area of Application 2024 & 2032
- Figure 28: Europe Oil and Gas Separation Equipment Industry Revenue (Million), by Country 2024 & 2032
- Figure 29: Europe Oil and Gas Separation Equipment Industry Revenue Share (%), by Country 2024 & 2032
- Figure 30: Asia Pacific Oil and Gas Separation Equipment Industry Revenue (Million), by Vessel Orientation 2024 & 2032
- Figure 31: Asia Pacific Oil and Gas Separation Equipment Industry Revenue Share (%), by Vessel Orientation 2024 & 2032
- Figure 32: Asia Pacific Oil and Gas Separation Equipment Industry Revenue (Million), by Type 2024 & 2032
- Figure 33: Asia Pacific Oil and Gas Separation Equipment Industry Revenue Share (%), by Type 2024 & 2032
- Figure 34: Asia Pacific Oil and Gas Separation Equipment Industry Revenue (Million), by Area of Application 2024 & 2032
- Figure 35: Asia Pacific Oil and Gas Separation Equipment Industry Revenue Share (%), by Area of Application 2024 & 2032
- Figure 36: Asia Pacific Oil and Gas Separation Equipment Industry Revenue (Million), by Country 2024 & 2032
- Figure 37: Asia Pacific Oil and Gas Separation Equipment Industry Revenue Share (%), by Country 2024 & 2032
- Figure 38: South America Oil and Gas Separation Equipment Industry Revenue (Million), by Vessel Orientation 2024 & 2032
- Figure 39: South America Oil and Gas Separation Equipment Industry Revenue Share (%), by Vessel Orientation 2024 & 2032
- Figure 40: South America Oil and Gas Separation Equipment Industry Revenue (Million), by Type 2024 & 2032
- Figure 41: South America Oil and Gas Separation Equipment Industry Revenue Share (%), by Type 2024 & 2032
- Figure 42: South America Oil and Gas Separation Equipment Industry Revenue (Million), by Area of Application 2024 & 2032
- Figure 43: South America Oil and Gas Separation Equipment Industry Revenue Share (%), by Area of Application 2024 & 2032
- Figure 44: South America Oil and Gas Separation Equipment Industry Revenue (Million), by Country 2024 & 2032
- Figure 45: South America Oil and Gas Separation Equipment Industry Revenue Share (%), by Country 2024 & 2032
- Figure 46: Middle East and Africa Oil and Gas Separation Equipment Industry Revenue (Million), by Vessel Orientation 2024 & 2032
- Figure 47: Middle East and Africa Oil and Gas Separation Equipment Industry Revenue Share (%), by Vessel Orientation 2024 & 2032
- Figure 48: Middle East and Africa Oil and Gas Separation Equipment Industry Revenue (Million), by Type 2024 & 2032
- Figure 49: Middle East and Africa Oil and Gas Separation Equipment Industry Revenue Share (%), by Type 2024 & 2032
- Figure 50: Middle East and Africa Oil and Gas Separation Equipment Industry Revenue (Million), by Area of Application 2024 & 2032
- Figure 51: Middle East and Africa Oil and Gas Separation Equipment Industry Revenue Share (%), by Area of Application 2024 & 2032
- Figure 52: Middle East and Africa Oil and Gas Separation Equipment Industry Revenue (Million), by Country 2024 & 2032
- Figure 53: Middle East and Africa Oil and Gas Separation Equipment Industry Revenue Share (%), by Country 2024 & 2032
List of Tables
- Table 1: Global Oil and Gas Separation Equipment Industry Revenue Million Forecast, by Region 2019 & 2032
- Table 2: Global Oil and Gas Separation Equipment Industry Revenue Million Forecast, by Vessel Orientation 2019 & 2032
- Table 3: Global Oil and Gas Separation Equipment Industry Revenue Million Forecast, by Type 2019 & 2032
- Table 4: Global Oil and Gas Separation Equipment Industry Revenue Million Forecast, by Area of Application 2019 & 2032
- Table 5: Global Oil and Gas Separation Equipment Industry Revenue Million Forecast, by Region 2019 & 2032
- Table 6: Global Oil and Gas Separation Equipment Industry Revenue Million Forecast, by Country 2019 & 2032
- Table 7: United States Oil and Gas Separation Equipment Industry Revenue (Million) Forecast, by Application 2019 & 2032
- Table 8: Canada Oil and Gas Separation Equipment Industry Revenue (Million) Forecast, by Application 2019 & 2032
- Table 9: Mexico Oil and Gas Separation Equipment Industry Revenue (Million) Forecast, by Application 2019 & 2032
- Table 10: Global Oil and Gas Separation Equipment Industry Revenue Million Forecast, by Country 2019 & 2032
- Table 11: Germany Oil and Gas Separation Equipment Industry Revenue (Million) Forecast, by Application 2019 & 2032
- Table 12: United Kingdom Oil and Gas Separation Equipment Industry Revenue (Million) Forecast, by Application 2019 & 2032
- Table 13: France Oil and Gas Separation Equipment Industry Revenue (Million) Forecast, by Application 2019 & 2032
- Table 14: Spain Oil and Gas Separation Equipment Industry Revenue (Million) Forecast, by Application 2019 & 2032
- Table 15: Italy Oil and Gas Separation Equipment Industry Revenue (Million) Forecast, by Application 2019 & 2032
- Table 16: Spain Oil and Gas Separation Equipment Industry Revenue (Million) Forecast, by Application 2019 & 2032
- Table 17: Belgium Oil and Gas Separation Equipment Industry Revenue (Million) Forecast, by Application 2019 & 2032
- Table 18: Netherland Oil and Gas Separation Equipment Industry Revenue (Million) Forecast, by Application 2019 & 2032
- Table 19: Nordics Oil and Gas Separation Equipment Industry Revenue (Million) Forecast, by Application 2019 & 2032
- Table 20: Rest of Europe Oil and Gas Separation Equipment Industry Revenue (Million) Forecast, by Application 2019 & 2032
- Table 21: Global Oil and Gas Separation Equipment Industry Revenue Million Forecast, by Country 2019 & 2032
- Table 22: China Oil and Gas Separation Equipment Industry Revenue (Million) Forecast, by Application 2019 & 2032
- Table 23: Japan Oil and Gas Separation Equipment Industry Revenue (Million) Forecast, by Application 2019 & 2032
- Table 24: India Oil and Gas Separation Equipment Industry Revenue (Million) Forecast, by Application 2019 & 2032
- Table 25: South Korea Oil and Gas Separation Equipment Industry Revenue (Million) Forecast, by Application 2019 & 2032
- Table 26: Southeast Asia Oil and Gas Separation Equipment Industry Revenue (Million) Forecast, by Application 2019 & 2032
- Table 27: Australia Oil and Gas Separation Equipment Industry Revenue (Million) Forecast, by Application 2019 & 2032
- Table 28: Indonesia Oil and Gas Separation Equipment Industry Revenue (Million) Forecast, by Application 2019 & 2032
- Table 29: Phillipes Oil and Gas Separation Equipment Industry Revenue (Million) Forecast, by Application 2019 & 2032
- Table 30: Singapore Oil and Gas Separation Equipment Industry Revenue (Million) Forecast, by Application 2019 & 2032
- Table 31: Thailandc Oil and Gas Separation Equipment Industry Revenue (Million) Forecast, by Application 2019 & 2032
- Table 32: Rest of Asia Pacific Oil and Gas Separation Equipment Industry Revenue (Million) Forecast, by Application 2019 & 2032
- Table 33: Global Oil and Gas Separation Equipment Industry Revenue Million Forecast, by Country 2019 & 2032
- Table 34: Brazil Oil and Gas Separation Equipment Industry Revenue (Million) Forecast, by Application 2019 & 2032
- Table 35: Argentina Oil and Gas Separation Equipment Industry Revenue (Million) Forecast, by Application 2019 & 2032
- Table 36: Peru Oil and Gas Separation Equipment Industry Revenue (Million) Forecast, by Application 2019 & 2032
- Table 37: Chile Oil and Gas Separation Equipment Industry Revenue (Million) Forecast, by Application 2019 & 2032
- Table 38: Colombia Oil and Gas Separation Equipment Industry Revenue (Million) Forecast, by Application 2019 & 2032
- Table 39: Ecuador Oil and Gas Separation Equipment Industry Revenue (Million) Forecast, by Application 2019 & 2032
- Table 40: Venezuela Oil and Gas Separation Equipment Industry Revenue (Million) Forecast, by Application 2019 & 2032
- Table 41: Rest of South America Oil and Gas Separation Equipment Industry Revenue (Million) Forecast, by Application 2019 & 2032
- Table 42: Global Oil and Gas Separation Equipment Industry Revenue Million Forecast, by Country 2019 & 2032
- Table 43: United States Oil and Gas Separation Equipment Industry Revenue (Million) Forecast, by Application 2019 & 2032
- Table 44: Canada Oil and Gas Separation Equipment Industry Revenue (Million) Forecast, by Application 2019 & 2032
- Table 45: Mexico Oil and Gas Separation Equipment Industry Revenue (Million) Forecast, by Application 2019 & 2032
- Table 46: Global Oil and Gas Separation Equipment Industry Revenue Million Forecast, by Country 2019 & 2032
- Table 47: United Arab Emirates Oil and Gas Separation Equipment Industry Revenue (Million) Forecast, by Application 2019 & 2032
- Table 48: Saudi Arabia Oil and Gas Separation Equipment Industry Revenue (Million) Forecast, by Application 2019 & 2032
- Table 49: South Africa Oil and Gas Separation Equipment Industry Revenue (Million) Forecast, by Application 2019 & 2032
- Table 50: Rest of Middle East and Africa Oil and Gas Separation Equipment Industry Revenue (Million) Forecast, by Application 2019 & 2032
- Table 51: Global Oil and Gas Separation Equipment Industry Revenue Million Forecast, by Vessel Orientation 2019 & 2032
- Table 52: Global Oil and Gas Separation Equipment Industry Revenue Million Forecast, by Type 2019 & 2032
- Table 53: Global Oil and Gas Separation Equipment Industry Revenue Million Forecast, by Area of Application 2019 & 2032
- Table 54: Global Oil and Gas Separation Equipment Industry Revenue Million Forecast, by Country 2019 & 2032
- Table 55: Global Oil and Gas Separation Equipment Industry Revenue Million Forecast, by Vessel Orientation 2019 & 2032
- Table 56: Global Oil and Gas Separation Equipment Industry Revenue Million Forecast, by Type 2019 & 2032
- Table 57: Global Oil and Gas Separation Equipment Industry Revenue Million Forecast, by Area of Application 2019 & 2032
- Table 58: Global Oil and Gas Separation Equipment Industry Revenue Million Forecast, by Country 2019 & 2032
- Table 59: Global Oil and Gas Separation Equipment Industry Revenue Million Forecast, by Vessel Orientation 2019 & 2032
- Table 60: Global Oil and Gas Separation Equipment Industry Revenue Million Forecast, by Type 2019 & 2032
- Table 61: Global Oil and Gas Separation Equipment Industry Revenue Million Forecast, by Area of Application 2019 & 2032
- Table 62: Global Oil and Gas Separation Equipment Industry Revenue Million Forecast, by Country 2019 & 2032
- Table 63: Global Oil and Gas Separation Equipment Industry Revenue Million Forecast, by Vessel Orientation 2019 & 2032
- Table 64: Global Oil and Gas Separation Equipment Industry Revenue Million Forecast, by Type 2019 & 2032
- Table 65: Global Oil and Gas Separation Equipment Industry Revenue Million Forecast, by Area of Application 2019 & 2032
- Table 66: Global Oil and Gas Separation Equipment Industry Revenue Million Forecast, by Country 2019 & 2032
- Table 67: Global Oil and Gas Separation Equipment Industry Revenue Million Forecast, by Vessel Orientation 2019 & 2032
- Table 68: Global Oil and Gas Separation Equipment Industry Revenue Million Forecast, by Type 2019 & 2032
- Table 69: Global Oil and Gas Separation Equipment Industry Revenue Million Forecast, by Area of Application 2019 & 2032
- Table 70: Global Oil and Gas Separation Equipment Industry Revenue Million Forecast, by Country 2019 & 2032
Frequently Asked Questions
1. What is the projected Compound Annual Growth Rate (CAGR) of the Oil and Gas Separation Equipment Industry?
The projected CAGR is approximately > 2.94%.
2. Which companies are prominent players in the Oil and Gas Separation Equipment Industry?
Key companies in the market include Ergil, Frames Energy Systems BV, ACS Manufacturing Inc, Sep-Pro Systems Inc, GEA Group AG, Halliburton Company*List Not Exhaustive, Schlumberger Limited, Pentair PLC, Alfa Laval AB.
3. What are the main segments of the Oil and Gas Separation Equipment Industry?
The market segments include Vessel Orientation, Type, Area of Application.
4. Can you provide details about the market size?
The market size is estimated to be USD XX Million as of 2022.
5. What are some drivers contributing to market growth?
4.; Increasing Industrialization across the World4.; Expansion and Development of New Power Plants.
6. What are the notable trends driving market growth?
Upstream Sector to Dominate the Market.
7. Are there any restraints impacting market growth?
4.; Increasing Adoption of Renewable Energy.
8. Can you provide examples of recent developments in the market?
N/A
9. What pricing options are available for accessing the report?
Pricing options include single-user, multi-user, and enterprise licenses priced at USD 4750, USD 5250, and USD 8750 respectively.
10. Is the market size provided in terms of value or volume?
The market size is provided in terms of value, measured in Million.
11. Are there any specific market keywords associated with the report?
Yes, the market keyword associated with the report is "Oil and Gas Separation Equipment Industry," which aids in identifying and referencing the specific market segment covered.
12. How do I determine which pricing option suits my needs best?
The pricing options vary based on user requirements and access needs. Individual users may opt for single-user licenses, while businesses requiring broader access may choose multi-user or enterprise licenses for cost-effective access to the report.
13. Are there any additional resources or data provided in the Oil and Gas Separation Equipment Industry report?
While the report offers comprehensive insights, it's advisable to review the specific contents or supplementary materials provided to ascertain if additional resources or data are available.
14. How can I stay updated on further developments or reports in the Oil and Gas Separation Equipment Industry?
To stay informed about further developments, trends, and reports in the Oil and Gas Separation Equipment Industry, consider subscribing to industry newsletters, following relevant companies and organizations, or regularly checking reputable industry news sources and publications.
Methodology
Step 1 - Identification of Relevant Samples Size from Population Database


Step 2 - Approaches for Defining Global Market Size (Value, Volume* & Price*)

Note*: In applicable scenarios
Step 3 - Data Sources
Primary Research
- Web Analytics
- Survey Reports
- Research Institute
- Latest Research Reports
- Opinion Leaders
Secondary Research
- Annual Reports
- White Paper
- Latest Press Release
- Industry Association
- Paid Database
- Investor Presentations

Step 4 - Data Triangulation
Involves using different sources of information in order to increase the validity of a study
These sources are likely to be stakeholders in a program - participants, other researchers, program staff, other community members, and so on.
Then we put all data in single framework & apply various statistical tools to find out the dynamic on the market.
During the analysis stage, feedback from the stakeholder groups would be compared to determine areas of agreement as well as areas of divergence
