

Key Insights
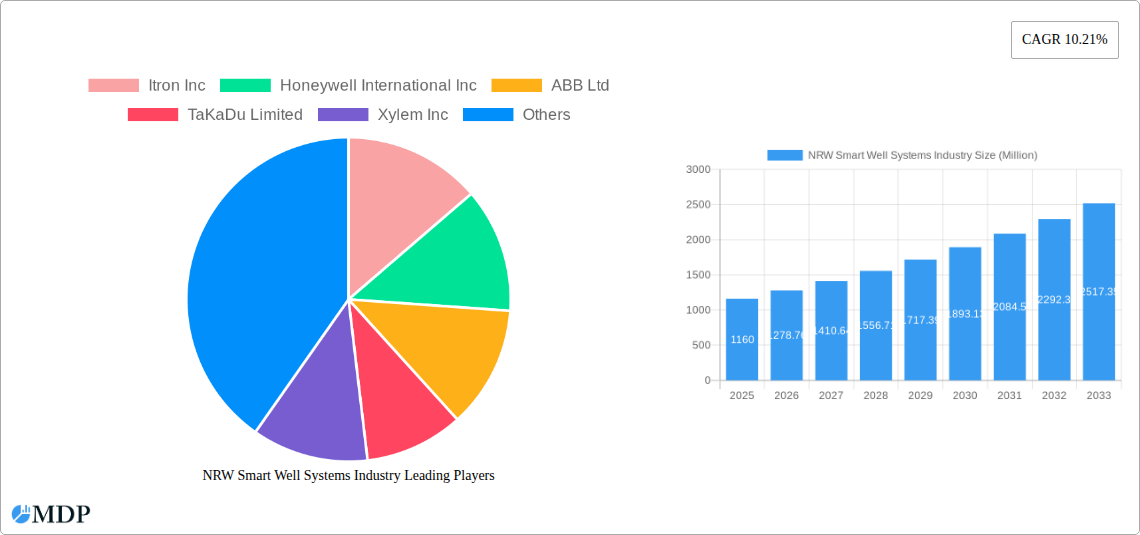
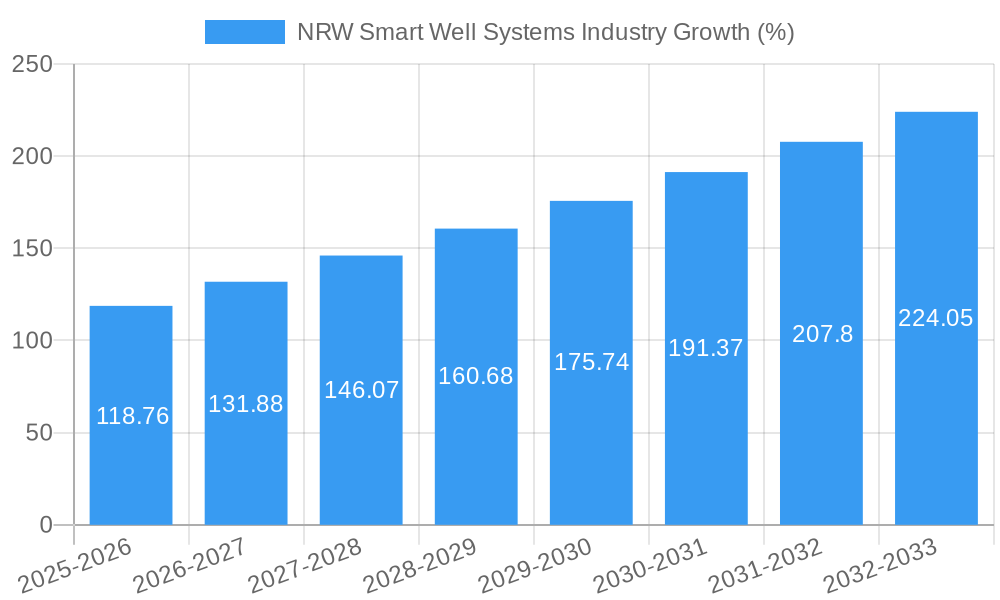
The Non-Revenue Water (NRW) Smart Well Systems market is experiencing robust growth, projected to reach a market size of $1.16 billion by 2025 and exhibiting a Compound Annual Growth Rate (CAGR) of 10.21% from 2025 to 2033. This expansion is driven by several key factors. Firstly, increasing urbanization and industrialization lead to higher water demand, necessitating efficient water management solutions to minimize NRW losses. Secondly, stringent government regulations and increasing water scarcity across various regions are pushing water utilities to adopt advanced technologies like smart well systems for leak detection and prevention. The rising adoption of smart meters and the integration of data analytics further enhances the efficacy of these systems, enabling proactive maintenance and reducing operational costs. Technological advancements in acoustic sensors, both invasive and non-invasive, combined with sophisticated software and data analytics platforms, are playing a significant role in improving the accuracy and speed of leak detection and repair. The market is segmented by technology (acoustic sensors, leak detection technologies) and solution type (software and data analytics platforms), with a preference towards non-invasive technologies due to their reduced disruption and cost-effectiveness. Competition among key players like Itron Inc, Honeywell International Inc, and ABB Ltd, among others, is fostering innovation and driving market penetration.
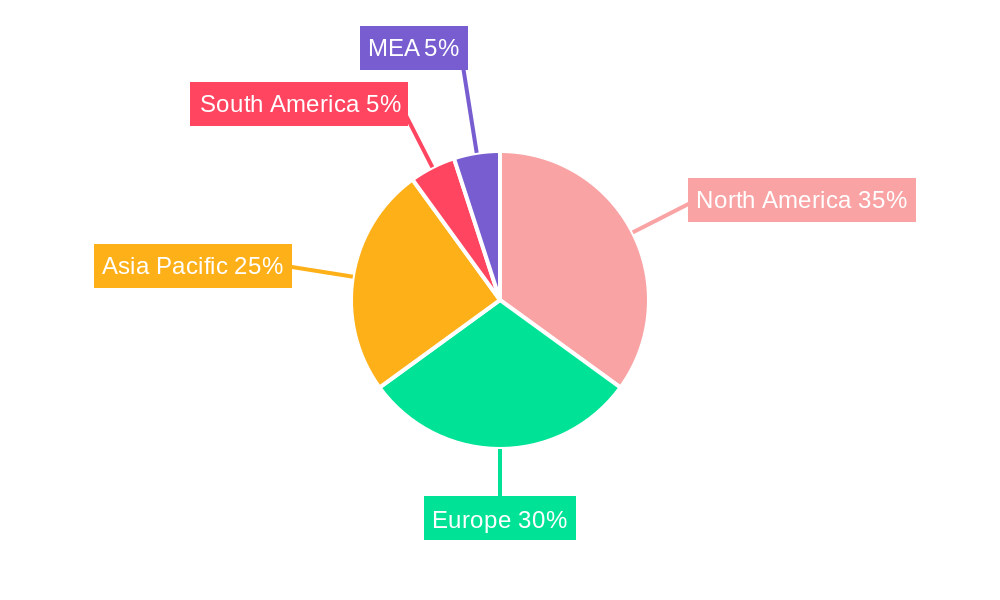
Geographically, North America and Europe currently hold a significant share of the market, driven by early adoption of smart technologies and robust water infrastructure. However, the Asia-Pacific region is anticipated to witness substantial growth in the coming years due to rapid urbanization and rising investment in water infrastructure development. The market's growth is also influenced by factors such as the initial investment cost of implementing smart well systems and the complexities involved in integrating these systems with existing water infrastructure. Despite these restraints, the long-term benefits of reduced water loss, improved operational efficiency, and enhanced water security are expected to outweigh the initial challenges, fueling continued market expansion throughout the forecast period.
NRW Smart Well Systems Industry Market Report: 2019-2033
This comprehensive report provides a detailed analysis of the NRW Smart Well Systems industry, offering invaluable insights for stakeholders seeking to navigate this dynamic market. With a study period spanning 2019-2033, a base year of 2025, and a forecast period of 2025-2033, this report is your essential guide to understanding current trends and future potential. The report incorporates extensive market data, analysis of leading players like Itron Inc, Honeywell International Inc, ABB Ltd, and others, and forecasts valuing the market in Millions.
NRW Smart Well Systems Industry Market Dynamics & Concentration
The NRW Smart Well Systems market is characterized by a moderate level of concentration, with a few major players holding significant market share. The market share of the top five companies in 2024 was approximately xx%, indicating room for both growth and consolidation. Innovation is a key driver, with continuous advancements in sensor technology, data analytics, and leak detection methods shaping market dynamics. Regulatory frameworks, particularly those concerning water conservation and infrastructure modernization, play a significant role in shaping market growth. Product substitutes, such as traditional well maintenance techniques, exert competitive pressure, but the increasing adoption of smart technologies is driving market expansion. End-user trends, such as the rising focus on water efficiency and leak minimization, are fueling demand. Mergers and acquisitions (M&A) activity has been moderate, with approximately xx deals recorded between 2019 and 2024, indicating a potential for further consolidation in the coming years.
- Market Concentration: Top 5 players hold xx% market share in 2024.
- M&A Activity: Approximately xx deals between 2019-2024.
- Innovation Drivers: Advancements in sensor technology, data analytics, and leak detection.
- Regulatory Influence: Water conservation policies and infrastructure modernization initiatives.
NRW Smart Well Systems Industry Industry Trends & Analysis
The NRW Smart Well Systems market exhibits a robust growth trajectory, with a Compound Annual Growth Rate (CAGR) of xx% projected from 2025 to 2033. This growth is primarily driven by the increasing need for efficient water management, the growing adoption of smart city initiatives, and the escalating demand for advanced leak detection technologies. Technological disruptions, such as the development of more sophisticated sensor technologies and cloud-based data analytics platforms, are further accelerating market expansion. Consumer preferences are shifting towards sustainable and cost-effective water management solutions, leading to increased adoption of smart well systems. The competitive landscape is characterized by both established players and emerging startups, fostering innovation and price competition. Market penetration of smart well systems is expected to reach xx% by 2033, signifying significant market growth potential.
Leading Markets & Segments in NRW Smart Well Systems Industry
The North American region currently dominates the NRW Smart Well Systems market, driven by robust infrastructure investment and stringent water management regulations. Within the market, the following segments are experiencing significant growth:
- Acoustic Sensors (Invasive Technology): Key drivers include the high accuracy of invasive sensors and the increasing need for precise leak detection in critical infrastructure.
- Software and Data Analytics Platform: This segment benefits from growing data volumes and the demand for efficient data interpretation for predictive maintenance and optimized water management.
- Leak Detection Technologies (Non-invasive Technology): Driven by the demand for minimally disruptive technologies and the increasing focus on reducing water loss and maintenance costs.
Dominance Analysis: North America's leadership stems from factors like advanced infrastructure, a higher level of technological adoption, and strong government support for water management initiatives.
NRW Smart Well Systems Industry Product Developments
Recent product innovations in the NRW Smart Well Systems industry include the development of more sophisticated, miniature sensors with enhanced durability and communication capabilities, improving data accuracy and the integration of AI-powered data analytics platforms for predictive maintenance. These innovations offer significant competitive advantages, enabling more efficient water management, reduced water loss, and optimized infrastructure maintenance. The market is witnessing a growing trend toward cloud-based solutions for data storage and analysis, promoting easier accessibility and improved collaboration among stakeholders.
Key Drivers of NRW Smart Well Systems Industry Growth
Several factors are driving the growth of the NRW Smart Well Systems industry, including:
- Technological Advancements: Miniaturization of sensors, improved data analytics, and the development of IoT-enabled solutions are increasing efficiency and accuracy.
- Economic Factors: The rising cost of water and the need for efficient resource management are driving adoption.
- Regulatory Frameworks: Government regulations promoting water conservation and infrastructure modernization are creating favorable market conditions.
Challenges in the NRW Smart Well Systems Industry Market
The NRW Smart Well Systems market faces several challenges:
- High Initial Investment Costs: The implementation of smart well systems can require significant upfront investment, potentially hindering adoption in resource-constrained regions.
- Data Security Concerns: The increasing reliance on data analytics raises concerns about the security and privacy of sensitive water infrastructure data.
- Interoperability Issues: Lack of standardization across different systems can create challenges in data integration and seamless system operation. This issue can lead to xx Million dollars in annual loss.
Emerging Opportunities in NRW Smart Well Systems Industry
Significant opportunities exist for long-term growth in the NRW Smart Well Systems industry. This includes the expansion into developing markets, the emergence of new sensor technologies, and strategic partnerships between technology providers and water management companies. The integration of advanced analytics, machine learning, and AI technologies presents substantial opportunities for optimizing water resource management and minimizing water losses. The exploration of new business models, such as water-as-a-service, can also drive market growth.
Leading Players in the NRW Smart Well Systems Industry Sector
- Itron Inc
- Honeywell International Inc
- ABB Ltd
- TaKaDu Limited
- Xylem Inc
- Suez Group
- Arad Group
- Hitachi Ltd
- Siemens AG
- Sewerin Technologie
- Aquarius Spectrum
- i2O Water Ltd
Key Milestones in NRW Smart Well Systems Industry Industry
- May 2021: Honeywell created a portable device to extract drinking water from the air, collaborating with NuMat Technologies and Northwestern University. This milestone highlights advancements in water resource technologies and signifies potential applications within the NRW Smart Well Systems market.
- June 2021: Itron Inc. implemented a grid-interactive water heater program in Colorado, impacting energy efficiency and smart grid integration, demonstrating the potential for smart well systems to contribute to broader sustainability initiatives.
Strategic Outlook for NRW Smart Well Systems Market
The NRW Smart Well Systems market is poised for substantial growth over the forecast period, driven by continuous technological advancements, increasing urbanization, and the growing focus on sustainable water management. Strategic partnerships, expansion into emerging markets, and the development of innovative business models will be crucial for companies to capitalize on future growth opportunities. The market presents a promising landscape for investors and stakeholders focused on long-term value creation in the water management sector.
NRW Smart Well Systems Industry Segmentation
-
1. Solution
-
1.1. Software and Data Analytics Platform
- 1.1.1. Leak Detection Services
-
1.1.2. Leak Detection Technologies
-
1.1.2.1. Non-invasive Technology
- 1.1.2.1.1. Aerial Imagery
- 1.1.2.1.2. Pressure Sensors
- 1.1.2.1.3. Acoustic Sensors
-
1.1.2.2. Invasive Technology
- 1.1.2.2.1. Focused Electrode Leak Location
- 1.1.2.2.2. Tethered Single or Multi Sensor Process
- 1.1.2.2.3. Tracer Gas
-
1.1.2.1. Non-invasive Technology
-
1.1. Software and Data Analytics Platform
NRW Smart Well Systems Industry Segmentation By Geography
- 1. North America
- 2. Europe
- 3. Asia Pacific
- 4. Latin America
- 5. Middle East and Africa
NRW Smart Well Systems Industry REPORT HIGHLIGHTS
| Aspects | Details |
|---|---|
| Study Period | 2019-2033 |
| Base Year | 2024 |
| Estimated Year | 2025 |
| Forecast Period | 2025-2033 |
| Historical Period | 2019-2024 |
| Growth Rate | CAGR of 10.21% from 2019-2033 |
| Segmentation |
|
Table of Contents
- 1. Introduction
- 1.1. Research Scope
- 1.2. Market Segmentation
- 1.3. Research Methodology
- 1.4. Definitions and Assumptions
- 2. Executive Summary
- 2.1. Introduction
- 3. Market Dynamics
- 3.1. Introduction
- 3.2. Market Drivers
- 3.2.1. Growing Need to Manage the Increasing Global Demand for Water; Increasing Demand to Reduce Non-revenue Water Losses
- 3.3. Market Restrains
- 3.3.1. Bandwidth Contraints and Compatibility Issues due to Variety of Standards
- 3.4. Market Trends
- 3.4.1. Non-invasive Technologies to be on Demand
- 4. Market Factor Analysis
- 4.1. Porters Five Forces
- 4.2. Supply/Value Chain
- 4.3. PESTEL analysis
- 4.4. Market Entropy
- 4.5. Patent/Trademark Analysis
- 5. Global NRW Smart Well Systems Industry Analysis, Insights and Forecast, 2019-2031
- 5.1. Market Analysis, Insights and Forecast - by Solution
- 5.1.1. Software and Data Analytics Platform
- 5.1.1.1. Leak Detection Services
- 5.1.1.2. Leak Detection Technologies
- 5.1.1.2.1. Non-invasive Technology
- 5.1.1.2.1.1. Aerial Imagery
- 5.1.1.2.1.2. Pressure Sensors
- 5.1.1.2.1.3. Acoustic Sensors
- 5.1.1.2.2. Invasive Technology
- 5.1.1.2.2.1. Focused Electrode Leak Location
- 5.1.1.2.2.2. Tethered Single or Multi Sensor Process
- 5.1.1.2.2.3. Tracer Gas
- 5.1.1.2.1. Non-invasive Technology
- 5.1.1. Software and Data Analytics Platform
- 5.2. Market Analysis, Insights and Forecast - by Region
- 5.2.1. North America
- 5.2.2. Europe
- 5.2.3. Asia Pacific
- 5.2.4. Latin America
- 5.2.5. Middle East and Africa
- 5.1. Market Analysis, Insights and Forecast - by Solution
- 6. North America NRW Smart Well Systems Industry Analysis, Insights and Forecast, 2019-2031
- 6.1. Market Analysis, Insights and Forecast - by Solution
- 6.1.1. Software and Data Analytics Platform
- 6.1.1.1. Leak Detection Services
- 6.1.1.2. Leak Detection Technologies
- 6.1.1.2.1. Non-invasive Technology
- 6.1.1.2.1.1. Aerial Imagery
- 6.1.1.2.1.2. Pressure Sensors
- 6.1.1.2.1.3. Acoustic Sensors
- 6.1.1.2.2. Invasive Technology
- 6.1.1.2.2.1. Focused Electrode Leak Location
- 6.1.1.2.2.2. Tethered Single or Multi Sensor Process
- 6.1.1.2.2.3. Tracer Gas
- 6.1.1.2.1. Non-invasive Technology
- 6.1.1. Software and Data Analytics Platform
- 6.1. Market Analysis, Insights and Forecast - by Solution
- 7. Europe NRW Smart Well Systems Industry Analysis, Insights and Forecast, 2019-2031
- 7.1. Market Analysis, Insights and Forecast - by Solution
- 7.1.1. Software and Data Analytics Platform
- 7.1.1.1. Leak Detection Services
- 7.1.1.2. Leak Detection Technologies
- 7.1.1.2.1. Non-invasive Technology
- 7.1.1.2.1.1. Aerial Imagery
- 7.1.1.2.1.2. Pressure Sensors
- 7.1.1.2.1.3. Acoustic Sensors
- 7.1.1.2.2. Invasive Technology
- 7.1.1.2.2.1. Focused Electrode Leak Location
- 7.1.1.2.2.2. Tethered Single or Multi Sensor Process
- 7.1.1.2.2.3. Tracer Gas
- 7.1.1.2.1. Non-invasive Technology
- 7.1.1. Software and Data Analytics Platform
- 7.1. Market Analysis, Insights and Forecast - by Solution
- 8. Asia Pacific NRW Smart Well Systems Industry Analysis, Insights and Forecast, 2019-2031
- 8.1. Market Analysis, Insights and Forecast - by Solution
- 8.1.1. Software and Data Analytics Platform
- 8.1.1.1. Leak Detection Services
- 8.1.1.2. Leak Detection Technologies
- 8.1.1.2.1. Non-invasive Technology
- 8.1.1.2.1.1. Aerial Imagery
- 8.1.1.2.1.2. Pressure Sensors
- 8.1.1.2.1.3. Acoustic Sensors
- 8.1.1.2.2. Invasive Technology
- 8.1.1.2.2.1. Focused Electrode Leak Location
- 8.1.1.2.2.2. Tethered Single or Multi Sensor Process
- 8.1.1.2.2.3. Tracer Gas
- 8.1.1.2.1. Non-invasive Technology
- 8.1.1. Software and Data Analytics Platform
- 8.1. Market Analysis, Insights and Forecast - by Solution
- 9. Latin America NRW Smart Well Systems Industry Analysis, Insights and Forecast, 2019-2031
- 9.1. Market Analysis, Insights and Forecast - by Solution
- 9.1.1. Software and Data Analytics Platform
- 9.1.1.1. Leak Detection Services
- 9.1.1.2. Leak Detection Technologies
- 9.1.1.2.1. Non-invasive Technology
- 9.1.1.2.1.1. Aerial Imagery
- 9.1.1.2.1.2. Pressure Sensors
- 9.1.1.2.1.3. Acoustic Sensors
- 9.1.1.2.2. Invasive Technology
- 9.1.1.2.2.1. Focused Electrode Leak Location
- 9.1.1.2.2.2. Tethered Single or Multi Sensor Process
- 9.1.1.2.2.3. Tracer Gas
- 9.1.1.2.1. Non-invasive Technology
- 9.1.1. Software and Data Analytics Platform
- 9.1. Market Analysis, Insights and Forecast - by Solution
- 10. Middle East and Africa NRW Smart Well Systems Industry Analysis, Insights and Forecast, 2019-2031
- 10.1. Market Analysis, Insights and Forecast - by Solution
- 10.1.1. Software and Data Analytics Platform
- 10.1.1.1. Leak Detection Services
- 10.1.1.2. Leak Detection Technologies
- 10.1.1.2.1. Non-invasive Technology
- 10.1.1.2.1.1. Aerial Imagery
- 10.1.1.2.1.2. Pressure Sensors
- 10.1.1.2.1.3. Acoustic Sensors
- 10.1.1.2.2. Invasive Technology
- 10.1.1.2.2.1. Focused Electrode Leak Location
- 10.1.1.2.2.2. Tethered Single or Multi Sensor Process
- 10.1.1.2.2.3. Tracer Gas
- 10.1.1.2.1. Non-invasive Technology
- 10.1.1. Software and Data Analytics Platform
- 10.1. Market Analysis, Insights and Forecast - by Solution
- 11. North America NRW Smart Well Systems Industry Analysis, Insights and Forecast, 2019-2031
- 11.1. Market Analysis, Insights and Forecast - By Country/Sub-region
- 11.1.1 United States
- 11.1.2 Canada
- 11.1.3 Mexico
- 12. Europe NRW Smart Well Systems Industry Analysis, Insights and Forecast, 2019-2031
- 12.1. Market Analysis, Insights and Forecast - By Country/Sub-region
- 12.1.1 Germany
- 12.1.2 United Kingdom
- 12.1.3 France
- 12.1.4 Spain
- 12.1.5 Italy
- 12.1.6 Spain
- 12.1.7 Belgium
- 12.1.8 Netherland
- 12.1.9 Nordics
- 12.1.10 Rest of Europe
- 13. Asia Pacific NRW Smart Well Systems Industry Analysis, Insights and Forecast, 2019-2031
- 13.1. Market Analysis, Insights and Forecast - By Country/Sub-region
- 13.1.1 China
- 13.1.2 Japan
- 13.1.3 India
- 13.1.4 South Korea
- 13.1.5 Southeast Asia
- 13.1.6 Australia
- 13.1.7 Indonesia
- 13.1.8 Phillipes
- 13.1.9 Singapore
- 13.1.10 Thailandc
- 13.1.11 Rest of Asia Pacific
- 14. South America NRW Smart Well Systems Industry Analysis, Insights and Forecast, 2019-2031
- 14.1. Market Analysis, Insights and Forecast - By Country/Sub-region
- 14.1.1 Brazil
- 14.1.2 Argentina
- 14.1.3 Peru
- 14.1.4 Chile
- 14.1.5 Colombia
- 14.1.6 Ecuador
- 14.1.7 Venezuela
- 14.1.8 Rest of South America
- 15. North America NRW Smart Well Systems Industry Analysis, Insights and Forecast, 2019-2031
- 15.1. Market Analysis, Insights and Forecast - By Country/Sub-region
- 15.1.1 United States
- 15.1.2 Canada
- 15.1.3 Mexico
- 16. MEA NRW Smart Well Systems Industry Analysis, Insights and Forecast, 2019-2031
- 16.1. Market Analysis, Insights and Forecast - By Country/Sub-region
- 16.1.1 United Arab Emirates
- 16.1.2 Saudi Arabia
- 16.1.3 South Africa
- 16.1.4 Rest of Middle East and Africa
- 17. Competitive Analysis
- 17.1. Global Market Share Analysis 2024
- 17.2. Company Profiles
- 17.2.1 Itron Inc
- 17.2.1.1. Overview
- 17.2.1.2. Products
- 17.2.1.3. SWOT Analysis
- 17.2.1.4. Recent Developments
- 17.2.1.5. Financials (Based on Availability)
- 17.2.2 Honeywell International Inc
- 17.2.2.1. Overview
- 17.2.2.2. Products
- 17.2.2.3. SWOT Analysis
- 17.2.2.4. Recent Developments
- 17.2.2.5. Financials (Based on Availability)
- 17.2.3 ABB Ltd
- 17.2.3.1. Overview
- 17.2.3.2. Products
- 17.2.3.3. SWOT Analysis
- 17.2.3.4. Recent Developments
- 17.2.3.5. Financials (Based on Availability)
- 17.2.4 TaKaDu Limited
- 17.2.4.1. Overview
- 17.2.4.2. Products
- 17.2.4.3. SWOT Analysis
- 17.2.4.4. Recent Developments
- 17.2.4.5. Financials (Based on Availability)
- 17.2.5 Xylem Inc
- 17.2.5.1. Overview
- 17.2.5.2. Products
- 17.2.5.3. SWOT Analysis
- 17.2.5.4. Recent Developments
- 17.2.5.5. Financials (Based on Availability)
- 17.2.6 Suez Group
- 17.2.6.1. Overview
- 17.2.6.2. Products
- 17.2.6.3. SWOT Analysis
- 17.2.6.4. Recent Developments
- 17.2.6.5. Financials (Based on Availability)
- 17.2.7 Arad Group
- 17.2.7.1. Overview
- 17.2.7.2. Products
- 17.2.7.3. SWOT Analysis
- 17.2.7.4. Recent Developments
- 17.2.7.5. Financials (Based on Availability)
- 17.2.8 Hitachi Ltd
- 17.2.8.1. Overview
- 17.2.8.2. Products
- 17.2.8.3. SWOT Analysis
- 17.2.8.4. Recent Developments
- 17.2.8.5. Financials (Based on Availability)
- 17.2.9 Siemens AG
- 17.2.9.1. Overview
- 17.2.9.2. Products
- 17.2.9.3. SWOT Analysis
- 17.2.9.4. Recent Developments
- 17.2.9.5. Financials (Based on Availability)
- 17.2.10 Sewerin Technologie
- 17.2.10.1. Overview
- 17.2.10.2. Products
- 17.2.10.3. SWOT Analysis
- 17.2.10.4. Recent Developments
- 17.2.10.5. Financials (Based on Availability)
- 17.2.11 Aquarius Spectrum
- 17.2.11.1. Overview
- 17.2.11.2. Products
- 17.2.11.3. SWOT Analysis
- 17.2.11.4. Recent Developments
- 17.2.11.5. Financials (Based on Availability)
- 17.2.12 i2O Water Ltd
- 17.2.12.1. Overview
- 17.2.12.2. Products
- 17.2.12.3. SWOT Analysis
- 17.2.12.4. Recent Developments
- 17.2.12.5. Financials (Based on Availability)
- 17.2.1 Itron Inc
List of Figures
- Figure 1: Global NRW Smart Well Systems Industry Revenue Breakdown (Million, %) by Region 2024 & 2032
- Figure 2: North America NRW Smart Well Systems Industry Revenue (Million), by Country 2024 & 2032
- Figure 3: North America NRW Smart Well Systems Industry Revenue Share (%), by Country 2024 & 2032
- Figure 4: Europe NRW Smart Well Systems Industry Revenue (Million), by Country 2024 & 2032
- Figure 5: Europe NRW Smart Well Systems Industry Revenue Share (%), by Country 2024 & 2032
- Figure 6: Asia Pacific NRW Smart Well Systems Industry Revenue (Million), by Country 2024 & 2032
- Figure 7: Asia Pacific NRW Smart Well Systems Industry Revenue Share (%), by Country 2024 & 2032
- Figure 8: South America NRW Smart Well Systems Industry Revenue (Million), by Country 2024 & 2032
- Figure 9: South America NRW Smart Well Systems Industry Revenue Share (%), by Country 2024 & 2032
- Figure 10: North America NRW Smart Well Systems Industry Revenue (Million), by Country 2024 & 2032
- Figure 11: North America NRW Smart Well Systems Industry Revenue Share (%), by Country 2024 & 2032
- Figure 12: MEA NRW Smart Well Systems Industry Revenue (Million), by Country 2024 & 2032
- Figure 13: MEA NRW Smart Well Systems Industry Revenue Share (%), by Country 2024 & 2032
- Figure 14: North America NRW Smart Well Systems Industry Revenue (Million), by Solution 2024 & 2032
- Figure 15: North America NRW Smart Well Systems Industry Revenue Share (%), by Solution 2024 & 2032
- Figure 16: North America NRW Smart Well Systems Industry Revenue (Million), by Country 2024 & 2032
- Figure 17: North America NRW Smart Well Systems Industry Revenue Share (%), by Country 2024 & 2032
- Figure 18: Europe NRW Smart Well Systems Industry Revenue (Million), by Solution 2024 & 2032
- Figure 19: Europe NRW Smart Well Systems Industry Revenue Share (%), by Solution 2024 & 2032
- Figure 20: Europe NRW Smart Well Systems Industry Revenue (Million), by Country 2024 & 2032
- Figure 21: Europe NRW Smart Well Systems Industry Revenue Share (%), by Country 2024 & 2032
- Figure 22: Asia Pacific NRW Smart Well Systems Industry Revenue (Million), by Solution 2024 & 2032
- Figure 23: Asia Pacific NRW Smart Well Systems Industry Revenue Share (%), by Solution 2024 & 2032
- Figure 24: Asia Pacific NRW Smart Well Systems Industry Revenue (Million), by Country 2024 & 2032
- Figure 25: Asia Pacific NRW Smart Well Systems Industry Revenue Share (%), by Country 2024 & 2032
- Figure 26: Latin America NRW Smart Well Systems Industry Revenue (Million), by Solution 2024 & 2032
- Figure 27: Latin America NRW Smart Well Systems Industry Revenue Share (%), by Solution 2024 & 2032
- Figure 28: Latin America NRW Smart Well Systems Industry Revenue (Million), by Country 2024 & 2032
- Figure 29: Latin America NRW Smart Well Systems Industry Revenue Share (%), by Country 2024 & 2032
- Figure 30: Middle East and Africa NRW Smart Well Systems Industry Revenue (Million), by Solution 2024 & 2032
- Figure 31: Middle East and Africa NRW Smart Well Systems Industry Revenue Share (%), by Solution 2024 & 2032
- Figure 32: Middle East and Africa NRW Smart Well Systems Industry Revenue (Million), by Country 2024 & 2032
- Figure 33: Middle East and Africa NRW Smart Well Systems Industry Revenue Share (%), by Country 2024 & 2032
List of Tables
- Table 1: Global NRW Smart Well Systems Industry Revenue Million Forecast, by Region 2019 & 2032
- Table 2: Global NRW Smart Well Systems Industry Revenue Million Forecast, by Solution 2019 & 2032
- Table 3: Global NRW Smart Well Systems Industry Revenue Million Forecast, by Region 2019 & 2032
- Table 4: Global NRW Smart Well Systems Industry Revenue Million Forecast, by Country 2019 & 2032
- Table 5: United States NRW Smart Well Systems Industry Revenue (Million) Forecast, by Application 2019 & 2032
- Table 6: Canada NRW Smart Well Systems Industry Revenue (Million) Forecast, by Application 2019 & 2032
- Table 7: Mexico NRW Smart Well Systems Industry Revenue (Million) Forecast, by Application 2019 & 2032
- Table 8: Global NRW Smart Well Systems Industry Revenue Million Forecast, by Country 2019 & 2032
- Table 9: Germany NRW Smart Well Systems Industry Revenue (Million) Forecast, by Application 2019 & 2032
- Table 10: United Kingdom NRW Smart Well Systems Industry Revenue (Million) Forecast, by Application 2019 & 2032
- Table 11: France NRW Smart Well Systems Industry Revenue (Million) Forecast, by Application 2019 & 2032
- Table 12: Spain NRW Smart Well Systems Industry Revenue (Million) Forecast, by Application 2019 & 2032
- Table 13: Italy NRW Smart Well Systems Industry Revenue (Million) Forecast, by Application 2019 & 2032
- Table 14: Spain NRW Smart Well Systems Industry Revenue (Million) Forecast, by Application 2019 & 2032
- Table 15: Belgium NRW Smart Well Systems Industry Revenue (Million) Forecast, by Application 2019 & 2032
- Table 16: Netherland NRW Smart Well Systems Industry Revenue (Million) Forecast, by Application 2019 & 2032
- Table 17: Nordics NRW Smart Well Systems Industry Revenue (Million) Forecast, by Application 2019 & 2032
- Table 18: Rest of Europe NRW Smart Well Systems Industry Revenue (Million) Forecast, by Application 2019 & 2032
- Table 19: Global NRW Smart Well Systems Industry Revenue Million Forecast, by Country 2019 & 2032
- Table 20: China NRW Smart Well Systems Industry Revenue (Million) Forecast, by Application 2019 & 2032
- Table 21: Japan NRW Smart Well Systems Industry Revenue (Million) Forecast, by Application 2019 & 2032
- Table 22: India NRW Smart Well Systems Industry Revenue (Million) Forecast, by Application 2019 & 2032
- Table 23: South Korea NRW Smart Well Systems Industry Revenue (Million) Forecast, by Application 2019 & 2032
- Table 24: Southeast Asia NRW Smart Well Systems Industry Revenue (Million) Forecast, by Application 2019 & 2032
- Table 25: Australia NRW Smart Well Systems Industry Revenue (Million) Forecast, by Application 2019 & 2032
- Table 26: Indonesia NRW Smart Well Systems Industry Revenue (Million) Forecast, by Application 2019 & 2032
- Table 27: Phillipes NRW Smart Well Systems Industry Revenue (Million) Forecast, by Application 2019 & 2032
- Table 28: Singapore NRW Smart Well Systems Industry Revenue (Million) Forecast, by Application 2019 & 2032
- Table 29: Thailandc NRW Smart Well Systems Industry Revenue (Million) Forecast, by Application 2019 & 2032
- Table 30: Rest of Asia Pacific NRW Smart Well Systems Industry Revenue (Million) Forecast, by Application 2019 & 2032
- Table 31: Global NRW Smart Well Systems Industry Revenue Million Forecast, by Country 2019 & 2032
- Table 32: Brazil NRW Smart Well Systems Industry Revenue (Million) Forecast, by Application 2019 & 2032
- Table 33: Argentina NRW Smart Well Systems Industry Revenue (Million) Forecast, by Application 2019 & 2032
- Table 34: Peru NRW Smart Well Systems Industry Revenue (Million) Forecast, by Application 2019 & 2032
- Table 35: Chile NRW Smart Well Systems Industry Revenue (Million) Forecast, by Application 2019 & 2032
- Table 36: Colombia NRW Smart Well Systems Industry Revenue (Million) Forecast, by Application 2019 & 2032
- Table 37: Ecuador NRW Smart Well Systems Industry Revenue (Million) Forecast, by Application 2019 & 2032
- Table 38: Venezuela NRW Smart Well Systems Industry Revenue (Million) Forecast, by Application 2019 & 2032
- Table 39: Rest of South America NRW Smart Well Systems Industry Revenue (Million) Forecast, by Application 2019 & 2032
- Table 40: Global NRW Smart Well Systems Industry Revenue Million Forecast, by Country 2019 & 2032
- Table 41: United States NRW Smart Well Systems Industry Revenue (Million) Forecast, by Application 2019 & 2032
- Table 42: Canada NRW Smart Well Systems Industry Revenue (Million) Forecast, by Application 2019 & 2032
- Table 43: Mexico NRW Smart Well Systems Industry Revenue (Million) Forecast, by Application 2019 & 2032
- Table 44: Global NRW Smart Well Systems Industry Revenue Million Forecast, by Country 2019 & 2032
- Table 45: United Arab Emirates NRW Smart Well Systems Industry Revenue (Million) Forecast, by Application 2019 & 2032
- Table 46: Saudi Arabia NRW Smart Well Systems Industry Revenue (Million) Forecast, by Application 2019 & 2032
- Table 47: South Africa NRW Smart Well Systems Industry Revenue (Million) Forecast, by Application 2019 & 2032
- Table 48: Rest of Middle East and Africa NRW Smart Well Systems Industry Revenue (Million) Forecast, by Application 2019 & 2032
- Table 49: Global NRW Smart Well Systems Industry Revenue Million Forecast, by Solution 2019 & 2032
- Table 50: Global NRW Smart Well Systems Industry Revenue Million Forecast, by Country 2019 & 2032
- Table 51: Global NRW Smart Well Systems Industry Revenue Million Forecast, by Solution 2019 & 2032
- Table 52: Global NRW Smart Well Systems Industry Revenue Million Forecast, by Country 2019 & 2032
- Table 53: Global NRW Smart Well Systems Industry Revenue Million Forecast, by Solution 2019 & 2032
- Table 54: Global NRW Smart Well Systems Industry Revenue Million Forecast, by Country 2019 & 2032
- Table 55: Global NRW Smart Well Systems Industry Revenue Million Forecast, by Solution 2019 & 2032
- Table 56: Global NRW Smart Well Systems Industry Revenue Million Forecast, by Country 2019 & 2032
- Table 57: Global NRW Smart Well Systems Industry Revenue Million Forecast, by Solution 2019 & 2032
- Table 58: Global NRW Smart Well Systems Industry Revenue Million Forecast, by Country 2019 & 2032
Frequently Asked Questions
1. What is the projected Compound Annual Growth Rate (CAGR) of the NRW Smart Well Systems Industry?
The projected CAGR is approximately 10.21%.
2. Which companies are prominent players in the NRW Smart Well Systems Industry?
Key companies in the market include Itron Inc, Honeywell International Inc, ABB Ltd, TaKaDu Limited, Xylem Inc, Suez Group, Arad Group, Hitachi Ltd, Siemens AG, Sewerin Technologie, Aquarius Spectrum, i2O Water Ltd.
3. What are the main segments of the NRW Smart Well Systems Industry?
The market segments include Solution.
4. Can you provide details about the market size?
The market size is estimated to be USD 1.16 Million as of 2022.
5. What are some drivers contributing to market growth?
Growing Need to Manage the Increasing Global Demand for Water; Increasing Demand to Reduce Non-revenue Water Losses.
6. What are the notable trends driving market growth?
Non-invasive Technologies to be on Demand.
7. Are there any restraints impacting market growth?
Bandwidth Contraints and Compatibility Issues due to Variety of Standards.
8. Can you provide examples of recent developments in the market?
May 2021 - Honeywell created a portable device that can extract drinking water from the air. Honeywell selected NuMat Technologies and Northwestern University to add additional expertise to its efforts.
9. What pricing options are available for accessing the report?
Pricing options include single-user, multi-user, and enterprise licenses priced at USD 4750, USD 5250, and USD 8750 respectively.
10. Is the market size provided in terms of value or volume?
The market size is provided in terms of value, measured in Million.
11. Are there any specific market keywords associated with the report?
Yes, the market keyword associated with the report is "NRW Smart Well Systems Industry," which aids in identifying and referencing the specific market segment covered.
12. How do I determine which pricing option suits my needs best?
The pricing options vary based on user requirements and access needs. Individual users may opt for single-user licenses, while businesses requiring broader access may choose multi-user or enterprise licenses for cost-effective access to the report.
13. Are there any additional resources or data provided in the NRW Smart Well Systems Industry report?
While the report offers comprehensive insights, it's advisable to review the specific contents or supplementary materials provided to ascertain if additional resources or data are available.
14. How can I stay updated on further developments or reports in the NRW Smart Well Systems Industry?
To stay informed about further developments, trends, and reports in the NRW Smart Well Systems Industry, consider subscribing to industry newsletters, following relevant companies and organizations, or regularly checking reputable industry news sources and publications.
Methodology
Step 1 - Identification of Relevant Samples Size from Population Database


Step 2 - Approaches for Defining Global Market Size (Value, Volume* & Price*)

Note*: In applicable scenarios
Step 3 - Data Sources
Primary Research
- Web Analytics
- Survey Reports
- Research Institute
- Latest Research Reports
- Opinion Leaders
Secondary Research
- Annual Reports
- White Paper
- Latest Press Release
- Industry Association
- Paid Database
- Investor Presentations

Step 4 - Data Triangulation
Involves using different sources of information in order to increase the validity of a study
These sources are likely to be stakeholders in a program - participants, other researchers, program staff, other community members, and so on.
Then we put all data in single framework & apply various statistical tools to find out the dynamic on the market.
During the analysis stage, feedback from the stakeholder groups would be compared to determine areas of agreement as well as areas of divergence
