

Key Insights
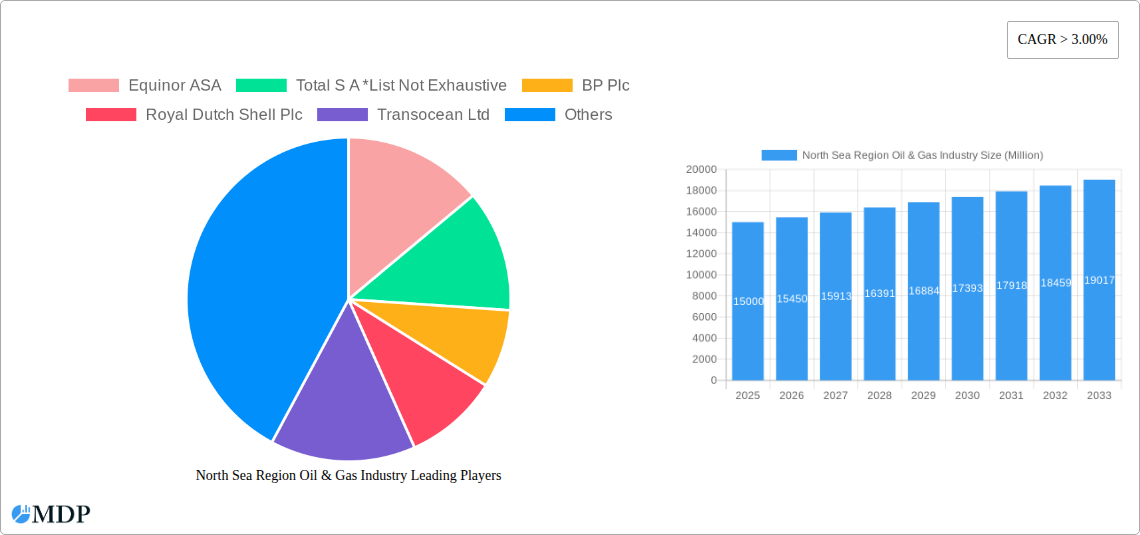
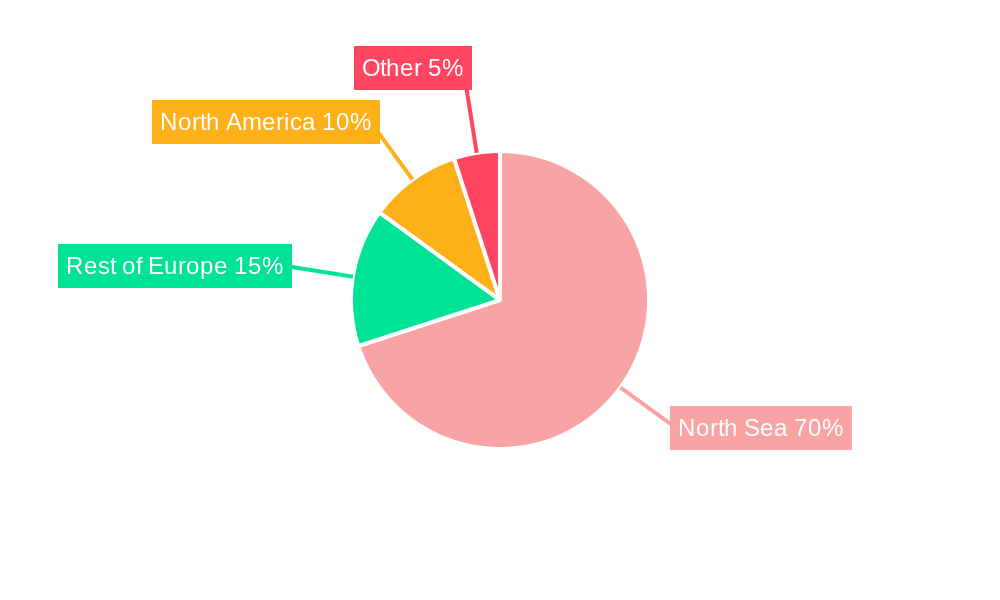
The North Sea oil and gas industry, while facing headwinds, remains a significant player in the global energy market. Driven by persistent energy demand and geopolitical instability, the sector continues to see moderate growth, with a Compound Annual Growth Rate (CAGR) exceeding 3% from 2025 to 2033. This growth, however, is tempered by several factors. Stringent environmental regulations, pushing towards a cleaner energy future, are imposing substantial costs on operators, necessitating significant investments in carbon capture and storage technologies and potentially influencing production levels. Furthermore, the declining reserves in mature fields and the challenges associated with exploration and production in deeper waters present operational hurdles. Competition from alternative energy sources, such as wind and solar, also puts downward pressure on prices and market share. Despite these challenges, the North Sea region benefits from established infrastructure, skilled workforce, and proximity to major European markets, creating a resilient, albeit evolving, energy landscape. The Upstream segment, encompassing exploration and production, remains crucial, yet investment is shifting towards improving efficiency and extending the lifespan of existing fields. Midstream activities, such as transportation and storage, continue to play a vital role in ensuring reliable energy supply, while the Downstream segment is increasingly focused on refining and petrochemical production. Major players like Equinor, TotalEnergies, BP, Shell, and others are actively adapting their strategies to navigate the changing dynamics of the sector, emphasizing efficiency improvements, diversification, and a commitment to sustainability.
The North Sea oil and gas industry's future trajectory will heavily depend on technological advancements, governmental policies, and the overall global energy transition. While a decline in overall production is likely as mature fields deplete, innovation in areas like enhanced oil recovery techniques and the development of carbon-neutral technologies could moderate this decline. The region's focus on becoming a crucial player in carbon capture, utilization, and storage (CCUS) initiatives highlights its commitment to sustainable practices, potentially attracting further investment and establishing the North Sea as a hub for clean energy solutions alongside continued hydrocarbon production. The industry's success will hinge on the ability of operators to effectively balance economic profitability with environmental responsibility, adapting to the changing demands of the energy market and governmental regulatory frameworks.
North Sea Region Oil & Gas Industry: Market Analysis & Forecast 2019-2033
This comprehensive report provides an in-depth analysis of the North Sea region's oil and gas industry, offering invaluable insights for stakeholders, investors, and industry professionals. The study covers the period from 2019 to 2033, with a base year of 2025 and a forecast period spanning 2025-2033. This detailed analysis includes market sizing, segmentation, competitive landscape, and future growth projections, empowering informed decision-making in this dynamic sector. The report utilizes data from the historical period (2019-2024) to create a robust and accurate prediction of market trends.
North Sea Region Oil & Gas Industry Market Dynamics & Concentration
The North Sea oil and gas market is characterized by a high degree of concentration, with a few major players holding significant market share. Equinor ASA, TotalEnergies SE, BP Plc, Royal Dutch Shell Plc, and other large multinational corporations dominate the upstream sector. The market's dynamics are shaped by several factors including fluctuating oil and gas prices, stringent regulatory frameworks focused on environmental sustainability, and the increasing adoption of renewable energy sources. Innovation plays a key role, with companies investing heavily in enhanced oil recovery (EOR) techniques and offshore technology advancements. Mergers and acquisitions (M&A) remain a significant activity, with xx deals recorded between 2019 and 2024, primarily aimed at consolidating market share and accessing new resources. Product substitutes, such as renewable energy sources, are exerting increasing competitive pressure. End-user trends, including the shift towards cleaner energy, are also influencing the long-term outlook of the industry.
- Market Concentration: Top 5 players hold approximately xx% of the market share in 2025 (estimated).
- M&A Activity: xx deals recorded between 2019 and 2024 (estimated).
- Innovation Drivers: EOR techniques, offshore technology advancements, digitalization.
- Regulatory Framework: Stringent environmental regulations and licensing procedures.
- Product Substitutes: Renewable energy sources (solar, wind).
- End-User Trends: Growing demand for cleaner energy.
North Sea Region Oil & Gas Industry Industry Trends & Analysis
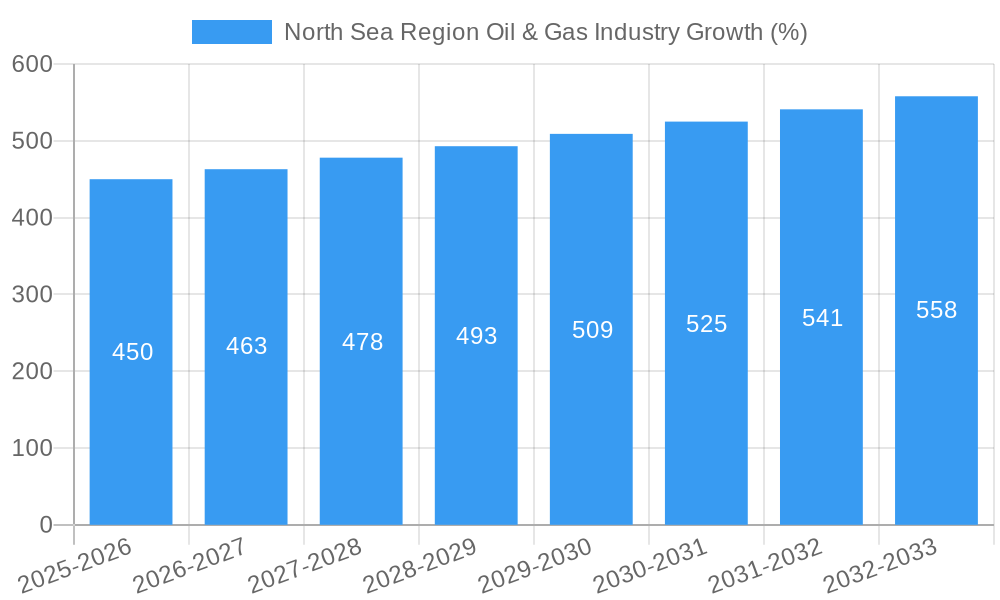
The North Sea oil and gas industry is experiencing significant transformation driven by technological disruptions, evolving consumer preferences, and intense competitive pressures. The market is witnessing a shift towards offshore wind energy, impacting the long-term demand for oil and gas. Technological advancements, particularly in digitalization and automation, are enhancing operational efficiency and reducing costs. The industry is also facing increasing pressure to reduce its carbon footprint, leading to investments in carbon capture and storage (CCS) technologies. The compound annual growth rate (CAGR) for the overall market is estimated at xx% between 2025 and 2033 (estimated), with the upstream sector exhibiting a slightly higher growth rate due to ongoing exploration and production activities. Market penetration of new technologies, such as subsea processing and remote operations, is expected to increase significantly over the forecast period.
Leading Markets & Segments in North Sea Region Oil & Gas Industry
The Upstream segment holds the largest share of the North Sea oil and gas market in 2025 (estimated) driven by continuous exploration and production activities in established fields and new discoveries. The UK and Norway are the leading countries within the region, benefiting from robust infrastructure, supportive government policies, and experienced workforce.
- Upstream Segment Drivers:
- Significant reserves of oil and natural gas.
- Well-established infrastructure and skilled workforce.
- Government support for exploration and production activities.
- Midstream Segment: Significant investments in pipelines and processing facilities are expected, particularly for the transport of gas to the mainland.
- Downstream Segment: The refining and marketing of petroleum products are heavily influenced by global demand and refining capacity.
The dominance of the UK and Norway is attributed to:
- Favorable regulatory environments: Supportive policies and licensing frameworks facilitating investments.
- Robust infrastructure: Existing pipeline networks and port facilities lowering operational costs.
- Skilled workforce: A pool of experienced professionals in the oil and gas sector.
North Sea Region Oil & Gas Industry Product Developments
Recent innovations focus on improving efficiency and reducing environmental impact. This includes advancements in subsea production systems, enhanced oil recovery techniques, and digital technologies for remote operations and predictive maintenance. These developments aim to extend the life of existing fields, optimize production, and improve safety and environmental performance. The market is seeing a rise in demand for cleaner energy, creating opportunities for companies developing and deploying technologies that reduce greenhouse gas emissions.
Key Drivers of North Sea Region Oil & Gas Industry Growth
Growth in the North Sea oil and gas industry is driven by several factors. Technological advancements in exploration and production techniques continue to unlock new reserves and improve efficiency. Favorable government policies in key regions, such as tax incentives and licensing frameworks, encourage investment. The rising global demand for energy, albeit with increasing emphasis on cleaner energy sources, continues to fuel production. Lastly, strategic partnerships between oil and gas companies and renewable energy providers are exploring opportunities for diversification and sustainability.
Challenges in the North Sea Region Oil & Gas Industry Market
The industry faces significant challenges. High operational costs, particularly in challenging offshore environments, impact profitability. Stringent environmental regulations and the need to reduce carbon emissions pose substantial hurdles. Furthermore, the increasing adoption of renewable energy sources creates competitive pressure and uncertainties around future demand. The volatility of oil and gas prices further adds to the operational challenges. These factors contribute to an overall complex and unpredictable market environment.
Emerging Opportunities in North Sea Region Oil & Gas Industry
Opportunities arise from several emerging trends. Technological breakthroughs in carbon capture and storage (CCS) offer pathways to reduce the environmental footprint. The integration of renewable energy sources into existing infrastructure presents significant opportunities for diversification. Strategic partnerships between traditional energy companies and renewable energy providers are fostering innovation and creating new revenue streams. Finally, the exploration of new offshore reserves promises further growth potential in the long term.
Leading Players in the North Sea Region Oil & Gas Industry Sector
- Equinor ASA
- TotalEnergies SE
- BP Plc
- Royal Dutch Shell Plc
- Transocean Ltd
- Baker Hughes Company
- Halliburton Company
- Seadrill Ltd
- Schlumberger Limited
- Valaris PLC
Key Milestones in North Sea Region Oil & Gas Industry Industry
- 2020: Increased focus on ESG (Environmental, Social, and Governance) factors by major players.
- 2021: Significant investments in offshore wind projects by oil and gas companies.
- 2022: Launch of several carbon capture and storage (CCS) pilot projects.
- 2023: Several M&A activities focused on consolidating market share and accessing new technologies.
- 2024: Government policies emphasizing cleaner energy, pushing for increased use of CCS. (Further milestones will be added in the final report)
Strategic Outlook for North Sea Region Oil & Gas Industry Market
The North Sea oil and gas industry faces a period of transition, driven by declining fossil fuel demand and a push towards cleaner energy sources. However, significant opportunities exist for companies that can adapt to the changing market landscape. Investment in CCS technologies, diversification into renewable energy, and strategic partnerships are key to securing future growth. The long-term potential lies in creating a sustainable and low-carbon energy future by integrating offshore wind, carbon capture, and existing infrastructure. The industry will see a shift towards integrated energy solutions.
North Sea Region Oil & Gas Industry Segmentation
-
1. Sector
- 1.1. Upstream
- 1.2. Midstream
- 1.3. Downstream
North Sea Region Oil & Gas Industry Segmentation By Geography
- 1. United Kingdom
- 2. Norway
- 3. Rest of North Sea Region
North Sea Region Oil & Gas Industry REPORT HIGHLIGHTS
| Aspects | Details |
|---|---|
| Study Period | 2019-2033 |
| Base Year | 2024 |
| Estimated Year | 2025 |
| Forecast Period | 2025-2033 |
| Historical Period | 2019-2024 |
| Growth Rate | CAGR of > 3.00% from 2019-2033 |
| Segmentation |
|
Table of Contents
- 1. Introduction
- 1.1. Research Scope
- 1.2. Market Segmentation
- 1.3. Research Methodology
- 1.4. Definitions and Assumptions
- 2. Executive Summary
- 2.1. Introduction
- 3. Market Dynamics
- 3.1. Introduction
- 3.2. Market Drivers
- 3.2.1. 4.; Increased Government Regulations for Greenhouse Gas Emissions 4.; Encouraging Production and Consumption of Renewable Aviation Fuel
- 3.3. Market Restrains
- 3.3.1. 4.; The High Costs of Renewable Aviation Fuel
- 3.4. Market Trends
- 3.4.1. Upstream Sector to Dominate the Market
- 4. Market Factor Analysis
- 4.1. Porters Five Forces
- 4.2. Supply/Value Chain
- 4.3. PESTEL analysis
- 4.4. Market Entropy
- 4.5. Patent/Trademark Analysis
- 5. Global North Sea Region Oil & Gas Industry Analysis, Insights and Forecast, 2019-2031
- 5.1. Market Analysis, Insights and Forecast - by Sector
- 5.1.1. Upstream
- 5.1.2. Midstream
- 5.1.3. Downstream
- 5.2. Market Analysis, Insights and Forecast - by Region
- 5.2.1. United Kingdom
- 5.2.2. Norway
- 5.2.3. Rest of North Sea Region
- 5.1. Market Analysis, Insights and Forecast - by Sector
- 6. United Kingdom North Sea Region Oil & Gas Industry Analysis, Insights and Forecast, 2019-2031
- 6.1. Market Analysis, Insights and Forecast - by Sector
- 6.1.1. Upstream
- 6.1.2. Midstream
- 6.1.3. Downstream
- 6.1. Market Analysis, Insights and Forecast - by Sector
- 7. Norway North Sea Region Oil & Gas Industry Analysis, Insights and Forecast, 2019-2031
- 7.1. Market Analysis, Insights and Forecast - by Sector
- 7.1.1. Upstream
- 7.1.2. Midstream
- 7.1.3. Downstream
- 7.1. Market Analysis, Insights and Forecast - by Sector
- 8. Rest of North Sea Region North Sea Region Oil & Gas Industry Analysis, Insights and Forecast, 2019-2031
- 8.1. Market Analysis, Insights and Forecast - by Sector
- 8.1.1. Upstream
- 8.1.2. Midstream
- 8.1.3. Downstream
- 8.1. Market Analysis, Insights and Forecast - by Sector
- 9. North America North Sea Region Oil & Gas Industry Analysis, Insights and Forecast, 2019-2031
- 9.1. Market Analysis, Insights and Forecast - By Country/Sub-region
- 9.1.1 United States
- 9.1.2 Canada
- 9.1.3 Mexico
- 10. Europe North Sea Region Oil & Gas Industry Analysis, Insights and Forecast, 2019-2031
- 10.1. Market Analysis, Insights and Forecast - By Country/Sub-region
- 10.1.1 Germany
- 10.1.2 United Kingdom
- 10.1.3 France
- 10.1.4 Spain
- 10.1.5 Italy
- 10.1.6 Spain
- 10.1.7 Belgium
- 10.1.8 Netherland
- 10.1.9 Nordics
- 10.1.10 Rest of Europe
- 11. Asia Pacific North Sea Region Oil & Gas Industry Analysis, Insights and Forecast, 2019-2031
- 11.1. Market Analysis, Insights and Forecast - By Country/Sub-region
- 11.1.1 China
- 11.1.2 Japan
- 11.1.3 India
- 11.1.4 South Korea
- 11.1.5 Southeast Asia
- 11.1.6 Australia
- 11.1.7 Indonesia
- 11.1.8 Phillipes
- 11.1.9 Singapore
- 11.1.10 Thailandc
- 11.1.11 Rest of Asia Pacific
- 12. South America North Sea Region Oil & Gas Industry Analysis, Insights and Forecast, 2019-2031
- 12.1. Market Analysis, Insights and Forecast - By Country/Sub-region
- 12.1.1 Brazil
- 12.1.2 Argentina
- 12.1.3 Peru
- 12.1.4 Chile
- 12.1.5 Colombia
- 12.1.6 Ecuador
- 12.1.7 Venezuela
- 12.1.8 Rest of South America
- 13. North America North Sea Region Oil & Gas Industry Analysis, Insights and Forecast, 2019-2031
- 13.1. Market Analysis, Insights and Forecast - By Country/Sub-region
- 13.1.1 United States
- 13.1.2 Canada
- 13.1.3 Mexico
- 14. MEA North Sea Region Oil & Gas Industry Analysis, Insights and Forecast, 2019-2031
- 14.1. Market Analysis, Insights and Forecast - By Country/Sub-region
- 14.1.1 United Arab Emirates
- 14.1.2 Saudi Arabia
- 14.1.3 South Africa
- 14.1.4 Rest of Middle East and Africa
- 15. Competitive Analysis
- 15.1. Global Market Share Analysis 2024
- 15.2. Company Profiles
- 15.2.1 Equinor ASA
- 15.2.1.1. Overview
- 15.2.1.2. Products
- 15.2.1.3. SWOT Analysis
- 15.2.1.4. Recent Developments
- 15.2.1.5. Financials (Based on Availability)
- 15.2.2 Total S A *List Not Exhaustive
- 15.2.2.1. Overview
- 15.2.2.2. Products
- 15.2.2.3. SWOT Analysis
- 15.2.2.4. Recent Developments
- 15.2.2.5. Financials (Based on Availability)
- 15.2.3 BP Plc
- 15.2.3.1. Overview
- 15.2.3.2. Products
- 15.2.3.3. SWOT Analysis
- 15.2.3.4. Recent Developments
- 15.2.3.5. Financials (Based on Availability)
- 15.2.4 Royal Dutch Shell Plc
- 15.2.4.1. Overview
- 15.2.4.2. Products
- 15.2.4.3. SWOT Analysis
- 15.2.4.4. Recent Developments
- 15.2.4.5. Financials (Based on Availability)
- 15.2.5 Transocean Ltd
- 15.2.5.1. Overview
- 15.2.5.2. Products
- 15.2.5.3. SWOT Analysis
- 15.2.5.4. Recent Developments
- 15.2.5.5. Financials (Based on Availability)
- 15.2.6 Baker Hughes Company
- 15.2.6.1. Overview
- 15.2.6.2. Products
- 15.2.6.3. SWOT Analysis
- 15.2.6.4. Recent Developments
- 15.2.6.5. Financials (Based on Availability)
- 15.2.7 Halliburton Company
- 15.2.7.1. Overview
- 15.2.7.2. Products
- 15.2.7.3. SWOT Analysis
- 15.2.7.4. Recent Developments
- 15.2.7.5. Financials (Based on Availability)
- 15.2.8 Seadrill Ltd
- 15.2.8.1. Overview
- 15.2.8.2. Products
- 15.2.8.3. SWOT Analysis
- 15.2.8.4. Recent Developments
- 15.2.8.5. Financials (Based on Availability)
- 15.2.9 Schlumberger Limited
- 15.2.9.1. Overview
- 15.2.9.2. Products
- 15.2.9.3. SWOT Analysis
- 15.2.9.4. Recent Developments
- 15.2.9.5. Financials (Based on Availability)
- 15.2.10 Valaris PLC
- 15.2.10.1. Overview
- 15.2.10.2. Products
- 15.2.10.3. SWOT Analysis
- 15.2.10.4. Recent Developments
- 15.2.10.5. Financials (Based on Availability)
- 15.2.1 Equinor ASA
List of Figures
- Figure 1: Global North Sea Region Oil & Gas Industry Revenue Breakdown (Million, %) by Region 2024 & 2032
- Figure 2: North America North Sea Region Oil & Gas Industry Revenue (Million), by Country 2024 & 2032
- Figure 3: North America North Sea Region Oil & Gas Industry Revenue Share (%), by Country 2024 & 2032
- Figure 4: Europe North Sea Region Oil & Gas Industry Revenue (Million), by Country 2024 & 2032
- Figure 5: Europe North Sea Region Oil & Gas Industry Revenue Share (%), by Country 2024 & 2032
- Figure 6: Asia Pacific North Sea Region Oil & Gas Industry Revenue (Million), by Country 2024 & 2032
- Figure 7: Asia Pacific North Sea Region Oil & Gas Industry Revenue Share (%), by Country 2024 & 2032
- Figure 8: South America North Sea Region Oil & Gas Industry Revenue (Million), by Country 2024 & 2032
- Figure 9: South America North Sea Region Oil & Gas Industry Revenue Share (%), by Country 2024 & 2032
- Figure 10: North America North Sea Region Oil & Gas Industry Revenue (Million), by Country 2024 & 2032
- Figure 11: North America North Sea Region Oil & Gas Industry Revenue Share (%), by Country 2024 & 2032
- Figure 12: MEA North Sea Region Oil & Gas Industry Revenue (Million), by Country 2024 & 2032
- Figure 13: MEA North Sea Region Oil & Gas Industry Revenue Share (%), by Country 2024 & 2032
- Figure 14: United Kingdom North Sea Region Oil & Gas Industry Revenue (Million), by Sector 2024 & 2032
- Figure 15: United Kingdom North Sea Region Oil & Gas Industry Revenue Share (%), by Sector 2024 & 2032
- Figure 16: United Kingdom North Sea Region Oil & Gas Industry Revenue (Million), by Country 2024 & 2032
- Figure 17: United Kingdom North Sea Region Oil & Gas Industry Revenue Share (%), by Country 2024 & 2032
- Figure 18: Norway North Sea Region Oil & Gas Industry Revenue (Million), by Sector 2024 & 2032
- Figure 19: Norway North Sea Region Oil & Gas Industry Revenue Share (%), by Sector 2024 & 2032
- Figure 20: Norway North Sea Region Oil & Gas Industry Revenue (Million), by Country 2024 & 2032
- Figure 21: Norway North Sea Region Oil & Gas Industry Revenue Share (%), by Country 2024 & 2032
- Figure 22: Rest of North Sea Region North Sea Region Oil & Gas Industry Revenue (Million), by Sector 2024 & 2032
- Figure 23: Rest of North Sea Region North Sea Region Oil & Gas Industry Revenue Share (%), by Sector 2024 & 2032
- Figure 24: Rest of North Sea Region North Sea Region Oil & Gas Industry Revenue (Million), by Country 2024 & 2032
- Figure 25: Rest of North Sea Region North Sea Region Oil & Gas Industry Revenue Share (%), by Country 2024 & 2032
List of Tables
- Table 1: Global North Sea Region Oil & Gas Industry Revenue Million Forecast, by Region 2019 & 2032
- Table 2: Global North Sea Region Oil & Gas Industry Revenue Million Forecast, by Sector 2019 & 2032
- Table 3: Global North Sea Region Oil & Gas Industry Revenue Million Forecast, by Region 2019 & 2032
- Table 4: Global North Sea Region Oil & Gas Industry Revenue Million Forecast, by Country 2019 & 2032
- Table 5: United States North Sea Region Oil & Gas Industry Revenue (Million) Forecast, by Application 2019 & 2032
- Table 6: Canada North Sea Region Oil & Gas Industry Revenue (Million) Forecast, by Application 2019 & 2032
- Table 7: Mexico North Sea Region Oil & Gas Industry Revenue (Million) Forecast, by Application 2019 & 2032
- Table 8: Global North Sea Region Oil & Gas Industry Revenue Million Forecast, by Country 2019 & 2032
- Table 9: Germany North Sea Region Oil & Gas Industry Revenue (Million) Forecast, by Application 2019 & 2032
- Table 10: United Kingdom North Sea Region Oil & Gas Industry Revenue (Million) Forecast, by Application 2019 & 2032
- Table 11: France North Sea Region Oil & Gas Industry Revenue (Million) Forecast, by Application 2019 & 2032
- Table 12: Spain North Sea Region Oil & Gas Industry Revenue (Million) Forecast, by Application 2019 & 2032
- Table 13: Italy North Sea Region Oil & Gas Industry Revenue (Million) Forecast, by Application 2019 & 2032
- Table 14: Spain North Sea Region Oil & Gas Industry Revenue (Million) Forecast, by Application 2019 & 2032
- Table 15: Belgium North Sea Region Oil & Gas Industry Revenue (Million) Forecast, by Application 2019 & 2032
- Table 16: Netherland North Sea Region Oil & Gas Industry Revenue (Million) Forecast, by Application 2019 & 2032
- Table 17: Nordics North Sea Region Oil & Gas Industry Revenue (Million) Forecast, by Application 2019 & 2032
- Table 18: Rest of Europe North Sea Region Oil & Gas Industry Revenue (Million) Forecast, by Application 2019 & 2032
- Table 19: Global North Sea Region Oil & Gas Industry Revenue Million Forecast, by Country 2019 & 2032
- Table 20: China North Sea Region Oil & Gas Industry Revenue (Million) Forecast, by Application 2019 & 2032
- Table 21: Japan North Sea Region Oil & Gas Industry Revenue (Million) Forecast, by Application 2019 & 2032
- Table 22: India North Sea Region Oil & Gas Industry Revenue (Million) Forecast, by Application 2019 & 2032
- Table 23: South Korea North Sea Region Oil & Gas Industry Revenue (Million) Forecast, by Application 2019 & 2032
- Table 24: Southeast Asia North Sea Region Oil & Gas Industry Revenue (Million) Forecast, by Application 2019 & 2032
- Table 25: Australia North Sea Region Oil & Gas Industry Revenue (Million) Forecast, by Application 2019 & 2032
- Table 26: Indonesia North Sea Region Oil & Gas Industry Revenue (Million) Forecast, by Application 2019 & 2032
- Table 27: Phillipes North Sea Region Oil & Gas Industry Revenue (Million) Forecast, by Application 2019 & 2032
- Table 28: Singapore North Sea Region Oil & Gas Industry Revenue (Million) Forecast, by Application 2019 & 2032
- Table 29: Thailandc North Sea Region Oil & Gas Industry Revenue (Million) Forecast, by Application 2019 & 2032
- Table 30: Rest of Asia Pacific North Sea Region Oil & Gas Industry Revenue (Million) Forecast, by Application 2019 & 2032
- Table 31: Global North Sea Region Oil & Gas Industry Revenue Million Forecast, by Country 2019 & 2032
- Table 32: Brazil North Sea Region Oil & Gas Industry Revenue (Million) Forecast, by Application 2019 & 2032
- Table 33: Argentina North Sea Region Oil & Gas Industry Revenue (Million) Forecast, by Application 2019 & 2032
- Table 34: Peru North Sea Region Oil & Gas Industry Revenue (Million) Forecast, by Application 2019 & 2032
- Table 35: Chile North Sea Region Oil & Gas Industry Revenue (Million) Forecast, by Application 2019 & 2032
- Table 36: Colombia North Sea Region Oil & Gas Industry Revenue (Million) Forecast, by Application 2019 & 2032
- Table 37: Ecuador North Sea Region Oil & Gas Industry Revenue (Million) Forecast, by Application 2019 & 2032
- Table 38: Venezuela North Sea Region Oil & Gas Industry Revenue (Million) Forecast, by Application 2019 & 2032
- Table 39: Rest of South America North Sea Region Oil & Gas Industry Revenue (Million) Forecast, by Application 2019 & 2032
- Table 40: Global North Sea Region Oil & Gas Industry Revenue Million Forecast, by Country 2019 & 2032
- Table 41: United States North Sea Region Oil & Gas Industry Revenue (Million) Forecast, by Application 2019 & 2032
- Table 42: Canada North Sea Region Oil & Gas Industry Revenue (Million) Forecast, by Application 2019 & 2032
- Table 43: Mexico North Sea Region Oil & Gas Industry Revenue (Million) Forecast, by Application 2019 & 2032
- Table 44: Global North Sea Region Oil & Gas Industry Revenue Million Forecast, by Country 2019 & 2032
- Table 45: United Arab Emirates North Sea Region Oil & Gas Industry Revenue (Million) Forecast, by Application 2019 & 2032
- Table 46: Saudi Arabia North Sea Region Oil & Gas Industry Revenue (Million) Forecast, by Application 2019 & 2032
- Table 47: South Africa North Sea Region Oil & Gas Industry Revenue (Million) Forecast, by Application 2019 & 2032
- Table 48: Rest of Middle East and Africa North Sea Region Oil & Gas Industry Revenue (Million) Forecast, by Application 2019 & 2032
- Table 49: Global North Sea Region Oil & Gas Industry Revenue Million Forecast, by Sector 2019 & 2032
- Table 50: Global North Sea Region Oil & Gas Industry Revenue Million Forecast, by Country 2019 & 2032
- Table 51: Global North Sea Region Oil & Gas Industry Revenue Million Forecast, by Sector 2019 & 2032
- Table 52: Global North Sea Region Oil & Gas Industry Revenue Million Forecast, by Country 2019 & 2032
- Table 53: Global North Sea Region Oil & Gas Industry Revenue Million Forecast, by Sector 2019 & 2032
- Table 54: Global North Sea Region Oil & Gas Industry Revenue Million Forecast, by Country 2019 & 2032
Frequently Asked Questions
1. What is the projected Compound Annual Growth Rate (CAGR) of the North Sea Region Oil & Gas Industry?
The projected CAGR is approximately > 3.00%.
2. Which companies are prominent players in the North Sea Region Oil & Gas Industry?
Key companies in the market include Equinor ASA, Total S A *List Not Exhaustive, BP Plc, Royal Dutch Shell Plc, Transocean Ltd, Baker Hughes Company, Halliburton Company, Seadrill Ltd, Schlumberger Limited, Valaris PLC.
3. What are the main segments of the North Sea Region Oil & Gas Industry?
The market segments include Sector.
4. Can you provide details about the market size?
The market size is estimated to be USD XX Million as of 2022.
5. What are some drivers contributing to market growth?
4.; Increased Government Regulations for Greenhouse Gas Emissions 4.; Encouraging Production and Consumption of Renewable Aviation Fuel.
6. What are the notable trends driving market growth?
Upstream Sector to Dominate the Market.
7. Are there any restraints impacting market growth?
4.; The High Costs of Renewable Aviation Fuel.
8. Can you provide examples of recent developments in the market?
N/A
9. What pricing options are available for accessing the report?
Pricing options include single-user, multi-user, and enterprise licenses priced at USD 4750, USD 5250, and USD 8750 respectively.
10. Is the market size provided in terms of value or volume?
The market size is provided in terms of value, measured in Million.
11. Are there any specific market keywords associated with the report?
Yes, the market keyword associated with the report is "North Sea Region Oil & Gas Industry," which aids in identifying and referencing the specific market segment covered.
12. How do I determine which pricing option suits my needs best?
The pricing options vary based on user requirements and access needs. Individual users may opt for single-user licenses, while businesses requiring broader access may choose multi-user or enterprise licenses for cost-effective access to the report.
13. Are there any additional resources or data provided in the North Sea Region Oil & Gas Industry report?
While the report offers comprehensive insights, it's advisable to review the specific contents or supplementary materials provided to ascertain if additional resources or data are available.
14. How can I stay updated on further developments or reports in the North Sea Region Oil & Gas Industry?
To stay informed about further developments, trends, and reports in the North Sea Region Oil & Gas Industry, consider subscribing to industry newsletters, following relevant companies and organizations, or regularly checking reputable industry news sources and publications.
Methodology
Step 1 - Identification of Relevant Samples Size from Population Database


Step 2 - Approaches for Defining Global Market Size (Value, Volume* & Price*)

Note*: In applicable scenarios
Step 3 - Data Sources
Primary Research
- Web Analytics
- Survey Reports
- Research Institute
- Latest Research Reports
- Opinion Leaders
Secondary Research
- Annual Reports
- White Paper
- Latest Press Release
- Industry Association
- Paid Database
- Investor Presentations

Step 4 - Data Triangulation
Involves using different sources of information in order to increase the validity of a study
These sources are likely to be stakeholders in a program - participants, other researchers, program staff, other community members, and so on.
Then we put all data in single framework & apply various statistical tools to find out the dynamic on the market.
During the analysis stage, feedback from the stakeholder groups would be compared to determine areas of agreement as well as areas of divergence
