

Key Insights
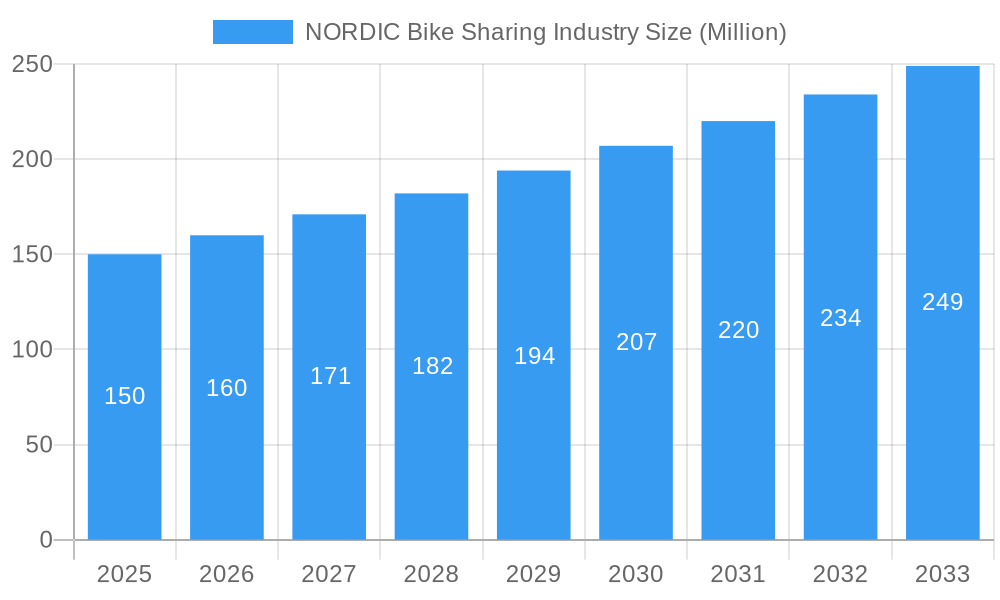
The Nordic bike-sharing market, encompassing Sweden, Norway, Finland, and Denmark, is experiencing robust expansion. This growth is fueled by heightened environmental consciousness, escalating fuel expenses, and the continuous urbanization of cities. The market's projected Compound Annual Growth Rate (CAGR) of 7.8% from a base year of 2024 indicates a significant upward trend. Market segmentation includes bike type (traditional and e-bikes), sharing system (docked and dockless), and geography. E-bikes are a primary growth catalyst, broadening user appeal due to enhanced convenience and the ability to overcome spatial limitations. The proliferation of dockless systems further contributes to market expansion by offering users improved flexibility and accessibility. Key challenges include seasonal usage fluctuations, limited infrastructure in certain locales, and the imperative for stringent maintenance and security protocols to mitigate vandalism and theft. Intense competition among operators such as Smoove and Oslo City Bike necessitates innovative pricing models and service refinements. Future market development is contingent upon sustained technological advancements, supportive governmental policies, and seamless integration with existing public transit networks. The Nordic region's commitment to sustainability and high digital adoption rates create a conducive environment for ongoing growth. With a projected market size of 280 million in 2024, the forecast period (2025-2033) anticipates substantial market expansion.
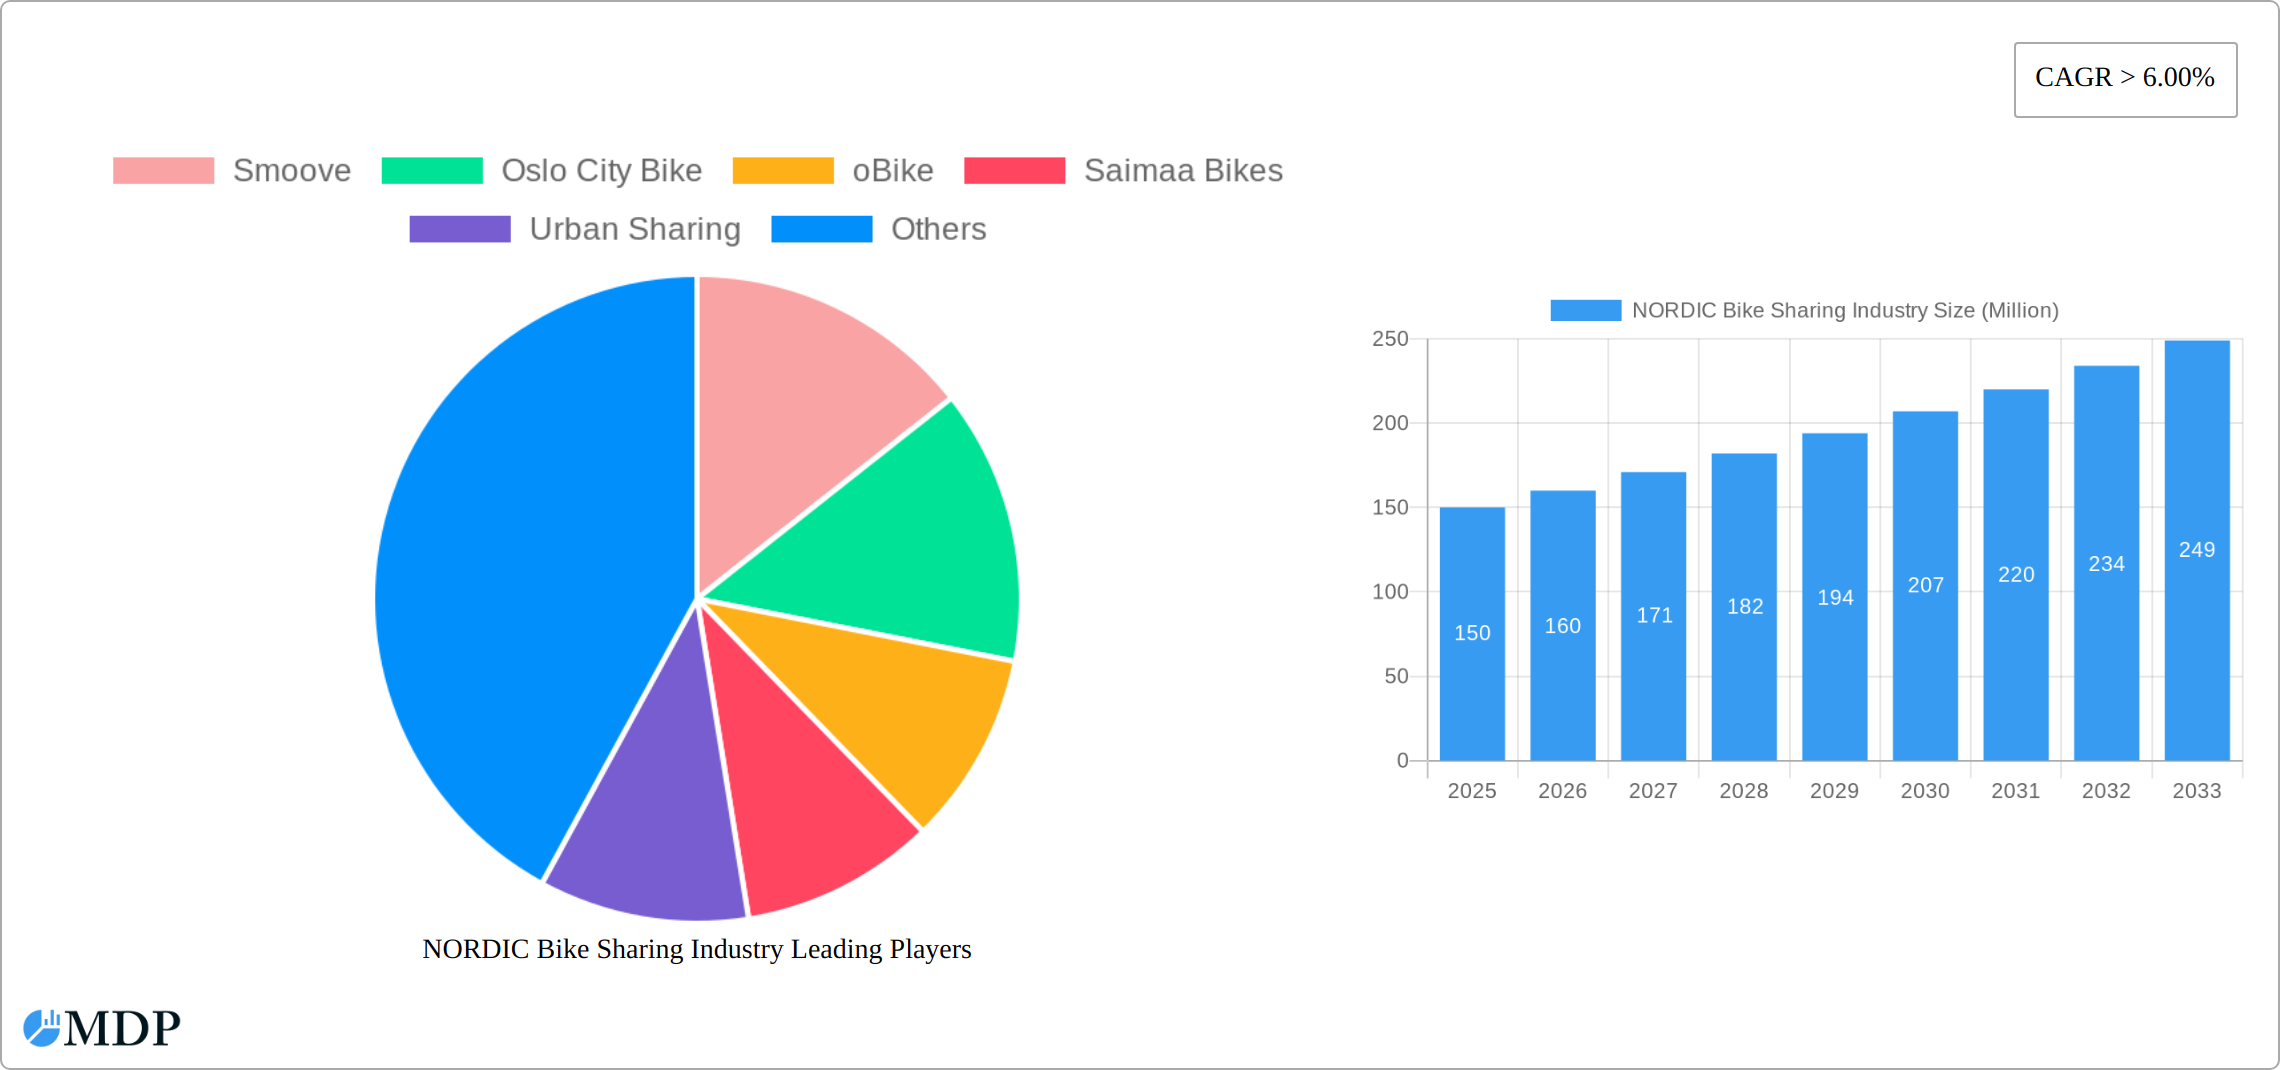
NORDIC Bike Sharing Industry Market Size (In Million)
Effective urban planning that prioritizes integrated cycling infrastructure, addressing safety and accessibility concerns, is critical for the success of Nordic bike-sharing initiatives. The market is poised for further consolidation as operators pursue profitability and economies of scale. Growth opportunities can be unlocked through strategic partnerships with corporations and institutions, thereby expanding the user base beyond daily commuters. The integration of advanced technologies, including enhanced GPS tracking and streamlined payment systems, will significantly improve operational efficiency and user experience. Data analytics will be instrumental in optimizing bike distribution and pricing strategies, maximizing resource utilization and revenue generation. Expansion into peri-urban and rural areas, alongside integration with other micro-mobility solutions, presents additional avenues for market penetration.
NORDIC Bike Sharing Industry Company Market Share
Nordic Bike Sharing Industry: A Comprehensive Market Report (2019-2033)
This in-depth report provides a comprehensive analysis of the Nordic bike-sharing market, offering invaluable insights for stakeholders, investors, and industry professionals. From market dynamics and competitive landscapes to future growth opportunities, this report covers all essential aspects of this rapidly evolving sector. With a detailed forecast extending to 2033, this report is an indispensable resource for navigating the complexities of the Nordic bike-sharing industry. The report utilizes data from the historical period (2019-2024), the base year (2025), and the forecast period (2025-2033), delivering actionable insights for informed decision-making. The total market size in 2025 is estimated at xx Million.
NORDIC Bike Sharing Industry Market Dynamics & Concentration
This section analyzes the market concentration, identifying key players and their market share. We delve into the drivers of innovation, regulatory frameworks shaping the industry, the impact of product substitutes (e.g., private e-scooters, public transport), evolving end-user trends (e.g., micromobility preferences), and the impact of mergers and acquisitions (M&A) activities. The analysis incorporates data on M&A deal counts and market share distribution among key players.
- Market Concentration: The Nordic bike-sharing market is characterized by a moderately fragmented landscape with a few dominant players and numerous smaller operators. The top 5 players account for approximately xx% of the market share in 2025.
- Innovation Drivers: Technological advancements in e-bike technology, improved GPS tracking, and enhanced mobile applications are key innovation drivers.
- Regulatory Framework: Varying regulations across Nordic countries significantly influence market growth and operational strategies. Permitting processes, safety standards, and data privacy regulations are major considerations.
- Product Substitutes: Competition from other micromobility options like e-scooters and ride-hailing services poses a significant challenge to the bike-sharing market.
- End-User Trends: Growing environmental awareness and the increasing popularity of sustainable transportation modes fuel the demand for bike-sharing services.
- M&A Activities: Consolidation within the Nordic bike-sharing market is expected to increase, with larger players acquiring smaller companies to expand their market reach and service offerings. We project xx M&A deals within the forecast period.
NORDIC Bike Sharing Industry Industry Trends & Analysis
This section examines the market growth drivers, technological disruptions reshaping the landscape, shifting consumer preferences, and the complex dynamics of competition within the Nordic region. The analysis includes projections for Compound Annual Growth Rate (CAGR) and market penetration rates.
The Nordic bike-sharing market is witnessing robust growth, driven by factors such as increasing urbanization, government support for sustainable transportation, and the rising popularity of e-bikes. Technological advancements, including improved battery technology and smart locking systems, are enhancing user experience and operational efficiency. Consumer preferences are shifting towards convenient, user-friendly apps and integrated payment systems. The competitive landscape is dynamic, with established players facing challenges from new entrants and alternative micromobility solutions. The CAGR for the forecast period is projected at xx%. Market penetration is expected to reach xx% by 2033.
Leading Markets & Segments in NORDIC Bike Sharing Industry
This section analyzes the key geographic regions, national markets, and service segments driving growth within the Nordic bike-sharing industry. We examine the factors influencing market leadership, including economic policies, infrastructure development, technological advancements, and evolving consumer preferences. A detailed breakdown reveals the nuances of this dynamic sector.
- By Bike Type:
- E-bikes: The surging popularity of e-bikes is reshaping the Nordic landscape. Their ability to conquer hilly terrains and offer convenient, assisted travel is particularly appealing in regions with varied topography. Factors like government incentives and improved battery technology are further fueling this growth segment.
- Traditional Bikes: Traditional bicycles retain a substantial market presence, especially in urban centers boasting well-established cycling infrastructure and a significant population of regular cyclists. Their affordability and simplicity continue to attract users.
- By Sharing System Type:
- Dockless: The flexibility and spontaneous nature of dockless systems have proven highly attractive, boosting their adoption across numerous Nordic cities. This ease of use caters to the on-demand nature of modern urban mobility.
- Docked: While docked systems provide a structured and predictable service, their inherent limitations in terms of flexibility compared to dockless options are noteworthy. However, they still maintain relevance in areas where organized bike parking is a priority.
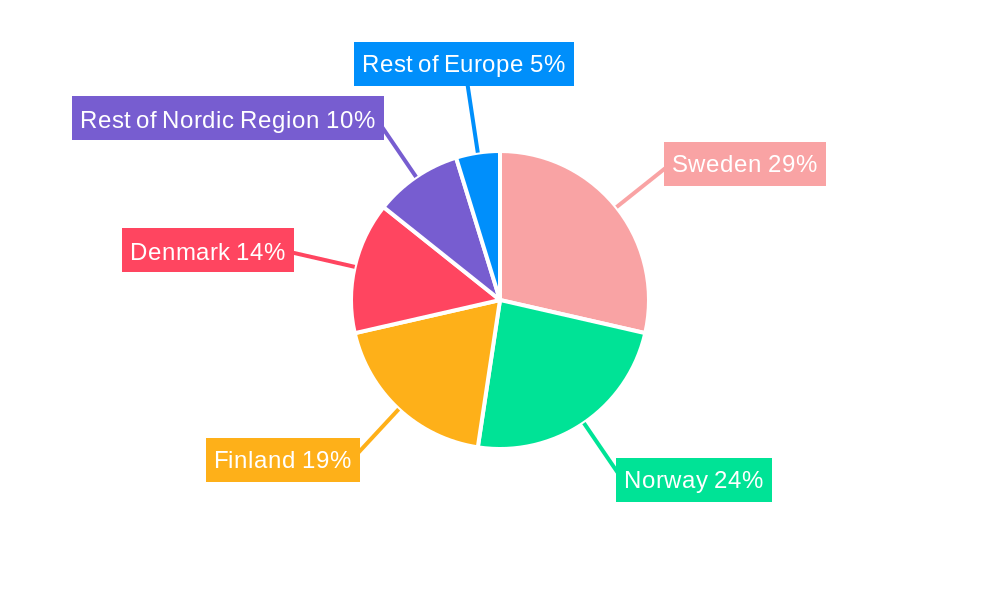
- By Country:
- Denmark: Denmark's leading position stems from a combination of factors: a highly developed cycling infrastructure, proactive government policies that promote cycling, and a strong cycling culture among its citizens.
- Sweden: Sweden's robust market is fuelled by a burgeoning urban population, increasing environmental awareness, and supportive urban planning that prioritizes sustainable transportation options.
- Norway: Norway exhibits substantial growth potential, driven by government initiatives aimed at reducing carbon emissions and encouraging greener commuting options. The country's commitment to sustainable transportation is a key driver.
- Finland: Finland's bike-sharing infrastructure is actively developing, though at a somewhat slower pace than in Denmark and Sweden. However, consistent investment and ongoing improvements indicate a promising future.
- Rest of Nordic Region: This encompasses smaller markets showing moderate but steady growth, often driven by unique local factors and emerging trends.
NORDIC Bike Sharing Industry Product Developments
Recent advancements in e-bike technology are significantly impacting the Nordic bike-sharing landscape. Longer battery life, enhanced durability, and improved safety features are enhancing user experience and operational efficiency. Smart locking mechanisms and integrated GPS tracking bolster security and provide valuable data for optimizing service deployment. Furthermore, the integration of bike-sharing with other micromobility options, such as e-scooters and other forms of shared transport, reflects a broader trend towards integrated urban mobility solutions.
Key Drivers of NORDIC Bike Sharing Industry Growth
Several factors are driving the growth of the Nordic bike-sharing industry. Government initiatives promoting sustainable transportation, coupled with investments in cycling infrastructure, have created a supportive environment for the industry’s expansion. The increasing popularity of e-bikes, combined with advancements in technology, has also contributed to the market's growth. Moreover, rising urban populations and increasing environmental awareness among consumers are driving the demand for bike-sharing services as a convenient and eco-friendly transportation mode.
Challenges in the NORDIC Bike Sharing Industry Market
The Nordic bike-sharing sector faces a multitude of challenges. Regulatory hurdles, including obtaining necessary permits and adhering to stringent safety standards, can impede market expansion. Supply chain disruptions, particularly impacting the availability of crucial e-bike components, create operational bottlenecks. Intense competition from alternative micromobility providers and the substantial costs associated with bike maintenance and replacement exert considerable pressure on profitability. These factors contribute to financial challenges within the industry. (Specific revenue loss figures should be updated with accurate data).
Emerging Opportunities in NORDIC Bike Sharing Industry
Significant long-term growth opportunities exist through strategic collaborations. Partnerships with public transportation authorities and other mobility service providers can create integrated transportation networks. Expanding into underserved areas and integrating bike-sharing with other micromobility options can broaden market reach. Innovations such as smart charging solutions and predictive maintenance optimize operations and reduce costs. Subscription-based models and targeted marketing to niche segments (e.g., tourists) are also promising avenues for growth. Data-driven insights can further inform strategic decision-making and enhance service offerings.
Leading Players in the NORDIC Bike Sharing Industry Sector
- Smoove
- Oslo City Bike
- oBike
- Saimaa Bikes
- Urban Sharing
- Rekola
- Malmö By Bike
- Helsinki City Bikes
- Bycyklen
Key Milestones in NORDIC Bike Sharing Industry Industry
- 2020: Increased adoption of e-bikes across several Nordic cities.
- 2021: Launch of several new bike-sharing schemes in smaller cities.
- 2022: Introduction of subscription-based models by major operators.
- 2023: Integration of bike-sharing with other micromobility options by leading players.
- 2024: Government initiatives promoting the use of bike-sharing.
Strategic Outlook for NORDIC Bike Sharing Industry Market
The future of the Nordic bike-sharing market looks promising, driven by continued technological advancements, supportive government policies, and growing consumer demand for sustainable transportation options. Strategic partnerships, market expansion into new geographic areas, and the development of innovative business models will be critical for sustained growth and profitability. The market is poised for further expansion, with increasing opportunities for players to capitalize on the growing demand for environmentally friendly and efficient transportation solutions.
NORDIC Bike Sharing Industry Segmentation
-
1. Bike Type
- 1.1. Traditional/Regular Bike
- 1.2. E-bike
-
2. Sharing System Type
- 2.1. Docked
- 2.2. Dockless
NORDIC Bike Sharing Industry Segmentation By Geography
-
1. North America
- 1.1. United States
- 1.2. Canada
- 1.3. Mexico
-
2. South America
- 2.1. Brazil
- 2.2. Argentina
- 2.3. Rest of South America
-
3. Europe
- 3.1. United Kingdom
- 3.2. Germany
- 3.3. France
- 3.4. Italy
- 3.5. Spain
- 3.6. Russia
- 3.7. Benelux
- 3.8. Nordics
- 3.9. Rest of Europe
-
4. Middle East & Africa
- 4.1. Turkey
- 4.2. Israel
- 4.3. GCC
- 4.4. North Africa
- 4.5. South Africa
- 4.6. Rest of Middle East & Africa
-
5. Asia Pacific
- 5.1. China
- 5.2. India
- 5.3. Japan
- 5.4. South Korea
- 5.5. ASEAN
- 5.6. Oceania
- 5.7. Rest of Asia Pacific
NORDIC Bike Sharing Industry Regional Market Share
Geographic Coverage of NORDIC Bike Sharing Industry
NORDIC Bike Sharing Industry REPORT HIGHLIGHTS
| Aspects | Details |
|---|---|
| Study Period | 2020-2034 |
| Base Year | 2025 |
| Estimated Year | 2026 |
| Forecast Period | 2026-2034 |
| Historical Period | 2020-2025 |
| Growth Rate | CAGR of 7.8% from 2020-2034 |
| Segmentation |
|
Table of Contents
- 1. Introduction
- 1.1. Research Scope
- 1.2. Market Segmentation
- 1.3. Research Methodology
- 1.4. Definitions and Assumptions
- 2. Executive Summary
- 2.1. Introduction
- 3. Market Dynamics
- 3.1. Introduction
- 3.2. Market Drivers
- 3.2.1. Government Policies to promote electric Vehicles Sales
- 3.3. Market Restrains
- 3.3.1. High Cost of Capital Expenditure for Electric Vehicle Infrastructure
- 3.4. Market Trends
- 3.4.1. E-Bike Rentalis Providing the Growth in Market
- 4. Market Factor Analysis
- 4.1. Porters Five Forces
- 4.2. Supply/Value Chain
- 4.3. PESTEL analysis
- 4.4. Market Entropy
- 4.5. Patent/Trademark Analysis
- 5. Global NORDIC Bike Sharing Industry Analysis, Insights and Forecast, 2020-2032
- 5.1. Market Analysis, Insights and Forecast - by Bike Type
- 5.1.1. Traditional/Regular Bike
- 5.1.2. E-bike
- 5.2. Market Analysis, Insights and Forecast - by Sharing System Type
- 5.2.1. Docked
- 5.2.2. Dockless
- 5.3. Market Analysis, Insights and Forecast - by Region
- 5.3.1. North America
- 5.3.2. South America
- 5.3.3. Europe
- 5.3.4. Middle East & Africa
- 5.3.5. Asia Pacific
- 5.1. Market Analysis, Insights and Forecast - by Bike Type
- 6. North America NORDIC Bike Sharing Industry Analysis, Insights and Forecast, 2020-2032
- 6.1. Market Analysis, Insights and Forecast - by Bike Type
- 6.1.1. Traditional/Regular Bike
- 6.1.2. E-bike
- 6.2. Market Analysis, Insights and Forecast - by Sharing System Type
- 6.2.1. Docked
- 6.2.2. Dockless
- 6.1. Market Analysis, Insights and Forecast - by Bike Type
- 7. South America NORDIC Bike Sharing Industry Analysis, Insights and Forecast, 2020-2032
- 7.1. Market Analysis, Insights and Forecast - by Bike Type
- 7.1.1. Traditional/Regular Bike
- 7.1.2. E-bike
- 7.2. Market Analysis, Insights and Forecast - by Sharing System Type
- 7.2.1. Docked
- 7.2.2. Dockless
- 7.1. Market Analysis, Insights and Forecast - by Bike Type
- 8. Europe NORDIC Bike Sharing Industry Analysis, Insights and Forecast, 2020-2032
- 8.1. Market Analysis, Insights and Forecast - by Bike Type
- 8.1.1. Traditional/Regular Bike
- 8.1.2. E-bike
- 8.2. Market Analysis, Insights and Forecast - by Sharing System Type
- 8.2.1. Docked
- 8.2.2. Dockless
- 8.1. Market Analysis, Insights and Forecast - by Bike Type
- 9. Middle East & Africa NORDIC Bike Sharing Industry Analysis, Insights and Forecast, 2020-2032
- 9.1. Market Analysis, Insights and Forecast - by Bike Type
- 9.1.1. Traditional/Regular Bike
- 9.1.2. E-bike
- 9.2. Market Analysis, Insights and Forecast - by Sharing System Type
- 9.2.1. Docked
- 9.2.2. Dockless
- 9.1. Market Analysis, Insights and Forecast - by Bike Type
- 10. Asia Pacific NORDIC Bike Sharing Industry Analysis, Insights and Forecast, 2020-2032
- 10.1. Market Analysis, Insights and Forecast - by Bike Type
- 10.1.1. Traditional/Regular Bike
- 10.1.2. E-bike
- 10.2. Market Analysis, Insights and Forecast - by Sharing System Type
- 10.2.1. Docked
- 10.2.2. Dockless
- 10.1. Market Analysis, Insights and Forecast - by Bike Type
- 11. Competitive Analysis
- 11.1. Global Market Share Analysis 2025
- 11.2. Company Profiles
- 11.2.1 Smoove
- 11.2.1.1. Overview
- 11.2.1.2. Products
- 11.2.1.3. SWOT Analysis
- 11.2.1.4. Recent Developments
- 11.2.1.5. Financials (Based on Availability)
- 11.2.2 Oslo City Bike
- 11.2.2.1. Overview
- 11.2.2.2. Products
- 11.2.2.3. SWOT Analysis
- 11.2.2.4. Recent Developments
- 11.2.2.5. Financials (Based on Availability)
- 11.2.3 oBike
- 11.2.3.1. Overview
- 11.2.3.2. Products
- 11.2.3.3. SWOT Analysis
- 11.2.3.4. Recent Developments
- 11.2.3.5. Financials (Based on Availability)
- 11.2.4 Saimaa Bikes
- 11.2.4.1. Overview
- 11.2.4.2. Products
- 11.2.4.3. SWOT Analysis
- 11.2.4.4. Recent Developments
- 11.2.4.5. Financials (Based on Availability)
- 11.2.5 Urban Sharing
- 11.2.5.1. Overview
- 11.2.5.2. Products
- 11.2.5.3. SWOT Analysis
- 11.2.5.4. Recent Developments
- 11.2.5.5. Financials (Based on Availability)
- 11.2.6 Rekola
- 11.2.6.1. Overview
- 11.2.6.2. Products
- 11.2.6.3. SWOT Analysis
- 11.2.6.4. Recent Developments
- 11.2.6.5. Financials (Based on Availability)
- 11.2.7 Malmo By Bike
- 11.2.7.1. Overview
- 11.2.7.2. Products
- 11.2.7.3. SWOT Analysis
- 11.2.7.4. Recent Developments
- 11.2.7.5. Financials (Based on Availability)
- 11.2.8 Helsinki City bikes
- 11.2.8.1. Overview
- 11.2.8.2. Products
- 11.2.8.3. SWOT Analysis
- 11.2.8.4. Recent Developments
- 11.2.8.5. Financials (Based on Availability)
- 11.2.9 Bycyklen*List Not Exhaustive
- 11.2.9.1. Overview
- 11.2.9.2. Products
- 11.2.9.3. SWOT Analysis
- 11.2.9.4. Recent Developments
- 11.2.9.5. Financials (Based on Availability)
- 11.2.1 Smoove
List of Figures
- Figure 1: Global NORDIC Bike Sharing Industry Revenue Breakdown (million, %) by Region 2025 & 2033
- Figure 2: North America NORDIC Bike Sharing Industry Revenue (million), by Bike Type 2025 & 2033
- Figure 3: North America NORDIC Bike Sharing Industry Revenue Share (%), by Bike Type 2025 & 2033
- Figure 4: North America NORDIC Bike Sharing Industry Revenue (million), by Sharing System Type 2025 & 2033
- Figure 5: North America NORDIC Bike Sharing Industry Revenue Share (%), by Sharing System Type 2025 & 2033
- Figure 6: North America NORDIC Bike Sharing Industry Revenue (million), by Country 2025 & 2033
- Figure 7: North America NORDIC Bike Sharing Industry Revenue Share (%), by Country 2025 & 2033
- Figure 8: South America NORDIC Bike Sharing Industry Revenue (million), by Bike Type 2025 & 2033
- Figure 9: South America NORDIC Bike Sharing Industry Revenue Share (%), by Bike Type 2025 & 2033
- Figure 10: South America NORDIC Bike Sharing Industry Revenue (million), by Sharing System Type 2025 & 2033
- Figure 11: South America NORDIC Bike Sharing Industry Revenue Share (%), by Sharing System Type 2025 & 2033
- Figure 12: South America NORDIC Bike Sharing Industry Revenue (million), by Country 2025 & 2033
- Figure 13: South America NORDIC Bike Sharing Industry Revenue Share (%), by Country 2025 & 2033
- Figure 14: Europe NORDIC Bike Sharing Industry Revenue (million), by Bike Type 2025 & 2033
- Figure 15: Europe NORDIC Bike Sharing Industry Revenue Share (%), by Bike Type 2025 & 2033
- Figure 16: Europe NORDIC Bike Sharing Industry Revenue (million), by Sharing System Type 2025 & 2033
- Figure 17: Europe NORDIC Bike Sharing Industry Revenue Share (%), by Sharing System Type 2025 & 2033
- Figure 18: Europe NORDIC Bike Sharing Industry Revenue (million), by Country 2025 & 2033
- Figure 19: Europe NORDIC Bike Sharing Industry Revenue Share (%), by Country 2025 & 2033
- Figure 20: Middle East & Africa NORDIC Bike Sharing Industry Revenue (million), by Bike Type 2025 & 2033
- Figure 21: Middle East & Africa NORDIC Bike Sharing Industry Revenue Share (%), by Bike Type 2025 & 2033
- Figure 22: Middle East & Africa NORDIC Bike Sharing Industry Revenue (million), by Sharing System Type 2025 & 2033
- Figure 23: Middle East & Africa NORDIC Bike Sharing Industry Revenue Share (%), by Sharing System Type 2025 & 2033
- Figure 24: Middle East & Africa NORDIC Bike Sharing Industry Revenue (million), by Country 2025 & 2033
- Figure 25: Middle East & Africa NORDIC Bike Sharing Industry Revenue Share (%), by Country 2025 & 2033
- Figure 26: Asia Pacific NORDIC Bike Sharing Industry Revenue (million), by Bike Type 2025 & 2033
- Figure 27: Asia Pacific NORDIC Bike Sharing Industry Revenue Share (%), by Bike Type 2025 & 2033
- Figure 28: Asia Pacific NORDIC Bike Sharing Industry Revenue (million), by Sharing System Type 2025 & 2033
- Figure 29: Asia Pacific NORDIC Bike Sharing Industry Revenue Share (%), by Sharing System Type 2025 & 2033
- Figure 30: Asia Pacific NORDIC Bike Sharing Industry Revenue (million), by Country 2025 & 2033
- Figure 31: Asia Pacific NORDIC Bike Sharing Industry Revenue Share (%), by Country 2025 & 2033
List of Tables
- Table 1: Global NORDIC Bike Sharing Industry Revenue million Forecast, by Bike Type 2020 & 2033
- Table 2: Global NORDIC Bike Sharing Industry Revenue million Forecast, by Sharing System Type 2020 & 2033
- Table 3: Global NORDIC Bike Sharing Industry Revenue million Forecast, by Region 2020 & 2033
- Table 4: Global NORDIC Bike Sharing Industry Revenue million Forecast, by Bike Type 2020 & 2033
- Table 5: Global NORDIC Bike Sharing Industry Revenue million Forecast, by Sharing System Type 2020 & 2033
- Table 6: Global NORDIC Bike Sharing Industry Revenue million Forecast, by Country 2020 & 2033
- Table 7: United States NORDIC Bike Sharing Industry Revenue (million) Forecast, by Application 2020 & 2033
- Table 8: Canada NORDIC Bike Sharing Industry Revenue (million) Forecast, by Application 2020 & 2033
- Table 9: Mexico NORDIC Bike Sharing Industry Revenue (million) Forecast, by Application 2020 & 2033
- Table 10: Global NORDIC Bike Sharing Industry Revenue million Forecast, by Bike Type 2020 & 2033
- Table 11: Global NORDIC Bike Sharing Industry Revenue million Forecast, by Sharing System Type 2020 & 2033
- Table 12: Global NORDIC Bike Sharing Industry Revenue million Forecast, by Country 2020 & 2033
- Table 13: Brazil NORDIC Bike Sharing Industry Revenue (million) Forecast, by Application 2020 & 2033
- Table 14: Argentina NORDIC Bike Sharing Industry Revenue (million) Forecast, by Application 2020 & 2033
- Table 15: Rest of South America NORDIC Bike Sharing Industry Revenue (million) Forecast, by Application 2020 & 2033
- Table 16: Global NORDIC Bike Sharing Industry Revenue million Forecast, by Bike Type 2020 & 2033
- Table 17: Global NORDIC Bike Sharing Industry Revenue million Forecast, by Sharing System Type 2020 & 2033
- Table 18: Global NORDIC Bike Sharing Industry Revenue million Forecast, by Country 2020 & 2033
- Table 19: United Kingdom NORDIC Bike Sharing Industry Revenue (million) Forecast, by Application 2020 & 2033
- Table 20: Germany NORDIC Bike Sharing Industry Revenue (million) Forecast, by Application 2020 & 2033
- Table 21: France NORDIC Bike Sharing Industry Revenue (million) Forecast, by Application 2020 & 2033
- Table 22: Italy NORDIC Bike Sharing Industry Revenue (million) Forecast, by Application 2020 & 2033
- Table 23: Spain NORDIC Bike Sharing Industry Revenue (million) Forecast, by Application 2020 & 2033
- Table 24: Russia NORDIC Bike Sharing Industry Revenue (million) Forecast, by Application 2020 & 2033
- Table 25: Benelux NORDIC Bike Sharing Industry Revenue (million) Forecast, by Application 2020 & 2033
- Table 26: Nordics NORDIC Bike Sharing Industry Revenue (million) Forecast, by Application 2020 & 2033
- Table 27: Rest of Europe NORDIC Bike Sharing Industry Revenue (million) Forecast, by Application 2020 & 2033
- Table 28: Global NORDIC Bike Sharing Industry Revenue million Forecast, by Bike Type 2020 & 2033
- Table 29: Global NORDIC Bike Sharing Industry Revenue million Forecast, by Sharing System Type 2020 & 2033
- Table 30: Global NORDIC Bike Sharing Industry Revenue million Forecast, by Country 2020 & 2033
- Table 31: Turkey NORDIC Bike Sharing Industry Revenue (million) Forecast, by Application 2020 & 2033
- Table 32: Israel NORDIC Bike Sharing Industry Revenue (million) Forecast, by Application 2020 & 2033
- Table 33: GCC NORDIC Bike Sharing Industry Revenue (million) Forecast, by Application 2020 & 2033
- Table 34: North Africa NORDIC Bike Sharing Industry Revenue (million) Forecast, by Application 2020 & 2033
- Table 35: South Africa NORDIC Bike Sharing Industry Revenue (million) Forecast, by Application 2020 & 2033
- Table 36: Rest of Middle East & Africa NORDIC Bike Sharing Industry Revenue (million) Forecast, by Application 2020 & 2033
- Table 37: Global NORDIC Bike Sharing Industry Revenue million Forecast, by Bike Type 2020 & 2033
- Table 38: Global NORDIC Bike Sharing Industry Revenue million Forecast, by Sharing System Type 2020 & 2033
- Table 39: Global NORDIC Bike Sharing Industry Revenue million Forecast, by Country 2020 & 2033
- Table 40: China NORDIC Bike Sharing Industry Revenue (million) Forecast, by Application 2020 & 2033
- Table 41: India NORDIC Bike Sharing Industry Revenue (million) Forecast, by Application 2020 & 2033
- Table 42: Japan NORDIC Bike Sharing Industry Revenue (million) Forecast, by Application 2020 & 2033
- Table 43: South Korea NORDIC Bike Sharing Industry Revenue (million) Forecast, by Application 2020 & 2033
- Table 44: ASEAN NORDIC Bike Sharing Industry Revenue (million) Forecast, by Application 2020 & 2033
- Table 45: Oceania NORDIC Bike Sharing Industry Revenue (million) Forecast, by Application 2020 & 2033
- Table 46: Rest of Asia Pacific NORDIC Bike Sharing Industry Revenue (million) Forecast, by Application 2020 & 2033
Frequently Asked Questions
1. What is the projected Compound Annual Growth Rate (CAGR) of the NORDIC Bike Sharing Industry?
The projected CAGR is approximately 7.8%.
2. Which companies are prominent players in the NORDIC Bike Sharing Industry?
Key companies in the market include Smoove, Oslo City Bike, oBike, Saimaa Bikes, Urban Sharing, Rekola, Malmo By Bike, Helsinki City bikes, Bycyklen*List Not Exhaustive.
3. What are the main segments of the NORDIC Bike Sharing Industry?
The market segments include Bike Type, Sharing System Type.
4. Can you provide details about the market size?
The market size is estimated to be USD 280 million as of 2022.
5. What are some drivers contributing to market growth?
Government Policies to promote electric Vehicles Sales.
6. What are the notable trends driving market growth?
E-Bike Rentalis Providing the Growth in Market.
7. Are there any restraints impacting market growth?
High Cost of Capital Expenditure for Electric Vehicle Infrastructure.
8. Can you provide examples of recent developments in the market?
N/A
9. What pricing options are available for accessing the report?
Pricing options include single-user, multi-user, and enterprise licenses priced at USD 3800, USD 4500, and USD 5800 respectively.
10. Is the market size provided in terms of value or volume?
The market size is provided in terms of value, measured in million.
11. Are there any specific market keywords associated with the report?
Yes, the market keyword associated with the report is "NORDIC Bike Sharing Industry," which aids in identifying and referencing the specific market segment covered.
12. How do I determine which pricing option suits my needs best?
The pricing options vary based on user requirements and access needs. Individual users may opt for single-user licenses, while businesses requiring broader access may choose multi-user or enterprise licenses for cost-effective access to the report.
13. Are there any additional resources or data provided in the NORDIC Bike Sharing Industry report?
While the report offers comprehensive insights, it's advisable to review the specific contents or supplementary materials provided to ascertain if additional resources or data are available.
14. How can I stay updated on further developments or reports in the NORDIC Bike Sharing Industry?
To stay informed about further developments, trends, and reports in the NORDIC Bike Sharing Industry, consider subscribing to industry newsletters, following relevant companies and organizations, or regularly checking reputable industry news sources and publications.
Methodology
Step 1 - Identification of Relevant Samples Size from Population Database


Step 2 - Approaches for Defining Global Market Size (Value, Volume* & Price*)

Note*: In applicable scenarios
Step 3 - Data Sources
Primary Research
- Web Analytics
- Survey Reports
- Research Institute
- Latest Research Reports
- Opinion Leaders
Secondary Research
- Annual Reports
- White Paper
- Latest Press Release
- Industry Association
- Paid Database
- Investor Presentations

Step 4 - Data Triangulation
Involves using different sources of information in order to increase the validity of a study
These sources are likely to be stakeholders in a program - participants, other researchers, program staff, other community members, and so on.
Then we put all data in single framework & apply various statistical tools to find out the dynamic on the market.
During the analysis stage, feedback from the stakeholder groups would be compared to determine areas of agreement as well as areas of divergence