

Key Insights
The Nitinol medical device market, valued at $7.68 billion in 2024, is projected to expand at a Compound Annual Growth Rate (CAGR) of 7.1% from 2024 to 2033. This growth is primarily attributed to the rising incidence of cardiovascular and urological diseases worldwide, driving demand for minimally invasive procedures. Nitinol's unique shape memory and superelastic properties make it ideal for such applications. Technological innovations in stent designs, guidewires, and baskets, coupled with advancements in imaging techniques, further enhance market penetration and procedural efficacy. Cardiovascular applications currently lead market segmentation, followed by urology and dentistry, with stents being the dominant product segment due to Nitinol's biocompatibility and strength in vascular interventions.
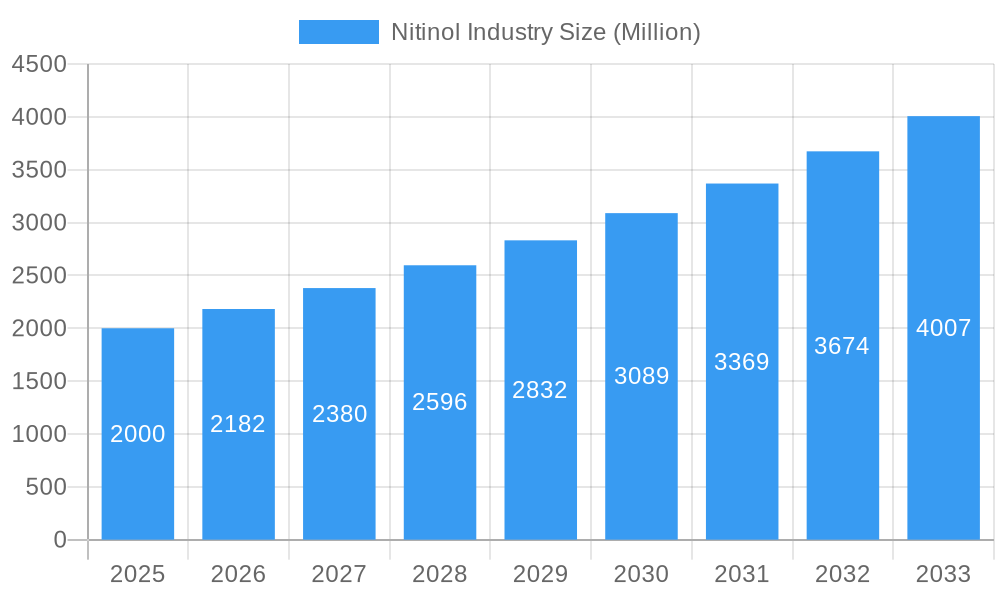
Nitinol Industry Market Size (In Billion)
Key market restraints include the higher cost of Nitinol devices compared to alternatives, potentially limiting access in developing economies, and stringent regulatory approval processes. Device-related complications also present a challenge. Nevertheless, ongoing research and development focused on enhancing Nitinol's biocompatibility, durability, and functionality are expected to address these limitations and support sustained market expansion. The competitive environment features established players such as Cook Medical, Boston Scientific, and Terumo Corporation, alongside emerging companies introducing specialized technologies. North America and Europe are anticipated to retain substantial market shares, while the Asia-Pacific region is poised for the fastest growth, driven by increased healthcare expenditure and a rising prevalence of target medical conditions.
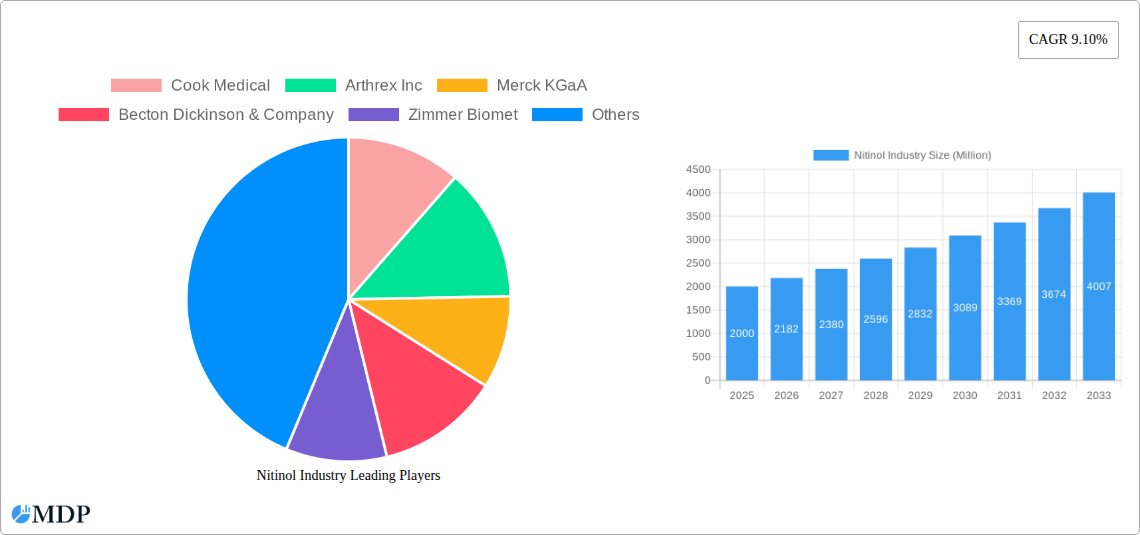
Nitinol Industry Company Market Share
Nitinol Industry Market Report: 2019-2033 Forecast
Dive deep into the dynamic Nitinol industry with this comprehensive market report, projecting a market value of $XX Million by 2033. This in-depth analysis covers market dynamics, leading players, technological advancements, and future growth opportunities within the $XX Million Nitinol market. Benefit from actionable insights to inform strategic decisions and gain a competitive edge. The report examines the period from 2019 to 2033, with a focus on the 2025-2033 forecast.
Nitinol Industry Market Dynamics & Concentration
The Nitinol industry, valued at $XX Million in 2024, is characterized by moderate concentration, with key players like Cook Medical, Arthrex Inc, Merck KGaA, Becton Dickinson & Company, Zimmer Biomet, and others commanding significant market share. The industry's growth is driven by continuous innovation in medical device technology, stringent regulatory frameworks ensuring product safety, and the growing demand for minimally invasive surgical procedures. Substitute materials exist, but Nitinol's unique shape-memory properties offer significant advantages. End-user trends favor advanced devices with improved efficacy and patient outcomes. Mergers and acquisitions (M&A) activity has been moderate in recent years, with notable transactions shaping the competitive landscape.
- Market Concentration: The top 5 players hold approximately XX% of the market share in 2024.
- M&A Activity: Over the historical period (2019-2024), approximately XX M&A deals were recorded in the Nitinol industry.
- Innovation Drivers: Advances in material science, miniaturization techniques, and improved biocompatibility are key innovation drivers.
- Regulatory Landscape: Stringent regulatory approvals and quality control measures influence market entry and product development.
Nitinol Industry Trends & Analysis
The Nitinol industry exhibits a robust CAGR of XX% during the forecast period (2025-2033), driven by a burgeoning demand for minimally invasive medical procedures and technological advancements. The market penetration of Nitinol-based devices is increasing across various applications, particularly in cardiovascular and urology. Technological disruptions, such as the development of advanced coatings and surface modifications, enhance biocompatibility and device performance, boosting market growth. Consumer preferences are shifting toward personalized medicine and advanced treatment options, fueling the demand for sophisticated Nitinol-based devices. The competitive landscape is characterized by fierce competition among established players and emerging companies vying for market share.
Leading Markets & Segments in Nitinol Industry
The cardiovascular segment holds the largest market share within the Nitinol industry, followed by urology and dentistry. Geographically, North America and Europe dominate the market due to high healthcare expenditure and advanced medical infrastructure. Asia-Pacific is witnessing significant growth owing to rising disposable incomes and growing healthcare awareness.
- Key Drivers in North America: Strong R&D investments, robust healthcare infrastructure, and favorable regulatory environment.
- Key Drivers in Europe: High healthcare expenditure, stringent regulatory approvals, and well-established medical device industry.
- Key Drivers in Asia-Pacific: Rising disposable incomes, increasing healthcare awareness, and government initiatives to improve healthcare infrastructure.
- Dominant Product Type: Stents account for the largest market share within product types due to their extensive use in cardiovascular procedures.
- Dominant Application: Cardiovascular applications account for the largest market share of Nitinol utilization.
Nitinol Industry Product Developments
Recent years have witnessed significant product innovation in the Nitinol industry, focusing on improving device performance, biocompatibility, and patient outcomes. Advanced coatings, surface modifications, and novel designs are enhancing device functionality and expanding applications. This ongoing innovation ensures that Nitinol continues to be a preferred material for advanced medical devices, strengthening its competitive advantage in the market.
Key Drivers of Nitinol Industry Growth
Several factors contribute to the Nitinol industry's growth, including:
- Technological advancements leading to improved device performance and biocompatibility.
- Rising prevalence of chronic diseases, fueling demand for minimally invasive procedures.
- Favorable regulatory environment and increasing government support for medical device innovation.
- Growing adoption of minimally invasive surgeries across various medical specialties.
Challenges in the Nitinol Industry Market
The Nitinol industry faces challenges such as:
- Stringent regulatory requirements and lengthy approval processes.
- Potential supply chain disruptions affecting the availability of raw materials.
- Intense competition from established players and new market entrants.
- Fluctuations in raw material prices impacting overall product costs.
Emerging Opportunities in Nitinol Industry
The Nitinol industry is poised for significant growth driven by:
- Technological breakthroughs in material science and device design.
- Expansion into new applications and emerging markets.
- Strategic partnerships and collaborations among industry players.
- Increasing investment in research and development to improve device performance and safety.
Leading Players in the Nitinol Industry Sector
Key Milestones in Nitinol Industry Industry
- November 2022: Alleima acquired Endosmart, expanding its portfolio of Nitinol-based medical devices. This acquisition strengthened Alleima's position in the market and broadened its product offerings.
- May 2022: Stryker Corporation launched its EasyFuse Dynamic Compression System, leveraging Nitinol's unique properties to improve surgical efficiency. This launch showcased the continued innovation and application of Nitinol in medical devices.
Strategic Outlook for Nitinol Industry Market
The Nitinol industry is poised for continued growth, driven by technological advancements, expanding applications, and strategic partnerships. Future market potential is significant, particularly in emerging markets and specialized medical applications. Companies focusing on innovation, strategic collaborations, and efficient manufacturing processes will be well-positioned to capitalize on future growth opportunities.
Nitinol Industry Segmentation
-
1. Product Type
- 1.1. Stents
- 1.2. Baskets
- 1.3. Guidewires
- 1.4. Other Products
-
2. Application
- 2.1. Cardiovascular
- 2.2. Urology
- 2.3. Dentistry
- 2.4. Other Products
Nitinol Industry Segmentation By Geography
-
1. North America
- 1.1. United States
- 1.2. Canada
- 1.3. Mexico
-
2. Europe
- 2.1. Germany
- 2.2. United Kingdom
- 2.3. France
- 2.4. Italy
- 2.5. Spain
- 2.6. Rest of Europe
-
3. Asia Pacific
- 3.1. China
- 3.2. Japan
- 3.3. India
- 3.4. Australia
- 3.5. South Korea
- 3.6. Rest of Asia Pacific
-
4. Middle East and Africa
- 4.1. GCC
- 4.2. South Africa
- 4.3. Rest of Middle East and Africa
-
5. South America
- 5.1. Brazil
- 5.2. Argentina
- 5.3. Rest of South America
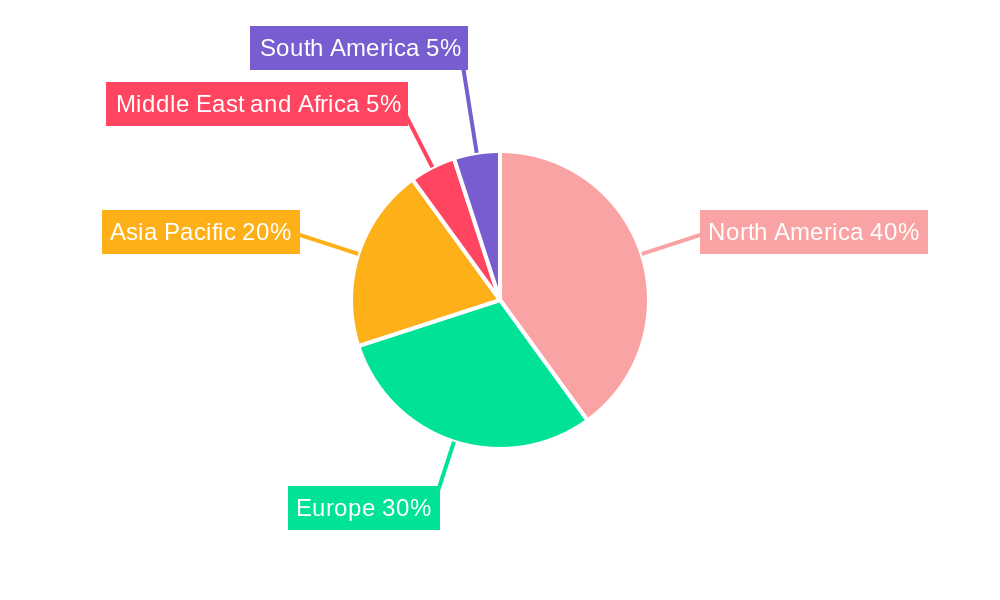
Nitinol Industry Regional Market Share
Geographic Coverage of Nitinol Industry
Nitinol Industry REPORT HIGHLIGHTS
| Aspects | Details |
|---|---|
| Study Period | 2020-2034 |
| Base Year | 2025 |
| Estimated Year | 2026 |
| Forecast Period | 2026-2034 |
| Historical Period | 2020-2025 |
| Growth Rate | CAGR of 7.1% from 2020-2034 |
| Segmentation |
|
Table of Contents
- 1. Introduction
- 1.1. Research Scope
- 1.2. Market Segmentation
- 1.3. Research Methodology
- 1.4. Definitions and Assumptions
- 2. Executive Summary
- 2.1. Introduction
- 3. Market Dynamics
- 3.1. Introduction
- 3.2. Market Drivers
- 3.2.1. Growing Burden of Chronic Diseases; Rising Preference for Minimally Invasive Surgeries
- 3.3. Market Restrains
- 3.3.1. High-cost of Devices; Presence of Alternative Devices
- 3.4. Market Trends
- 3.4.1. Stents Segment to Witness Significant Growth over the Forecast Period.
- 4. Market Factor Analysis
- 4.1. Porters Five Forces
- 4.2. Supply/Value Chain
- 4.3. PESTEL analysis
- 4.4. Market Entropy
- 4.5. Patent/Trademark Analysis
- 5. Global Nitinol Industry Analysis, Insights and Forecast, 2020-2032
- 5.1. Market Analysis, Insights and Forecast - by Product Type
- 5.1.1. Stents
- 5.1.2. Baskets
- 5.1.3. Guidewires
- 5.1.4. Other Products
- 5.2. Market Analysis, Insights and Forecast - by Application
- 5.2.1. Cardiovascular
- 5.2.2. Urology
- 5.2.3. Dentistry
- 5.2.4. Other Products
- 5.3. Market Analysis, Insights and Forecast - by Region
- 5.3.1. North America
- 5.3.2. Europe
- 5.3.3. Asia Pacific
- 5.3.4. Middle East and Africa
- 5.3.5. South America
- 5.1. Market Analysis, Insights and Forecast - by Product Type
- 6. North America Nitinol Industry Analysis, Insights and Forecast, 2020-2032
- 6.1. Market Analysis, Insights and Forecast - by Product Type
- 6.1.1. Stents
- 6.1.2. Baskets
- 6.1.3. Guidewires
- 6.1.4. Other Products
- 6.2. Market Analysis, Insights and Forecast - by Application
- 6.2.1. Cardiovascular
- 6.2.2. Urology
- 6.2.3. Dentistry
- 6.2.4. Other Products
- 6.1. Market Analysis, Insights and Forecast - by Product Type
- 7. Europe Nitinol Industry Analysis, Insights and Forecast, 2020-2032
- 7.1. Market Analysis, Insights and Forecast - by Product Type
- 7.1.1. Stents
- 7.1.2. Baskets
- 7.1.3. Guidewires
- 7.1.4. Other Products
- 7.2. Market Analysis, Insights and Forecast - by Application
- 7.2.1. Cardiovascular
- 7.2.2. Urology
- 7.2.3. Dentistry
- 7.2.4. Other Products
- 7.1. Market Analysis, Insights and Forecast - by Product Type
- 8. Asia Pacific Nitinol Industry Analysis, Insights and Forecast, 2020-2032
- 8.1. Market Analysis, Insights and Forecast - by Product Type
- 8.1.1. Stents
- 8.1.2. Baskets
- 8.1.3. Guidewires
- 8.1.4. Other Products
- 8.2. Market Analysis, Insights and Forecast - by Application
- 8.2.1. Cardiovascular
- 8.2.2. Urology
- 8.2.3. Dentistry
- 8.2.4. Other Products
- 8.1. Market Analysis, Insights and Forecast - by Product Type
- 9. Middle East and Africa Nitinol Industry Analysis, Insights and Forecast, 2020-2032
- 9.1. Market Analysis, Insights and Forecast - by Product Type
- 9.1.1. Stents
- 9.1.2. Baskets
- 9.1.3. Guidewires
- 9.1.4. Other Products
- 9.2. Market Analysis, Insights and Forecast - by Application
- 9.2.1. Cardiovascular
- 9.2.2. Urology
- 9.2.3. Dentistry
- 9.2.4. Other Products
- 9.1. Market Analysis, Insights and Forecast - by Product Type
- 10. South America Nitinol Industry Analysis, Insights and Forecast, 2020-2032
- 10.1. Market Analysis, Insights and Forecast - by Product Type
- 10.1.1. Stents
- 10.1.2. Baskets
- 10.1.3. Guidewires
- 10.1.4. Other Products
- 10.2. Market Analysis, Insights and Forecast - by Application
- 10.2.1. Cardiovascular
- 10.2.2. Urology
- 10.2.3. Dentistry
- 10.2.4. Other Products
- 10.1. Market Analysis, Insights and Forecast - by Product Type
- 11. Competitive Analysis
- 11.1. Global Market Share Analysis 2025
- 11.2. Company Profiles
- 11.2.1 Cook Medical
- 11.2.1.1. Overview
- 11.2.1.2. Products
- 11.2.1.3. SWOT Analysis
- 11.2.1.4. Recent Developments
- 11.2.1.5. Financials (Based on Availability)
- 11.2.2 Arthrex Inc
- 11.2.2.1. Overview
- 11.2.2.2. Products
- 11.2.2.3. SWOT Analysis
- 11.2.2.4. Recent Developments
- 11.2.2.5. Financials (Based on Availability)
- 11.2.3 Merck KGaA
- 11.2.3.1. Overview
- 11.2.3.2. Products
- 11.2.3.3. SWOT Analysis
- 11.2.3.4. Recent Developments
- 11.2.3.5. Financials (Based on Availability)
- 11.2.4 Becton Dickinson & Company
- 11.2.4.1. Overview
- 11.2.4.2. Products
- 11.2.4.3. SWOT Analysis
- 11.2.4.4. Recent Developments
- 11.2.4.5. Financials (Based on Availability)
- 11.2.5 Zimmer Biomet
- 11.2.5.1. Overview
- 11.2.5.2. Products
- 11.2.5.3. SWOT Analysis
- 11.2.5.4. Recent Developments
- 11.2.5.5. Financials (Based on Availability)
- 11.2.6 Terumo Corporation
- 11.2.6.1. Overview
- 11.2.6.2. Products
- 11.2.6.3. SWOT Analysis
- 11.2.6.4. Recent Developments
- 11.2.6.5. Financials (Based on Availability)
- 11.2.7 EndoSmart GmbH
- 11.2.7.1. Overview
- 11.2.7.2. Products
- 11.2.7.3. SWOT Analysis
- 11.2.7.4. Recent Developments
- 11.2.7.5. Financials (Based on Availability)
- 11.2.8 W L Gore & Associate Inc
- 11.2.8.1. Overview
- 11.2.8.2. Products
- 11.2.8.3. SWOT Analysis
- 11.2.8.4. Recent Developments
- 11.2.8.5. Financials (Based on Availability)
- 11.2.9 Boston Scientific Corporation
- 11.2.9.1. Overview
- 11.2.9.2. Products
- 11.2.9.3. SWOT Analysis
- 11.2.9.4. Recent Developments
- 11.2.9.5. Financials (Based on Availability)
- 11.2.10 B Braun SE
- 11.2.10.1. Overview
- 11.2.10.2. Products
- 11.2.10.3. SWOT Analysis
- 11.2.10.4. Recent Developments
- 11.2.10.5. Financials (Based on Availability)
- 11.2.1 Cook Medical
List of Figures
- Figure 1: Global Nitinol Industry Revenue Breakdown (billion, %) by Region 2025 & 2033
- Figure 2: Global Nitinol Industry Volume Breakdown (K Unit, %) by Region 2025 & 2033
- Figure 3: North America Nitinol Industry Revenue (billion), by Product Type 2025 & 2033
- Figure 4: North America Nitinol Industry Volume (K Unit), by Product Type 2025 & 2033
- Figure 5: North America Nitinol Industry Revenue Share (%), by Product Type 2025 & 2033
- Figure 6: North America Nitinol Industry Volume Share (%), by Product Type 2025 & 2033
- Figure 7: North America Nitinol Industry Revenue (billion), by Application 2025 & 2033
- Figure 8: North America Nitinol Industry Volume (K Unit), by Application 2025 & 2033
- Figure 9: North America Nitinol Industry Revenue Share (%), by Application 2025 & 2033
- Figure 10: North America Nitinol Industry Volume Share (%), by Application 2025 & 2033
- Figure 11: North America Nitinol Industry Revenue (billion), by Country 2025 & 2033
- Figure 12: North America Nitinol Industry Volume (K Unit), by Country 2025 & 2033
- Figure 13: North America Nitinol Industry Revenue Share (%), by Country 2025 & 2033
- Figure 14: North America Nitinol Industry Volume Share (%), by Country 2025 & 2033
- Figure 15: Europe Nitinol Industry Revenue (billion), by Product Type 2025 & 2033
- Figure 16: Europe Nitinol Industry Volume (K Unit), by Product Type 2025 & 2033
- Figure 17: Europe Nitinol Industry Revenue Share (%), by Product Type 2025 & 2033
- Figure 18: Europe Nitinol Industry Volume Share (%), by Product Type 2025 & 2033
- Figure 19: Europe Nitinol Industry Revenue (billion), by Application 2025 & 2033
- Figure 20: Europe Nitinol Industry Volume (K Unit), by Application 2025 & 2033
- Figure 21: Europe Nitinol Industry Revenue Share (%), by Application 2025 & 2033
- Figure 22: Europe Nitinol Industry Volume Share (%), by Application 2025 & 2033
- Figure 23: Europe Nitinol Industry Revenue (billion), by Country 2025 & 2033
- Figure 24: Europe Nitinol Industry Volume (K Unit), by Country 2025 & 2033
- Figure 25: Europe Nitinol Industry Revenue Share (%), by Country 2025 & 2033
- Figure 26: Europe Nitinol Industry Volume Share (%), by Country 2025 & 2033
- Figure 27: Asia Pacific Nitinol Industry Revenue (billion), by Product Type 2025 & 2033
- Figure 28: Asia Pacific Nitinol Industry Volume (K Unit), by Product Type 2025 & 2033
- Figure 29: Asia Pacific Nitinol Industry Revenue Share (%), by Product Type 2025 & 2033
- Figure 30: Asia Pacific Nitinol Industry Volume Share (%), by Product Type 2025 & 2033
- Figure 31: Asia Pacific Nitinol Industry Revenue (billion), by Application 2025 & 2033
- Figure 32: Asia Pacific Nitinol Industry Volume (K Unit), by Application 2025 & 2033
- Figure 33: Asia Pacific Nitinol Industry Revenue Share (%), by Application 2025 & 2033
- Figure 34: Asia Pacific Nitinol Industry Volume Share (%), by Application 2025 & 2033
- Figure 35: Asia Pacific Nitinol Industry Revenue (billion), by Country 2025 & 2033
- Figure 36: Asia Pacific Nitinol Industry Volume (K Unit), by Country 2025 & 2033
- Figure 37: Asia Pacific Nitinol Industry Revenue Share (%), by Country 2025 & 2033
- Figure 38: Asia Pacific Nitinol Industry Volume Share (%), by Country 2025 & 2033
- Figure 39: Middle East and Africa Nitinol Industry Revenue (billion), by Product Type 2025 & 2033
- Figure 40: Middle East and Africa Nitinol Industry Volume (K Unit), by Product Type 2025 & 2033
- Figure 41: Middle East and Africa Nitinol Industry Revenue Share (%), by Product Type 2025 & 2033
- Figure 42: Middle East and Africa Nitinol Industry Volume Share (%), by Product Type 2025 & 2033
- Figure 43: Middle East and Africa Nitinol Industry Revenue (billion), by Application 2025 & 2033
- Figure 44: Middle East and Africa Nitinol Industry Volume (K Unit), by Application 2025 & 2033
- Figure 45: Middle East and Africa Nitinol Industry Revenue Share (%), by Application 2025 & 2033
- Figure 46: Middle East and Africa Nitinol Industry Volume Share (%), by Application 2025 & 2033
- Figure 47: Middle East and Africa Nitinol Industry Revenue (billion), by Country 2025 & 2033
- Figure 48: Middle East and Africa Nitinol Industry Volume (K Unit), by Country 2025 & 2033
- Figure 49: Middle East and Africa Nitinol Industry Revenue Share (%), by Country 2025 & 2033
- Figure 50: Middle East and Africa Nitinol Industry Volume Share (%), by Country 2025 & 2033
- Figure 51: South America Nitinol Industry Revenue (billion), by Product Type 2025 & 2033
- Figure 52: South America Nitinol Industry Volume (K Unit), by Product Type 2025 & 2033
- Figure 53: South America Nitinol Industry Revenue Share (%), by Product Type 2025 & 2033
- Figure 54: South America Nitinol Industry Volume Share (%), by Product Type 2025 & 2033
- Figure 55: South America Nitinol Industry Revenue (billion), by Application 2025 & 2033
- Figure 56: South America Nitinol Industry Volume (K Unit), by Application 2025 & 2033
- Figure 57: South America Nitinol Industry Revenue Share (%), by Application 2025 & 2033
- Figure 58: South America Nitinol Industry Volume Share (%), by Application 2025 & 2033
- Figure 59: South America Nitinol Industry Revenue (billion), by Country 2025 & 2033
- Figure 60: South America Nitinol Industry Volume (K Unit), by Country 2025 & 2033
- Figure 61: South America Nitinol Industry Revenue Share (%), by Country 2025 & 2033
- Figure 62: South America Nitinol Industry Volume Share (%), by Country 2025 & 2033
List of Tables
- Table 1: Global Nitinol Industry Revenue billion Forecast, by Product Type 2020 & 2033
- Table 2: Global Nitinol Industry Volume K Unit Forecast, by Product Type 2020 & 2033
- Table 3: Global Nitinol Industry Revenue billion Forecast, by Application 2020 & 2033
- Table 4: Global Nitinol Industry Volume K Unit Forecast, by Application 2020 & 2033
- Table 5: Global Nitinol Industry Revenue billion Forecast, by Region 2020 & 2033
- Table 6: Global Nitinol Industry Volume K Unit Forecast, by Region 2020 & 2033
- Table 7: Global Nitinol Industry Revenue billion Forecast, by Product Type 2020 & 2033
- Table 8: Global Nitinol Industry Volume K Unit Forecast, by Product Type 2020 & 2033
- Table 9: Global Nitinol Industry Revenue billion Forecast, by Application 2020 & 2033
- Table 10: Global Nitinol Industry Volume K Unit Forecast, by Application 2020 & 2033
- Table 11: Global Nitinol Industry Revenue billion Forecast, by Country 2020 & 2033
- Table 12: Global Nitinol Industry Volume K Unit Forecast, by Country 2020 & 2033
- Table 13: United States Nitinol Industry Revenue (billion) Forecast, by Application 2020 & 2033
- Table 14: United States Nitinol Industry Volume (K Unit) Forecast, by Application 2020 & 2033
- Table 15: Canada Nitinol Industry Revenue (billion) Forecast, by Application 2020 & 2033
- Table 16: Canada Nitinol Industry Volume (K Unit) Forecast, by Application 2020 & 2033
- Table 17: Mexico Nitinol Industry Revenue (billion) Forecast, by Application 2020 & 2033
- Table 18: Mexico Nitinol Industry Volume (K Unit) Forecast, by Application 2020 & 2033
- Table 19: Global Nitinol Industry Revenue billion Forecast, by Product Type 2020 & 2033
- Table 20: Global Nitinol Industry Volume K Unit Forecast, by Product Type 2020 & 2033
- Table 21: Global Nitinol Industry Revenue billion Forecast, by Application 2020 & 2033
- Table 22: Global Nitinol Industry Volume K Unit Forecast, by Application 2020 & 2033
- Table 23: Global Nitinol Industry Revenue billion Forecast, by Country 2020 & 2033
- Table 24: Global Nitinol Industry Volume K Unit Forecast, by Country 2020 & 2033
- Table 25: Germany Nitinol Industry Revenue (billion) Forecast, by Application 2020 & 2033
- Table 26: Germany Nitinol Industry Volume (K Unit) Forecast, by Application 2020 & 2033
- Table 27: United Kingdom Nitinol Industry Revenue (billion) Forecast, by Application 2020 & 2033
- Table 28: United Kingdom Nitinol Industry Volume (K Unit) Forecast, by Application 2020 & 2033
- Table 29: France Nitinol Industry Revenue (billion) Forecast, by Application 2020 & 2033
- Table 30: France Nitinol Industry Volume (K Unit) Forecast, by Application 2020 & 2033
- Table 31: Italy Nitinol Industry Revenue (billion) Forecast, by Application 2020 & 2033
- Table 32: Italy Nitinol Industry Volume (K Unit) Forecast, by Application 2020 & 2033
- Table 33: Spain Nitinol Industry Revenue (billion) Forecast, by Application 2020 & 2033
- Table 34: Spain Nitinol Industry Volume (K Unit) Forecast, by Application 2020 & 2033
- Table 35: Rest of Europe Nitinol Industry Revenue (billion) Forecast, by Application 2020 & 2033
- Table 36: Rest of Europe Nitinol Industry Volume (K Unit) Forecast, by Application 2020 & 2033
- Table 37: Global Nitinol Industry Revenue billion Forecast, by Product Type 2020 & 2033
- Table 38: Global Nitinol Industry Volume K Unit Forecast, by Product Type 2020 & 2033
- Table 39: Global Nitinol Industry Revenue billion Forecast, by Application 2020 & 2033
- Table 40: Global Nitinol Industry Volume K Unit Forecast, by Application 2020 & 2033
- Table 41: Global Nitinol Industry Revenue billion Forecast, by Country 2020 & 2033
- Table 42: Global Nitinol Industry Volume K Unit Forecast, by Country 2020 & 2033
- Table 43: China Nitinol Industry Revenue (billion) Forecast, by Application 2020 & 2033
- Table 44: China Nitinol Industry Volume (K Unit) Forecast, by Application 2020 & 2033
- Table 45: Japan Nitinol Industry Revenue (billion) Forecast, by Application 2020 & 2033
- Table 46: Japan Nitinol Industry Volume (K Unit) Forecast, by Application 2020 & 2033
- Table 47: India Nitinol Industry Revenue (billion) Forecast, by Application 2020 & 2033
- Table 48: India Nitinol Industry Volume (K Unit) Forecast, by Application 2020 & 2033
- Table 49: Australia Nitinol Industry Revenue (billion) Forecast, by Application 2020 & 2033
- Table 50: Australia Nitinol Industry Volume (K Unit) Forecast, by Application 2020 & 2033
- Table 51: South Korea Nitinol Industry Revenue (billion) Forecast, by Application 2020 & 2033
- Table 52: South Korea Nitinol Industry Volume (K Unit) Forecast, by Application 2020 & 2033
- Table 53: Rest of Asia Pacific Nitinol Industry Revenue (billion) Forecast, by Application 2020 & 2033
- Table 54: Rest of Asia Pacific Nitinol Industry Volume (K Unit) Forecast, by Application 2020 & 2033
- Table 55: Global Nitinol Industry Revenue billion Forecast, by Product Type 2020 & 2033
- Table 56: Global Nitinol Industry Volume K Unit Forecast, by Product Type 2020 & 2033
- Table 57: Global Nitinol Industry Revenue billion Forecast, by Application 2020 & 2033
- Table 58: Global Nitinol Industry Volume K Unit Forecast, by Application 2020 & 2033
- Table 59: Global Nitinol Industry Revenue billion Forecast, by Country 2020 & 2033
- Table 60: Global Nitinol Industry Volume K Unit Forecast, by Country 2020 & 2033
- Table 61: GCC Nitinol Industry Revenue (billion) Forecast, by Application 2020 & 2033
- Table 62: GCC Nitinol Industry Volume (K Unit) Forecast, by Application 2020 & 2033
- Table 63: South Africa Nitinol Industry Revenue (billion) Forecast, by Application 2020 & 2033
- Table 64: South Africa Nitinol Industry Volume (K Unit) Forecast, by Application 2020 & 2033
- Table 65: Rest of Middle East and Africa Nitinol Industry Revenue (billion) Forecast, by Application 2020 & 2033
- Table 66: Rest of Middle East and Africa Nitinol Industry Volume (K Unit) Forecast, by Application 2020 & 2033
- Table 67: Global Nitinol Industry Revenue billion Forecast, by Product Type 2020 & 2033
- Table 68: Global Nitinol Industry Volume K Unit Forecast, by Product Type 2020 & 2033
- Table 69: Global Nitinol Industry Revenue billion Forecast, by Application 2020 & 2033
- Table 70: Global Nitinol Industry Volume K Unit Forecast, by Application 2020 & 2033
- Table 71: Global Nitinol Industry Revenue billion Forecast, by Country 2020 & 2033
- Table 72: Global Nitinol Industry Volume K Unit Forecast, by Country 2020 & 2033
- Table 73: Brazil Nitinol Industry Revenue (billion) Forecast, by Application 2020 & 2033
- Table 74: Brazil Nitinol Industry Volume (K Unit) Forecast, by Application 2020 & 2033
- Table 75: Argentina Nitinol Industry Revenue (billion) Forecast, by Application 2020 & 2033
- Table 76: Argentina Nitinol Industry Volume (K Unit) Forecast, by Application 2020 & 2033
- Table 77: Rest of South America Nitinol Industry Revenue (billion) Forecast, by Application 2020 & 2033
- Table 78: Rest of South America Nitinol Industry Volume (K Unit) Forecast, by Application 2020 & 2033
Frequently Asked Questions
1. What is the projected Compound Annual Growth Rate (CAGR) of the Nitinol Industry?
The projected CAGR is approximately 7.1%.
2. Which companies are prominent players in the Nitinol Industry?
Key companies in the market include Cook Medical, Arthrex Inc, Merck KGaA, Becton Dickinson & Company, Zimmer Biomet, Terumo Corporation, EndoSmart GmbH, W L Gore & Associate Inc, Boston Scientific Corporation, B Braun SE.
3. What are the main segments of the Nitinol Industry?
The market segments include Product Type, Application.
4. Can you provide details about the market size?
The market size is estimated to be USD 7.68 billion as of 2022.
5. What are some drivers contributing to market growth?
Growing Burden of Chronic Diseases; Rising Preference for Minimally Invasive Surgeries.
6. What are the notable trends driving market growth?
Stents Segment to Witness Significant Growth over the Forecast Period..
7. Are there any restraints impacting market growth?
High-cost of Devices; Presence of Alternative Devices.
8. Can you provide examples of recent developments in the market?
November 2022: Alleima acquired Endosmart Gesellschaft für Medizintechnik GmbH (Endosmart), a Germany-based manufacturer of medical devices and components made of the shape-memory alloy nitinol. The product offering includes kidney stone retrieval baskets and snares, breast cancer tumor markers, as well as surgical instruments.
9. What pricing options are available for accessing the report?
Pricing options include single-user, multi-user, and enterprise licenses priced at USD 4750, USD 5250, and USD 8750 respectively.
10. Is the market size provided in terms of value or volume?
The market size is provided in terms of value, measured in billion and volume, measured in K Unit.
11. Are there any specific market keywords associated with the report?
Yes, the market keyword associated with the report is "Nitinol Industry," which aids in identifying and referencing the specific market segment covered.
12. How do I determine which pricing option suits my needs best?
The pricing options vary based on user requirements and access needs. Individual users may opt for single-user licenses, while businesses requiring broader access may choose multi-user or enterprise licenses for cost-effective access to the report.
13. Are there any additional resources or data provided in the Nitinol Industry report?
While the report offers comprehensive insights, it's advisable to review the specific contents or supplementary materials provided to ascertain if additional resources or data are available.
14. How can I stay updated on further developments or reports in the Nitinol Industry?
To stay informed about further developments, trends, and reports in the Nitinol Industry, consider subscribing to industry newsletters, following relevant companies and organizations, or regularly checking reputable industry news sources and publications.
Methodology
Step 1 - Identification of Relevant Samples Size from Population Database


Step 2 - Approaches for Defining Global Market Size (Value, Volume* & Price*)

Note*: In applicable scenarios
Step 3 - Data Sources
Primary Research
- Web Analytics
- Survey Reports
- Research Institute
- Latest Research Reports
- Opinion Leaders
Secondary Research
- Annual Reports
- White Paper
- Latest Press Release
- Industry Association
- Paid Database
- Investor Presentations

Step 4 - Data Triangulation
Involves using different sources of information in order to increase the validity of a study
These sources are likely to be stakeholders in a program - participants, other researchers, program staff, other community members, and so on.
Then we put all data in single framework & apply various statistical tools to find out the dynamic on the market.
During the analysis stage, feedback from the stakeholder groups would be compared to determine areas of agreement as well as areas of divergence