

Key Insights
The North American Managed Mobility Services (MMS) market is experiencing robust growth, fueled by the increasing adoption of mobile devices in enterprises and the rising need for secure and efficient mobile device management. The market's Compound Annual Growth Rate (CAGR) of 20.54% from 2019 to 2024 suggests a significant expansion, indicating strong demand for solutions that streamline mobile device deployment, security, and management. Key drivers include the growing BYOD (Bring Your Own Device) trend, the increasing complexity of mobile ecosystems, and the stringent regulatory requirements around data security and privacy, especially within sensitive sectors like BFSI and healthcare. The cloud deployment model is gaining traction due to its scalability, cost-effectiveness, and accessibility. While on-premise solutions still hold a market share, the shift towards cloud-based MMS is expected to accelerate in the coming years. The dominance of North America in the global MMS market is attributed to high technological advancements, early adoption of mobile technologies, and the presence of major industry players. Segmentation reveals that Mobile Device Management (MDM) and Mobile Application Management (MAM) solutions hold significant market share within the "By Type" segment.
Looking ahead to the forecast period (2025-2033), the North American MMS market is poised for continued expansion. Factors such as the increasing adoption of 5G technology, the proliferation of IoT devices, and the growth of remote work models will continue to drive demand for advanced MMS solutions. However, challenges remain, including concerns around data breaches, the increasing sophistication of cyber threats, and the need for robust integration with existing IT infrastructure. Companies in the MMS market must continuously innovate to offer solutions that address these evolving challenges, focusing on AI-powered security, enhanced user experience, and seamless integration with various enterprise systems. The competitive landscape is marked by established players like Dell Technologies, IBM, and Accenture, alongside emerging players that are challenging the established order through innovative offerings and competitive pricing. The market is segmented by device type, deployment model and industry verticals, allowing specialized vendors to focus on their core competencies and penetrate specific niches.
Unlock Growth Opportunities in the North America Managed Mobility Service Market: A Comprehensive Market Report (2019-2033)
This comprehensive report provides an in-depth analysis of the North America Managed Mobility Service (MMS) market, offering invaluable insights for industry stakeholders seeking to capitalize on emerging trends and opportunities. With a detailed examination of market dynamics, leading players, and future projections spanning the period 2019-2033, this report is an essential resource for strategic decision-making. The report leverages data from the base year 2025, with estimations for 2025 and forecasts extending to 2033, providing a complete historical and predictive overview. The market size for 2025 is estimated at xx Million.
NA Managed Mobility Service Market Market Dynamics & Concentration
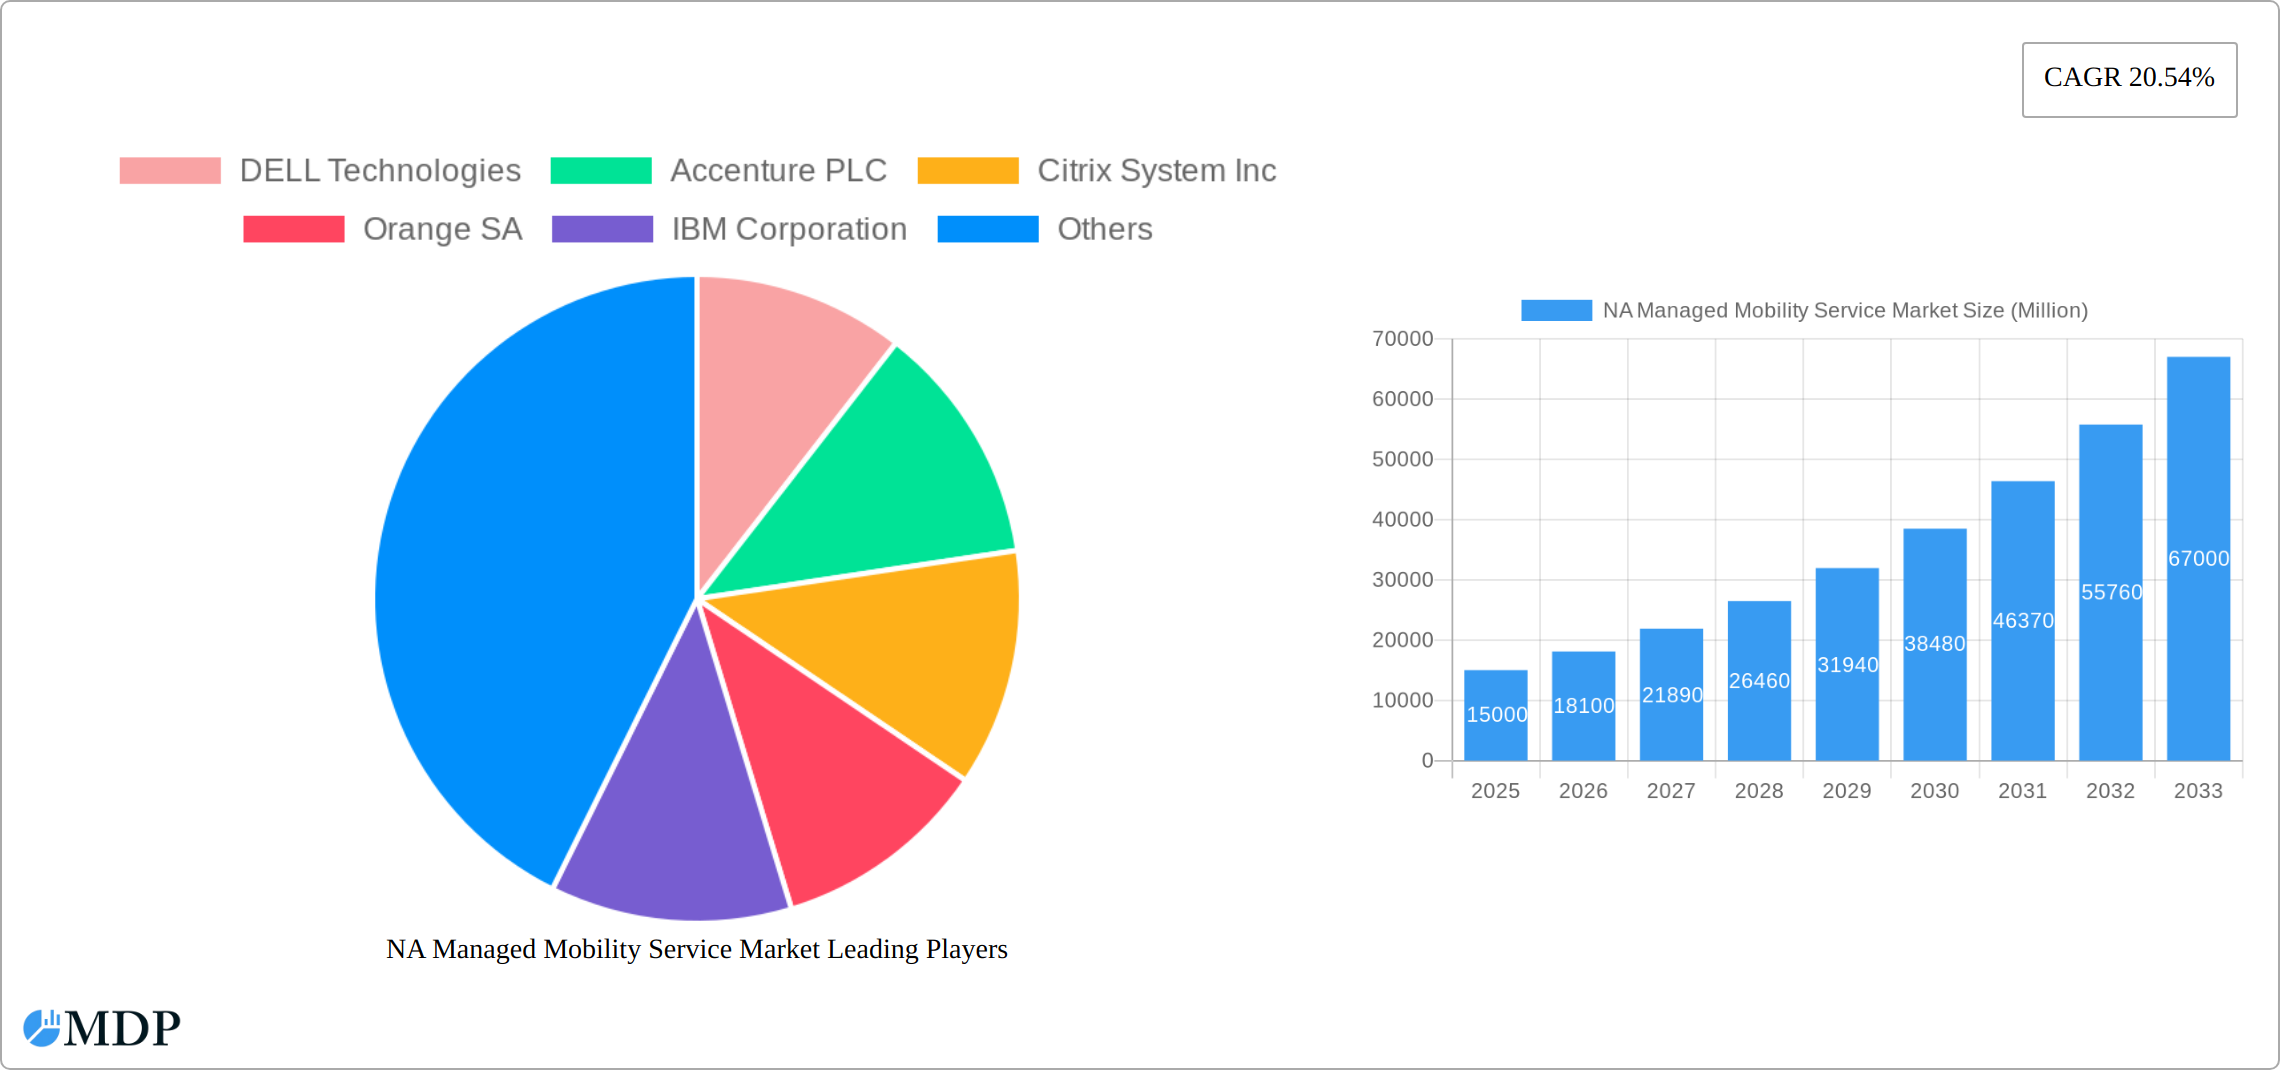
The North America Managed Mobility Service market exhibits a moderately concentrated landscape, with key players such as DELL Technologies, Accenture PLC, Citrix System Inc., and IBM Corporation holding significant market share. The market is characterized by intense competition, driven by continuous product innovation, strategic mergers and acquisitions (M&A), and evolving regulatory frameworks. The historical period (2019-2024) witnessed approximately xx M&A deals, contributing to market consolidation. Innovation in areas like AI-powered security solutions and 5G integration is a major driver, while increasing regulatory scrutiny related to data privacy is shaping market practices. The increasing adoption of BYOD (Bring Your Own Device) policies is also a prominent factor driving market growth, leading to a greater need for robust MMS solutions. Product substitution, mainly from cloud-based solutions replacing traditional on-premise systems, is reshaping the competitive landscape. End-user trends reveal a growing preference for comprehensive, integrated MMS platforms capable of addressing diverse needs across different devices and operating systems. Finally, the forecast period (2025-2033) is expected to see a continued surge in M&A activity as major players seek to expand their market reach and service capabilities.
NA Managed Mobility Service Market Industry Trends & Analysis
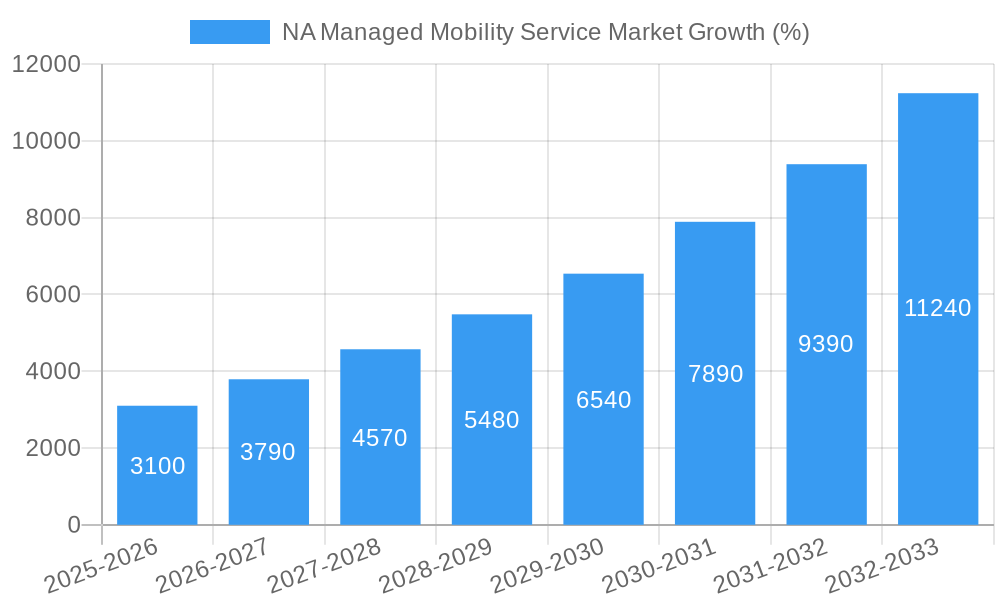
The North American Managed Mobility Service market is experiencing robust growth, fueled by several key factors. The increasing adoption of mobile devices across various industries has spurred the demand for effective MMS solutions to manage, secure, and optimize mobile device deployments. Technological advancements, particularly in areas such as 5G, AI, and IoT, are driving the development of more sophisticated and integrated MMS platforms. Consumer preferences are shifting towards user-friendly, secure, and cost-effective solutions, prompting vendors to innovate and offer customized solutions. The market’s competitive dynamics are characterized by intense rivalry among established players and emerging entrants, leading to price competition and service innovation. The market is projected to achieve a Compound Annual Growth Rate (CAGR) of xx% during the forecast period (2025-2033), with market penetration expected to reach xx% by 2033.
Leading Markets & Segments in NA Managed Mobility Service Market
- By Type: Mobile Device Management (MDM) remains the largest segment, driven by the widespread adoption of mobile devices across various industries. Mobile Security is witnessing rapid growth due to increasing cybersecurity threats. Mobile Application Management (MAM) is also experiencing significant traction as organizations strive to manage and secure their enterprise applications.
- By Deployment: Cloud-based deployments are gaining popularity due to their scalability, flexibility, and cost-effectiveness. On-premise deployments still maintain a significant share, especially within organizations with stringent security requirements.
- By End-user Industry: The BFSI (Banking, Financial Services, and Insurance) sector is a major consumer of MMS services due to its stringent security and compliance requirements. The Retail and Healthcare sectors are also significant contributors, driven by the increasing use of mobile devices in their operations. The IT and Telecom sector is also a strong adopter of the technology due to its heavy reliance on mobile device management.
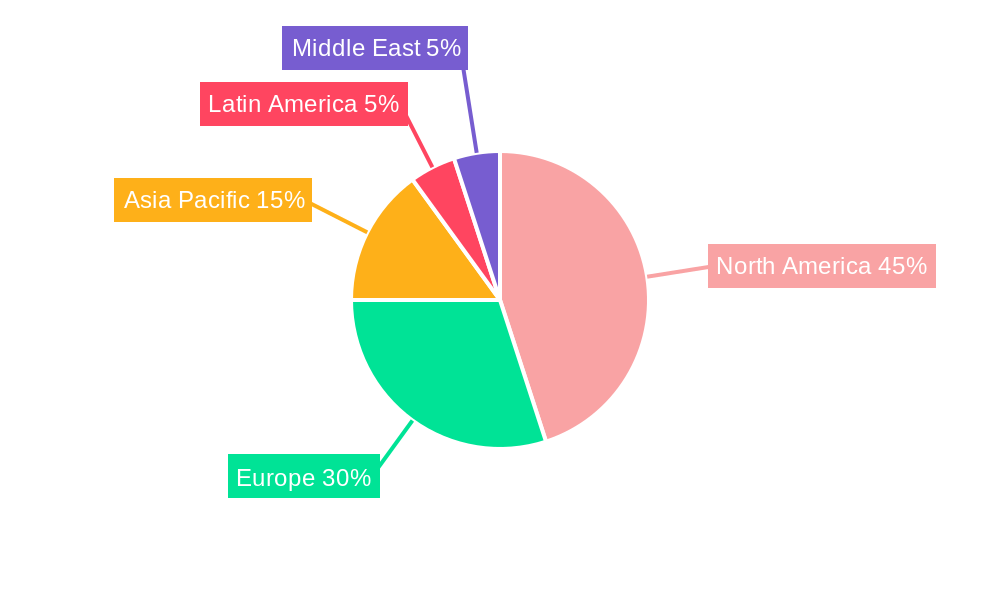
Dominance Analysis: The United States holds the dominant position in the North American MMS market due to the high adoption of mobile technologies, strong technological infrastructure, and the presence of major technology companies. Key drivers for the dominance include robust economic conditions, favorable regulatory frameworks supporting technological innovation, and a mature IT infrastructure. Canada is also a significant market, albeit smaller in size.
NA Managed Mobility Service Market Product Developments
Recent product innovations in the MMS market are focused on enhancing security features, improving integration with other enterprise systems, and providing greater user-friendliness. The integration of AI and machine learning is enhancing security capabilities, allowing for proactive threat detection and response. Vendors are also focusing on developing solutions that seamlessly integrate with existing enterprise mobility management (EMM) platforms, improving interoperability and reducing management complexities. The development of 5G compatible solutions is another area of significant innovation. These advancements aim to improve overall efficiency and enhance the user experience, ensuring that the technology remains both reliable and cost-effective.
Key Drivers of NA Managed Mobility Service Market Growth
The NA Managed Mobility Service market's growth is driven by several factors: the increasing adoption of BYOD policies, the growing need for enhanced mobile security in the face of escalating cyber threats, the demand for streamlined mobile device management within enterprises, and government initiatives to support digital transformation. Furthermore, technological advancements, such as 5G and AI, are boosting the functionality and efficiency of MMS solutions. Finally, the rising prevalence of cloud-based solutions is driving market growth through their scalability and cost-effectiveness.
Challenges in the NA Managed Mobility Service Market Market
The market faces challenges such as the high cost of implementation and maintenance of MMS solutions, particularly for smaller businesses. Concerns about data security and privacy also pose significant challenges, potentially leading to regulatory hurdles. The complexities involved in integrating MMS solutions with existing IT infrastructure can also hinder adoption. Competitive pressures from both established players and emerging entrants further contribute to the challenges faced by market participants. Finally, the need for continuous skill development among IT professionals is also an area that needs attention.
Emerging Opportunities in NA Managed Mobility Service Market
Significant opportunities exist in the expansion of MMS solutions into new vertical markets, particularly in sectors like education and government. The integration of advanced technologies, such as AI and IoT, presents substantial growth opportunities by adding innovative functionalities and increased efficiency. Strategic partnerships between MMS providers and other technology companies can lead to innovative offerings and expanded market reach. Finally, market expansion into underserved regions within North America presents opportunities for significant growth.
Leading Players in the NA Managed Mobility Service Market Sector
- DELL Technologies
- Accenture PLC
- Citrix System Inc
- Orange SA
- IBM Corporation
- Wipro Ltd
- Fujitsu Ltd
- Hewlett Packard Enterprise Company
- Tech Mahindra Limited
- AT&T Inc
- Telefonica SA
Key Milestones in NA Managed Mobility Service Market Industry
- 2020: Increased focus on remote work solutions due to the COVID-19 pandemic.
- 2021: Significant investments in 5G-ready MMS solutions.
- 2022: Rise in adoption of AI-powered security features.
- 2023: Several key M&A activities amongst major players reshaping the market landscape.
- 2024: Launch of several new, integrated MMS platforms.
Strategic Outlook for NA Managed Mobility Service Market Market
The NA Managed Mobility Service market is poised for sustained growth, driven by the continuous adoption of mobile technologies, advancements in security and integration capabilities, and the ongoing digital transformation across diverse industries. Strategic opportunities lie in developing innovative solutions that address emerging needs, forging strategic partnerships, and capitalizing on market expansion opportunities. The focus on enhanced security, AI-powered features, and seamless integration will continue to shape the future of the market. Companies that proactively address security concerns and offer user-friendly, flexible solutions will be best positioned for success in this rapidly evolving landscape.
NA Managed Mobility Service Market Segmentation
-
1. Type
- 1.1. Mobile Device Management
- 1.2. Mobile Security
- 1.3. Mobile Application Management
- 1.4. Other Type
-
2. Deployment
- 2.1. Cloud
- 2.2. On-premise
-
3. End-user Industry
- 3.1. BFSI
- 3.2. Retail
- 3.3. Power and Energy
- 3.4. Manufacturing
- 3.5. IT and Telecom
- 3.6. Education
- 3.7. Healthcare
- 3.8. Other End-user Industry
NA Managed Mobility Service Market Segmentation By Geography
-
1. North America
- 1.1. United States
- 1.2. Canada
- 1.3. Mexico
-
2. South America
- 2.1. Brazil
- 2.2. Argentina
- 2.3. Rest of South America
-
3. Europe
- 3.1. United Kingdom
- 3.2. Germany
- 3.3. France
- 3.4. Italy
- 3.5. Spain
- 3.6. Russia
- 3.7. Benelux
- 3.8. Nordics
- 3.9. Rest of Europe
-
4. Middle East & Africa
- 4.1. Turkey
- 4.2. Israel
- 4.3. GCC
- 4.4. North Africa
- 4.5. South Africa
- 4.6. Rest of Middle East & Africa
-
5. Asia Pacific
- 5.1. China
- 5.2. India
- 5.3. Japan
- 5.4. South Korea
- 5.5. ASEAN
- 5.6. Oceania
- 5.7. Rest of Asia Pacific
NA Managed Mobility Service Market REPORT HIGHLIGHTS
| Aspects | Details |
|---|---|
| Study Period | 2019-2033 |
| Base Year | 2024 |
| Estimated Year | 2025 |
| Forecast Period | 2025-2033 |
| Historical Period | 2019-2024 |
| Growth Rate | CAGR of 20.54% from 2019-2033 |
| Segmentation |
|
Table of Contents
- 1. Introduction
- 1.1. Research Scope
- 1.2. Market Segmentation
- 1.3. Research Methodology
- 1.4. Definitions and Assumptions
- 2. Executive Summary
- 2.1. Introduction
- 3. Market Dynamics
- 3.1. Introduction
- 3.2. Market Drivers
- 3.2.1. ; Increasing Acceptability for BYOD in Organizations; Companies Outsourcing IT Activities
- 3.3. Market Restrains
- 3.3.1. ; Lack of Control over Operations and Cost Visibility
- 3.4. Market Trends
- 3.4.1. Mobile Application Management to Hold Major Share
- 4. Market Factor Analysis
- 4.1. Porters Five Forces
- 4.2. Supply/Value Chain
- 4.3. PESTEL analysis
- 4.4. Market Entropy
- 4.5. Patent/Trademark Analysis
- 5. Global NA Managed Mobility Service Market Analysis, Insights and Forecast, 2019-2031
- 5.1. Market Analysis, Insights and Forecast - by Type
- 5.1.1. Mobile Device Management
- 5.1.2. Mobile Security
- 5.1.3. Mobile Application Management
- 5.1.4. Other Type
- 5.2. Market Analysis, Insights and Forecast - by Deployment
- 5.2.1. Cloud
- 5.2.2. On-premise
- 5.3. Market Analysis, Insights and Forecast - by End-user Industry
- 5.3.1. BFSI
- 5.3.2. Retail
- 5.3.3. Power and Energy
- 5.3.4. Manufacturing
- 5.3.5. IT and Telecom
- 5.3.6. Education
- 5.3.7. Healthcare
- 5.3.8. Other End-user Industry
- 5.4. Market Analysis, Insights and Forecast - by Region
- 5.4.1. North America
- 5.4.2. South America
- 5.4.3. Europe
- 5.4.4. Middle East & Africa
- 5.4.5. Asia Pacific
- 5.1. Market Analysis, Insights and Forecast - by Type
- 6. North America NA Managed Mobility Service Market Analysis, Insights and Forecast, 2019-2031
- 6.1. Market Analysis, Insights and Forecast - by Type
- 6.1.1. Mobile Device Management
- 6.1.2. Mobile Security
- 6.1.3. Mobile Application Management
- 6.1.4. Other Type
- 6.2. Market Analysis, Insights and Forecast - by Deployment
- 6.2.1. Cloud
- 6.2.2. On-premise
- 6.3. Market Analysis, Insights and Forecast - by End-user Industry
- 6.3.1. BFSI
- 6.3.2. Retail
- 6.3.3. Power and Energy
- 6.3.4. Manufacturing
- 6.3.5. IT and Telecom
- 6.3.6. Education
- 6.3.7. Healthcare
- 6.3.8. Other End-user Industry
- 6.1. Market Analysis, Insights and Forecast - by Type
- 7. South America NA Managed Mobility Service Market Analysis, Insights and Forecast, 2019-2031
- 7.1. Market Analysis, Insights and Forecast - by Type
- 7.1.1. Mobile Device Management
- 7.1.2. Mobile Security
- 7.1.3. Mobile Application Management
- 7.1.4. Other Type
- 7.2. Market Analysis, Insights and Forecast - by Deployment
- 7.2.1. Cloud
- 7.2.2. On-premise
- 7.3. Market Analysis, Insights and Forecast - by End-user Industry
- 7.3.1. BFSI
- 7.3.2. Retail
- 7.3.3. Power and Energy
- 7.3.4. Manufacturing
- 7.3.5. IT and Telecom
- 7.3.6. Education
- 7.3.7. Healthcare
- 7.3.8. Other End-user Industry
- 7.1. Market Analysis, Insights and Forecast - by Type
- 8. Europe NA Managed Mobility Service Market Analysis, Insights and Forecast, 2019-2031
- 8.1. Market Analysis, Insights and Forecast - by Type
- 8.1.1. Mobile Device Management
- 8.1.2. Mobile Security
- 8.1.3. Mobile Application Management
- 8.1.4. Other Type
- 8.2. Market Analysis, Insights and Forecast - by Deployment
- 8.2.1. Cloud
- 8.2.2. On-premise
- 8.3. Market Analysis, Insights and Forecast - by End-user Industry
- 8.3.1. BFSI
- 8.3.2. Retail
- 8.3.3. Power and Energy
- 8.3.4. Manufacturing
- 8.3.5. IT and Telecom
- 8.3.6. Education
- 8.3.7. Healthcare
- 8.3.8. Other End-user Industry
- 8.1. Market Analysis, Insights and Forecast - by Type
- 9. Middle East & Africa NA Managed Mobility Service Market Analysis, Insights and Forecast, 2019-2031
- 9.1. Market Analysis, Insights and Forecast - by Type
- 9.1.1. Mobile Device Management
- 9.1.2. Mobile Security
- 9.1.3. Mobile Application Management
- 9.1.4. Other Type
- 9.2. Market Analysis, Insights and Forecast - by Deployment
- 9.2.1. Cloud
- 9.2.2. On-premise
- 9.3. Market Analysis, Insights and Forecast - by End-user Industry
- 9.3.1. BFSI
- 9.3.2. Retail
- 9.3.3. Power and Energy
- 9.3.4. Manufacturing
- 9.3.5. IT and Telecom
- 9.3.6. Education
- 9.3.7. Healthcare
- 9.3.8. Other End-user Industry
- 9.1. Market Analysis, Insights and Forecast - by Type
- 10. Asia Pacific NA Managed Mobility Service Market Analysis, Insights and Forecast, 2019-2031
- 10.1. Market Analysis, Insights and Forecast - by Type
- 10.1.1. Mobile Device Management
- 10.1.2. Mobile Security
- 10.1.3. Mobile Application Management
- 10.1.4. Other Type
- 10.2. Market Analysis, Insights and Forecast - by Deployment
- 10.2.1. Cloud
- 10.2.2. On-premise
- 10.3. Market Analysis, Insights and Forecast - by End-user Industry
- 10.3.1. BFSI
- 10.3.2. Retail
- 10.3.3. Power and Energy
- 10.3.4. Manufacturing
- 10.3.5. IT and Telecom
- 10.3.6. Education
- 10.3.7. Healthcare
- 10.3.8. Other End-user Industry
- 10.1. Market Analysis, Insights and Forecast - by Type
- 11. North America NA Managed Mobility Service Market Analysis, Insights and Forecast, 2019-2031
- 11.1. Market Analysis, Insights and Forecast - By Country/Sub-region
- 11.1.1.
- 12. Europe NA Managed Mobility Service Market Analysis, Insights and Forecast, 2019-2031
- 12.1. Market Analysis, Insights and Forecast - By Country/Sub-region
- 12.1.1.
- 13. Asia Pacific NA Managed Mobility Service Market Analysis, Insights and Forecast, 2019-2031
- 13.1. Market Analysis, Insights and Forecast - By Country/Sub-region
- 13.1.1.
- 14. Latin America NA Managed Mobility Service Market Analysis, Insights and Forecast, 2019-2031
- 14.1. Market Analysis, Insights and Forecast - By Country/Sub-region
- 14.1.1.
- 15. Middle East NA Managed Mobility Service Market Analysis, Insights and Forecast, 2019-2031
- 15.1. Market Analysis, Insights and Forecast - By Country/Sub-region
- 15.1.1.
- 16. Competitive Analysis
- 16.1. Global Market Share Analysis 2024
- 16.2. Company Profiles
- 16.2.1 DELL Technologies
- 16.2.1.1. Overview
- 16.2.1.2. Products
- 16.2.1.3. SWOT Analysis
- 16.2.1.4. Recent Developments
- 16.2.1.5. Financials (Based on Availability)
- 16.2.2 Accenture PLC
- 16.2.2.1. Overview
- 16.2.2.2. Products
- 16.2.2.3. SWOT Analysis
- 16.2.2.4. Recent Developments
- 16.2.2.5. Financials (Based on Availability)
- 16.2.3 Citrix System Inc
- 16.2.3.1. Overview
- 16.2.3.2. Products
- 16.2.3.3. SWOT Analysis
- 16.2.3.4. Recent Developments
- 16.2.3.5. Financials (Based on Availability)
- 16.2.4 Orange SA
- 16.2.4.1. Overview
- 16.2.4.2. Products
- 16.2.4.3. SWOT Analysis
- 16.2.4.4. Recent Developments
- 16.2.4.5. Financials (Based on Availability)
- 16.2.5 IBM Corporation
- 16.2.5.1. Overview
- 16.2.5.2. Products
- 16.2.5.3. SWOT Analysis
- 16.2.5.4. Recent Developments
- 16.2.5.5. Financials (Based on Availability)
- 16.2.6 Wipro Ltd
- 16.2.6.1. Overview
- 16.2.6.2. Products
- 16.2.6.3. SWOT Analysis
- 16.2.6.4. Recent Developments
- 16.2.6.5. Financials (Based on Availability)
- 16.2.7 Fujitsu Ltd
- 16.2.7.1. Overview
- 16.2.7.2. Products
- 16.2.7.3. SWOT Analysis
- 16.2.7.4. Recent Developments
- 16.2.7.5. Financials (Based on Availability)
- 16.2.8 Hewlett Packard Enterprise Company
- 16.2.8.1. Overview
- 16.2.8.2. Products
- 16.2.8.3. SWOT Analysis
- 16.2.8.4. Recent Developments
- 16.2.8.5. Financials (Based on Availability)
- 16.2.9 Tech Mahindra Limited
- 16.2.9.1. Overview
- 16.2.9.2. Products
- 16.2.9.3. SWOT Analysis
- 16.2.9.4. Recent Developments
- 16.2.9.5. Financials (Based on Availability)
- 16.2.10 AT&T Inc
- 16.2.10.1. Overview
- 16.2.10.2. Products
- 16.2.10.3. SWOT Analysis
- 16.2.10.4. Recent Developments
- 16.2.10.5. Financials (Based on Availability)
- 16.2.11 Telefonica SA
- 16.2.11.1. Overview
- 16.2.11.2. Products
- 16.2.11.3. SWOT Analysis
- 16.2.11.4. Recent Developments
- 16.2.11.5. Financials (Based on Availability)
- 16.2.1 DELL Technologies
List of Figures
- Figure 1: Global NA Managed Mobility Service Market Revenue Breakdown (Million, %) by Region 2024 & 2032
- Figure 2: Global NA Managed Mobility Service Market Volume Breakdown (K Unit, %) by Region 2024 & 2032
- Figure 3: North America NA Managed Mobility Service Market Revenue (Million), by Country 2024 & 2032
- Figure 4: North America NA Managed Mobility Service Market Volume (K Unit), by Country 2024 & 2032
- Figure 5: North America NA Managed Mobility Service Market Revenue Share (%), by Country 2024 & 2032
- Figure 6: North America NA Managed Mobility Service Market Volume Share (%), by Country 2024 & 2032
- Figure 7: Europe NA Managed Mobility Service Market Revenue (Million), by Country 2024 & 2032
- Figure 8: Europe NA Managed Mobility Service Market Volume (K Unit), by Country 2024 & 2032
- Figure 9: Europe NA Managed Mobility Service Market Revenue Share (%), by Country 2024 & 2032
- Figure 10: Europe NA Managed Mobility Service Market Volume Share (%), by Country 2024 & 2032
- Figure 11: Asia Pacific NA Managed Mobility Service Market Revenue (Million), by Country 2024 & 2032
- Figure 12: Asia Pacific NA Managed Mobility Service Market Volume (K Unit), by Country 2024 & 2032
- Figure 13: Asia Pacific NA Managed Mobility Service Market Revenue Share (%), by Country 2024 & 2032
- Figure 14: Asia Pacific NA Managed Mobility Service Market Volume Share (%), by Country 2024 & 2032
- Figure 15: Latin America NA Managed Mobility Service Market Revenue (Million), by Country 2024 & 2032
- Figure 16: Latin America NA Managed Mobility Service Market Volume (K Unit), by Country 2024 & 2032
- Figure 17: Latin America NA Managed Mobility Service Market Revenue Share (%), by Country 2024 & 2032
- Figure 18: Latin America NA Managed Mobility Service Market Volume Share (%), by Country 2024 & 2032
- Figure 19: Middle East NA Managed Mobility Service Market Revenue (Million), by Country 2024 & 2032
- Figure 20: Middle East NA Managed Mobility Service Market Volume (K Unit), by Country 2024 & 2032
- Figure 21: Middle East NA Managed Mobility Service Market Revenue Share (%), by Country 2024 & 2032
- Figure 22: Middle East NA Managed Mobility Service Market Volume Share (%), by Country 2024 & 2032
- Figure 23: North America NA Managed Mobility Service Market Revenue (Million), by Type 2024 & 2032
- Figure 24: North America NA Managed Mobility Service Market Volume (K Unit), by Type 2024 & 2032
- Figure 25: North America NA Managed Mobility Service Market Revenue Share (%), by Type 2024 & 2032
- Figure 26: North America NA Managed Mobility Service Market Volume Share (%), by Type 2024 & 2032
- Figure 27: North America NA Managed Mobility Service Market Revenue (Million), by Deployment 2024 & 2032
- Figure 28: North America NA Managed Mobility Service Market Volume (K Unit), by Deployment 2024 & 2032
- Figure 29: North America NA Managed Mobility Service Market Revenue Share (%), by Deployment 2024 & 2032
- Figure 30: North America NA Managed Mobility Service Market Volume Share (%), by Deployment 2024 & 2032
- Figure 31: North America NA Managed Mobility Service Market Revenue (Million), by End-user Industry 2024 & 2032
- Figure 32: North America NA Managed Mobility Service Market Volume (K Unit), by End-user Industry 2024 & 2032
- Figure 33: North America NA Managed Mobility Service Market Revenue Share (%), by End-user Industry 2024 & 2032
- Figure 34: North America NA Managed Mobility Service Market Volume Share (%), by End-user Industry 2024 & 2032
- Figure 35: North America NA Managed Mobility Service Market Revenue (Million), by Country 2024 & 2032
- Figure 36: North America NA Managed Mobility Service Market Volume (K Unit), by Country 2024 & 2032
- Figure 37: North America NA Managed Mobility Service Market Revenue Share (%), by Country 2024 & 2032
- Figure 38: North America NA Managed Mobility Service Market Volume Share (%), by Country 2024 & 2032
- Figure 39: South America NA Managed Mobility Service Market Revenue (Million), by Type 2024 & 2032
- Figure 40: South America NA Managed Mobility Service Market Volume (K Unit), by Type 2024 & 2032
- Figure 41: South America NA Managed Mobility Service Market Revenue Share (%), by Type 2024 & 2032
- Figure 42: South America NA Managed Mobility Service Market Volume Share (%), by Type 2024 & 2032
- Figure 43: South America NA Managed Mobility Service Market Revenue (Million), by Deployment 2024 & 2032
- Figure 44: South America NA Managed Mobility Service Market Volume (K Unit), by Deployment 2024 & 2032
- Figure 45: South America NA Managed Mobility Service Market Revenue Share (%), by Deployment 2024 & 2032
- Figure 46: South America NA Managed Mobility Service Market Volume Share (%), by Deployment 2024 & 2032
- Figure 47: South America NA Managed Mobility Service Market Revenue (Million), by End-user Industry 2024 & 2032
- Figure 48: South America NA Managed Mobility Service Market Volume (K Unit), by End-user Industry 2024 & 2032
- Figure 49: South America NA Managed Mobility Service Market Revenue Share (%), by End-user Industry 2024 & 2032
- Figure 50: South America NA Managed Mobility Service Market Volume Share (%), by End-user Industry 2024 & 2032
- Figure 51: South America NA Managed Mobility Service Market Revenue (Million), by Country 2024 & 2032
- Figure 52: South America NA Managed Mobility Service Market Volume (K Unit), by Country 2024 & 2032
- Figure 53: South America NA Managed Mobility Service Market Revenue Share (%), by Country 2024 & 2032
- Figure 54: South America NA Managed Mobility Service Market Volume Share (%), by Country 2024 & 2032
- Figure 55: Europe NA Managed Mobility Service Market Revenue (Million), by Type 2024 & 2032
- Figure 56: Europe NA Managed Mobility Service Market Volume (K Unit), by Type 2024 & 2032
- Figure 57: Europe NA Managed Mobility Service Market Revenue Share (%), by Type 2024 & 2032
- Figure 58: Europe NA Managed Mobility Service Market Volume Share (%), by Type 2024 & 2032
- Figure 59: Europe NA Managed Mobility Service Market Revenue (Million), by Deployment 2024 & 2032
- Figure 60: Europe NA Managed Mobility Service Market Volume (K Unit), by Deployment 2024 & 2032
- Figure 61: Europe NA Managed Mobility Service Market Revenue Share (%), by Deployment 2024 & 2032
- Figure 62: Europe NA Managed Mobility Service Market Volume Share (%), by Deployment 2024 & 2032
- Figure 63: Europe NA Managed Mobility Service Market Revenue (Million), by End-user Industry 2024 & 2032
- Figure 64: Europe NA Managed Mobility Service Market Volume (K Unit), by End-user Industry 2024 & 2032
- Figure 65: Europe NA Managed Mobility Service Market Revenue Share (%), by End-user Industry 2024 & 2032
- Figure 66: Europe NA Managed Mobility Service Market Volume Share (%), by End-user Industry 2024 & 2032
- Figure 67: Europe NA Managed Mobility Service Market Revenue (Million), by Country 2024 & 2032
- Figure 68: Europe NA Managed Mobility Service Market Volume (K Unit), by Country 2024 & 2032
- Figure 69: Europe NA Managed Mobility Service Market Revenue Share (%), by Country 2024 & 2032
- Figure 70: Europe NA Managed Mobility Service Market Volume Share (%), by Country 2024 & 2032
- Figure 71: Middle East & Africa NA Managed Mobility Service Market Revenue (Million), by Type 2024 & 2032
- Figure 72: Middle East & Africa NA Managed Mobility Service Market Volume (K Unit), by Type 2024 & 2032
- Figure 73: Middle East & Africa NA Managed Mobility Service Market Revenue Share (%), by Type 2024 & 2032
- Figure 74: Middle East & Africa NA Managed Mobility Service Market Volume Share (%), by Type 2024 & 2032
- Figure 75: Middle East & Africa NA Managed Mobility Service Market Revenue (Million), by Deployment 2024 & 2032
- Figure 76: Middle East & Africa NA Managed Mobility Service Market Volume (K Unit), by Deployment 2024 & 2032
- Figure 77: Middle East & Africa NA Managed Mobility Service Market Revenue Share (%), by Deployment 2024 & 2032
- Figure 78: Middle East & Africa NA Managed Mobility Service Market Volume Share (%), by Deployment 2024 & 2032
- Figure 79: Middle East & Africa NA Managed Mobility Service Market Revenue (Million), by End-user Industry 2024 & 2032
- Figure 80: Middle East & Africa NA Managed Mobility Service Market Volume (K Unit), by End-user Industry 2024 & 2032
- Figure 81: Middle East & Africa NA Managed Mobility Service Market Revenue Share (%), by End-user Industry 2024 & 2032
- Figure 82: Middle East & Africa NA Managed Mobility Service Market Volume Share (%), by End-user Industry 2024 & 2032
- Figure 83: Middle East & Africa NA Managed Mobility Service Market Revenue (Million), by Country 2024 & 2032
- Figure 84: Middle East & Africa NA Managed Mobility Service Market Volume (K Unit), by Country 2024 & 2032
- Figure 85: Middle East & Africa NA Managed Mobility Service Market Revenue Share (%), by Country 2024 & 2032
- Figure 86: Middle East & Africa NA Managed Mobility Service Market Volume Share (%), by Country 2024 & 2032
- Figure 87: Asia Pacific NA Managed Mobility Service Market Revenue (Million), by Type 2024 & 2032
- Figure 88: Asia Pacific NA Managed Mobility Service Market Volume (K Unit), by Type 2024 & 2032
- Figure 89: Asia Pacific NA Managed Mobility Service Market Revenue Share (%), by Type 2024 & 2032
- Figure 90: Asia Pacific NA Managed Mobility Service Market Volume Share (%), by Type 2024 & 2032
- Figure 91: Asia Pacific NA Managed Mobility Service Market Revenue (Million), by Deployment 2024 & 2032
- Figure 92: Asia Pacific NA Managed Mobility Service Market Volume (K Unit), by Deployment 2024 & 2032
- Figure 93: Asia Pacific NA Managed Mobility Service Market Revenue Share (%), by Deployment 2024 & 2032
- Figure 94: Asia Pacific NA Managed Mobility Service Market Volume Share (%), by Deployment 2024 & 2032
- Figure 95: Asia Pacific NA Managed Mobility Service Market Revenue (Million), by End-user Industry 2024 & 2032
- Figure 96: Asia Pacific NA Managed Mobility Service Market Volume (K Unit), by End-user Industry 2024 & 2032
- Figure 97: Asia Pacific NA Managed Mobility Service Market Revenue Share (%), by End-user Industry 2024 & 2032
- Figure 98: Asia Pacific NA Managed Mobility Service Market Volume Share (%), by End-user Industry 2024 & 2032
- Figure 99: Asia Pacific NA Managed Mobility Service Market Revenue (Million), by Country 2024 & 2032
- Figure 100: Asia Pacific NA Managed Mobility Service Market Volume (K Unit), by Country 2024 & 2032
- Figure 101: Asia Pacific NA Managed Mobility Service Market Revenue Share (%), by Country 2024 & 2032
- Figure 102: Asia Pacific NA Managed Mobility Service Market Volume Share (%), by Country 2024 & 2032
List of Tables
- Table 1: Global NA Managed Mobility Service Market Revenue Million Forecast, by Region 2019 & 2032
- Table 2: Global NA Managed Mobility Service Market Volume K Unit Forecast, by Region 2019 & 2032
- Table 3: Global NA Managed Mobility Service Market Revenue Million Forecast, by Type 2019 & 2032
- Table 4: Global NA Managed Mobility Service Market Volume K Unit Forecast, by Type 2019 & 2032
- Table 5: Global NA Managed Mobility Service Market Revenue Million Forecast, by Deployment 2019 & 2032
- Table 6: Global NA Managed Mobility Service Market Volume K Unit Forecast, by Deployment 2019 & 2032
- Table 7: Global NA Managed Mobility Service Market Revenue Million Forecast, by End-user Industry 2019 & 2032
- Table 8: Global NA Managed Mobility Service Market Volume K Unit Forecast, by End-user Industry 2019 & 2032
- Table 9: Global NA Managed Mobility Service Market Revenue Million Forecast, by Region 2019 & 2032
- Table 10: Global NA Managed Mobility Service Market Volume K Unit Forecast, by Region 2019 & 2032
- Table 11: Global NA Managed Mobility Service Market Revenue Million Forecast, by Country 2019 & 2032
- Table 12: Global NA Managed Mobility Service Market Volume K Unit Forecast, by Country 2019 & 2032
- Table 13: NA Managed Mobility Service Market Revenue (Million) Forecast, by Application 2019 & 2032
- Table 14: NA Managed Mobility Service Market Volume (K Unit) Forecast, by Application 2019 & 2032
- Table 15: Global NA Managed Mobility Service Market Revenue Million Forecast, by Country 2019 & 2032
- Table 16: Global NA Managed Mobility Service Market Volume K Unit Forecast, by Country 2019 & 2032
- Table 17: NA Managed Mobility Service Market Revenue (Million) Forecast, by Application 2019 & 2032
- Table 18: NA Managed Mobility Service Market Volume (K Unit) Forecast, by Application 2019 & 2032
- Table 19: Global NA Managed Mobility Service Market Revenue Million Forecast, by Country 2019 & 2032
- Table 20: Global NA Managed Mobility Service Market Volume K Unit Forecast, by Country 2019 & 2032
- Table 21: NA Managed Mobility Service Market Revenue (Million) Forecast, by Application 2019 & 2032
- Table 22: NA Managed Mobility Service Market Volume (K Unit) Forecast, by Application 2019 & 2032
- Table 23: Global NA Managed Mobility Service Market Revenue Million Forecast, by Country 2019 & 2032
- Table 24: Global NA Managed Mobility Service Market Volume K Unit Forecast, by Country 2019 & 2032
- Table 25: NA Managed Mobility Service Market Revenue (Million) Forecast, by Application 2019 & 2032
- Table 26: NA Managed Mobility Service Market Volume (K Unit) Forecast, by Application 2019 & 2032
- Table 27: Global NA Managed Mobility Service Market Revenue Million Forecast, by Country 2019 & 2032
- Table 28: Global NA Managed Mobility Service Market Volume K Unit Forecast, by Country 2019 & 2032
- Table 29: NA Managed Mobility Service Market Revenue (Million) Forecast, by Application 2019 & 2032
- Table 30: NA Managed Mobility Service Market Volume (K Unit) Forecast, by Application 2019 & 2032
- Table 31: Global NA Managed Mobility Service Market Revenue Million Forecast, by Type 2019 & 2032
- Table 32: Global NA Managed Mobility Service Market Volume K Unit Forecast, by Type 2019 & 2032
- Table 33: Global NA Managed Mobility Service Market Revenue Million Forecast, by Deployment 2019 & 2032
- Table 34: Global NA Managed Mobility Service Market Volume K Unit Forecast, by Deployment 2019 & 2032
- Table 35: Global NA Managed Mobility Service Market Revenue Million Forecast, by End-user Industry 2019 & 2032
- Table 36: Global NA Managed Mobility Service Market Volume K Unit Forecast, by End-user Industry 2019 & 2032
- Table 37: Global NA Managed Mobility Service Market Revenue Million Forecast, by Country 2019 & 2032
- Table 38: Global NA Managed Mobility Service Market Volume K Unit Forecast, by Country 2019 & 2032
- Table 39: United States NA Managed Mobility Service Market Revenue (Million) Forecast, by Application 2019 & 2032
- Table 40: United States NA Managed Mobility Service Market Volume (K Unit) Forecast, by Application 2019 & 2032
- Table 41: Canada NA Managed Mobility Service Market Revenue (Million) Forecast, by Application 2019 & 2032
- Table 42: Canada NA Managed Mobility Service Market Volume (K Unit) Forecast, by Application 2019 & 2032
- Table 43: Mexico NA Managed Mobility Service Market Revenue (Million) Forecast, by Application 2019 & 2032
- Table 44: Mexico NA Managed Mobility Service Market Volume (K Unit) Forecast, by Application 2019 & 2032
- Table 45: Global NA Managed Mobility Service Market Revenue Million Forecast, by Type 2019 & 2032
- Table 46: Global NA Managed Mobility Service Market Volume K Unit Forecast, by Type 2019 & 2032
- Table 47: Global NA Managed Mobility Service Market Revenue Million Forecast, by Deployment 2019 & 2032
- Table 48: Global NA Managed Mobility Service Market Volume K Unit Forecast, by Deployment 2019 & 2032
- Table 49: Global NA Managed Mobility Service Market Revenue Million Forecast, by End-user Industry 2019 & 2032
- Table 50: Global NA Managed Mobility Service Market Volume K Unit Forecast, by End-user Industry 2019 & 2032
- Table 51: Global NA Managed Mobility Service Market Revenue Million Forecast, by Country 2019 & 2032
- Table 52: Global NA Managed Mobility Service Market Volume K Unit Forecast, by Country 2019 & 2032
- Table 53: Brazil NA Managed Mobility Service Market Revenue (Million) Forecast, by Application 2019 & 2032
- Table 54: Brazil NA Managed Mobility Service Market Volume (K Unit) Forecast, by Application 2019 & 2032
- Table 55: Argentina NA Managed Mobility Service Market Revenue (Million) Forecast, by Application 2019 & 2032
- Table 56: Argentina NA Managed Mobility Service Market Volume (K Unit) Forecast, by Application 2019 & 2032
- Table 57: Rest of South America NA Managed Mobility Service Market Revenue (Million) Forecast, by Application 2019 & 2032
- Table 58: Rest of South America NA Managed Mobility Service Market Volume (K Unit) Forecast, by Application 2019 & 2032
- Table 59: Global NA Managed Mobility Service Market Revenue Million Forecast, by Type 2019 & 2032
- Table 60: Global NA Managed Mobility Service Market Volume K Unit Forecast, by Type 2019 & 2032
- Table 61: Global NA Managed Mobility Service Market Revenue Million Forecast, by Deployment 2019 & 2032
- Table 62: Global NA Managed Mobility Service Market Volume K Unit Forecast, by Deployment 2019 & 2032
- Table 63: Global NA Managed Mobility Service Market Revenue Million Forecast, by End-user Industry 2019 & 2032
- Table 64: Global NA Managed Mobility Service Market Volume K Unit Forecast, by End-user Industry 2019 & 2032
- Table 65: Global NA Managed Mobility Service Market Revenue Million Forecast, by Country 2019 & 2032
- Table 66: Global NA Managed Mobility Service Market Volume K Unit Forecast, by Country 2019 & 2032
- Table 67: United Kingdom NA Managed Mobility Service Market Revenue (Million) Forecast, by Application 2019 & 2032
- Table 68: United Kingdom NA Managed Mobility Service Market Volume (K Unit) Forecast, by Application 2019 & 2032
- Table 69: Germany NA Managed Mobility Service Market Revenue (Million) Forecast, by Application 2019 & 2032
- Table 70: Germany NA Managed Mobility Service Market Volume (K Unit) Forecast, by Application 2019 & 2032
- Table 71: France NA Managed Mobility Service Market Revenue (Million) Forecast, by Application 2019 & 2032
- Table 72: France NA Managed Mobility Service Market Volume (K Unit) Forecast, by Application 2019 & 2032
- Table 73: Italy NA Managed Mobility Service Market Revenue (Million) Forecast, by Application 2019 & 2032
- Table 74: Italy NA Managed Mobility Service Market Volume (K Unit) Forecast, by Application 2019 & 2032
- Table 75: Spain NA Managed Mobility Service Market Revenue (Million) Forecast, by Application 2019 & 2032
- Table 76: Spain NA Managed Mobility Service Market Volume (K Unit) Forecast, by Application 2019 & 2032
- Table 77: Russia NA Managed Mobility Service Market Revenue (Million) Forecast, by Application 2019 & 2032
- Table 78: Russia NA Managed Mobility Service Market Volume (K Unit) Forecast, by Application 2019 & 2032
- Table 79: Benelux NA Managed Mobility Service Market Revenue (Million) Forecast, by Application 2019 & 2032
- Table 80: Benelux NA Managed Mobility Service Market Volume (K Unit) Forecast, by Application 2019 & 2032
- Table 81: Nordics NA Managed Mobility Service Market Revenue (Million) Forecast, by Application 2019 & 2032
- Table 82: Nordics NA Managed Mobility Service Market Volume (K Unit) Forecast, by Application 2019 & 2032
- Table 83: Rest of Europe NA Managed Mobility Service Market Revenue (Million) Forecast, by Application 2019 & 2032
- Table 84: Rest of Europe NA Managed Mobility Service Market Volume (K Unit) Forecast, by Application 2019 & 2032
- Table 85: Global NA Managed Mobility Service Market Revenue Million Forecast, by Type 2019 & 2032
- Table 86: Global NA Managed Mobility Service Market Volume K Unit Forecast, by Type 2019 & 2032
- Table 87: Global NA Managed Mobility Service Market Revenue Million Forecast, by Deployment 2019 & 2032
- Table 88: Global NA Managed Mobility Service Market Volume K Unit Forecast, by Deployment 2019 & 2032
- Table 89: Global NA Managed Mobility Service Market Revenue Million Forecast, by End-user Industry 2019 & 2032
- Table 90: Global NA Managed Mobility Service Market Volume K Unit Forecast, by End-user Industry 2019 & 2032
- Table 91: Global NA Managed Mobility Service Market Revenue Million Forecast, by Country 2019 & 2032
- Table 92: Global NA Managed Mobility Service Market Volume K Unit Forecast, by Country 2019 & 2032
- Table 93: Turkey NA Managed Mobility Service Market Revenue (Million) Forecast, by Application 2019 & 2032
- Table 94: Turkey NA Managed Mobility Service Market Volume (K Unit) Forecast, by Application 2019 & 2032
- Table 95: Israel NA Managed Mobility Service Market Revenue (Million) Forecast, by Application 2019 & 2032
- Table 96: Israel NA Managed Mobility Service Market Volume (K Unit) Forecast, by Application 2019 & 2032
- Table 97: GCC NA Managed Mobility Service Market Revenue (Million) Forecast, by Application 2019 & 2032
- Table 98: GCC NA Managed Mobility Service Market Volume (K Unit) Forecast, by Application 2019 & 2032
- Table 99: North Africa NA Managed Mobility Service Market Revenue (Million) Forecast, by Application 2019 & 2032
- Table 100: North Africa NA Managed Mobility Service Market Volume (K Unit) Forecast, by Application 2019 & 2032
- Table 101: South Africa NA Managed Mobility Service Market Revenue (Million) Forecast, by Application 2019 & 2032
- Table 102: South Africa NA Managed Mobility Service Market Volume (K Unit) Forecast, by Application 2019 & 2032
- Table 103: Rest of Middle East & Africa NA Managed Mobility Service Market Revenue (Million) Forecast, by Application 2019 & 2032
- Table 104: Rest of Middle East & Africa NA Managed Mobility Service Market Volume (K Unit) Forecast, by Application 2019 & 2032
- Table 105: Global NA Managed Mobility Service Market Revenue Million Forecast, by Type 2019 & 2032
- Table 106: Global NA Managed Mobility Service Market Volume K Unit Forecast, by Type 2019 & 2032
- Table 107: Global NA Managed Mobility Service Market Revenue Million Forecast, by Deployment 2019 & 2032
- Table 108: Global NA Managed Mobility Service Market Volume K Unit Forecast, by Deployment 2019 & 2032
- Table 109: Global NA Managed Mobility Service Market Revenue Million Forecast, by End-user Industry 2019 & 2032
- Table 110: Global NA Managed Mobility Service Market Volume K Unit Forecast, by End-user Industry 2019 & 2032
- Table 111: Global NA Managed Mobility Service Market Revenue Million Forecast, by Country 2019 & 2032
- Table 112: Global NA Managed Mobility Service Market Volume K Unit Forecast, by Country 2019 & 2032
- Table 113: China NA Managed Mobility Service Market Revenue (Million) Forecast, by Application 2019 & 2032
- Table 114: China NA Managed Mobility Service Market Volume (K Unit) Forecast, by Application 2019 & 2032
- Table 115: India NA Managed Mobility Service Market Revenue (Million) Forecast, by Application 2019 & 2032
- Table 116: India NA Managed Mobility Service Market Volume (K Unit) Forecast, by Application 2019 & 2032
- Table 117: Japan NA Managed Mobility Service Market Revenue (Million) Forecast, by Application 2019 & 2032
- Table 118: Japan NA Managed Mobility Service Market Volume (K Unit) Forecast, by Application 2019 & 2032
- Table 119: South Korea NA Managed Mobility Service Market Revenue (Million) Forecast, by Application 2019 & 2032
- Table 120: South Korea NA Managed Mobility Service Market Volume (K Unit) Forecast, by Application 2019 & 2032
- Table 121: ASEAN NA Managed Mobility Service Market Revenue (Million) Forecast, by Application 2019 & 2032
- Table 122: ASEAN NA Managed Mobility Service Market Volume (K Unit) Forecast, by Application 2019 & 2032
- Table 123: Oceania NA Managed Mobility Service Market Revenue (Million) Forecast, by Application 2019 & 2032
- Table 124: Oceania NA Managed Mobility Service Market Volume (K Unit) Forecast, by Application 2019 & 2032
- Table 125: Rest of Asia Pacific NA Managed Mobility Service Market Revenue (Million) Forecast, by Application 2019 & 2032
- Table 126: Rest of Asia Pacific NA Managed Mobility Service Market Volume (K Unit) Forecast, by Application 2019 & 2032
Frequently Asked Questions
1. What is the projected Compound Annual Growth Rate (CAGR) of the NA Managed Mobility Service Market?
The projected CAGR is approximately 20.54%.
2. Which companies are prominent players in the NA Managed Mobility Service Market?
Key companies in the market include DELL Technologies, Accenture PLC, Citrix System Inc, Orange SA, IBM Corporation, Wipro Ltd, Fujitsu Ltd, Hewlett Packard Enterprise Company, Tech Mahindra Limited, AT&T Inc, Telefonica SA.
3. What are the main segments of the NA Managed Mobility Service Market?
The market segments include Type, Deployment, End-user Industry.
4. Can you provide details about the market size?
The market size is estimated to be USD XX Million as of 2022.
5. What are some drivers contributing to market growth?
; Increasing Acceptability for BYOD in Organizations; Companies Outsourcing IT Activities.
6. What are the notable trends driving market growth?
Mobile Application Management to Hold Major Share.
7. Are there any restraints impacting market growth?
; Lack of Control over Operations and Cost Visibility.
8. Can you provide examples of recent developments in the market?
N/A
9. What pricing options are available for accessing the report?
Pricing options include single-user, multi-user, and enterprise licenses priced at USD 4750, USD 4950, and USD 6800 respectively.
10. Is the market size provided in terms of value or volume?
The market size is provided in terms of value, measured in Million and volume, measured in K Unit.
11. Are there any specific market keywords associated with the report?
Yes, the market keyword associated with the report is "NA Managed Mobility Service Market," which aids in identifying and referencing the specific market segment covered.
12. How do I determine which pricing option suits my needs best?
The pricing options vary based on user requirements and access needs. Individual users may opt for single-user licenses, while businesses requiring broader access may choose multi-user or enterprise licenses for cost-effective access to the report.
13. Are there any additional resources or data provided in the NA Managed Mobility Service Market report?
While the report offers comprehensive insights, it's advisable to review the specific contents or supplementary materials provided to ascertain if additional resources or data are available.
14. How can I stay updated on further developments or reports in the NA Managed Mobility Service Market?
To stay informed about further developments, trends, and reports in the NA Managed Mobility Service Market, consider subscribing to industry newsletters, following relevant companies and organizations, or regularly checking reputable industry news sources and publications.
Methodology
Step 1 - Identification of Relevant Samples Size from Population Database


Step 2 - Approaches for Defining Global Market Size (Value, Volume* & Price*)

Note*: In applicable scenarios
Step 3 - Data Sources
Primary Research
- Web Analytics
- Survey Reports
- Research Institute
- Latest Research Reports
- Opinion Leaders
Secondary Research
- Annual Reports
- White Paper
- Latest Press Release
- Industry Association
- Paid Database
- Investor Presentations

Step 4 - Data Triangulation
Involves using different sources of information in order to increase the validity of a study
These sources are likely to be stakeholders in a program - participants, other researchers, program staff, other community members, and so on.
Then we put all data in single framework & apply various statistical tools to find out the dynamic on the market.
During the analysis stage, feedback from the stakeholder groups would be compared to determine areas of agreement as well as areas of divergence
