

Key Insights
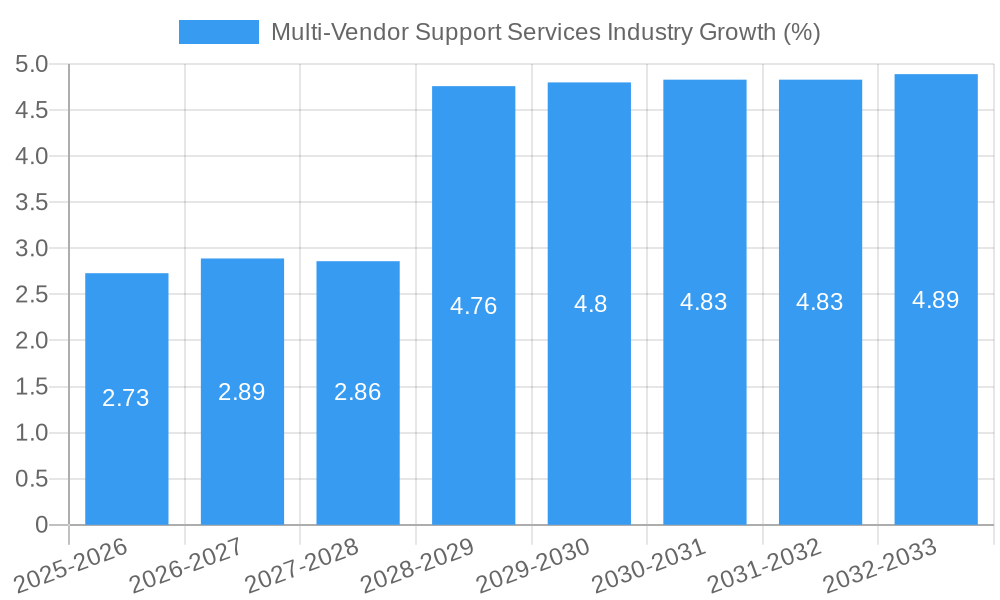
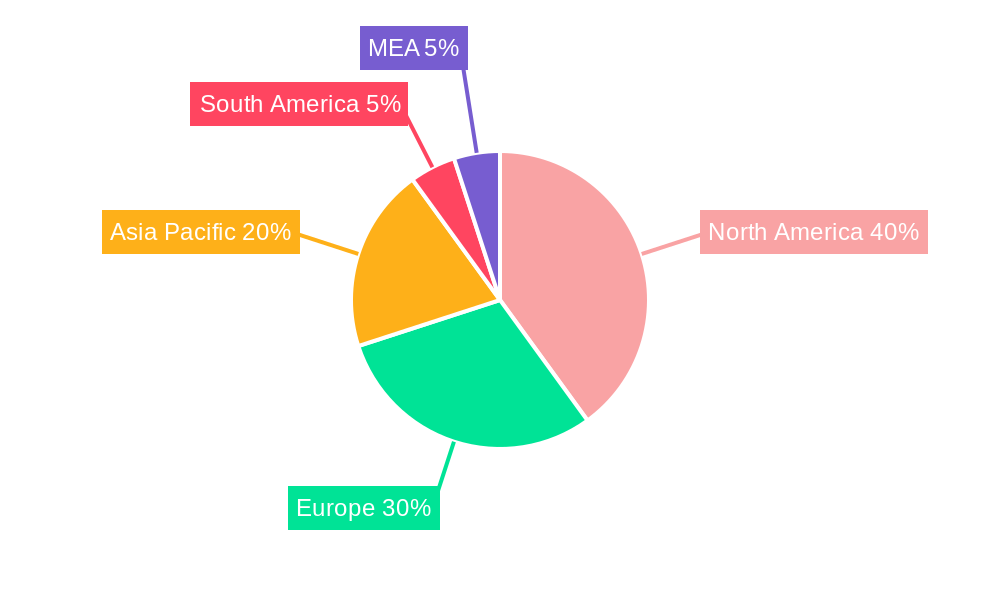
The multi-vendor support services market is experiencing robust growth, projected to reach a market size of $58.89 million in 2025 and exhibiting a Compound Annual Growth Rate (CAGR) of 4.55%. This expansion is driven by several key factors. The increasing complexity of IT infrastructure, coupled with the rising adoption of hybrid and multi-cloud environments, necessitates specialized support services that can seamlessly manage diverse vendor technologies. Businesses are increasingly seeking to optimize their IT spending and improve operational efficiency through consolidated support contracts, fueling demand for multi-vendor support providers. Furthermore, the growing adoption of digital transformation initiatives across various industry verticals like BFSI, healthcare, and IT & telecommunications is creating substantial opportunities for service providers offering comprehensive multi-vendor support solutions. The market is segmented by end-user verticals, service type (professional vs. managed), and enterprise size (SMEs vs. large enterprises), reflecting the diverse needs of different customer segments. North America currently holds a significant market share due to high IT adoption rates and a well-established ecosystem of support providers. However, significant growth potential exists in Asia-Pacific, driven by increasing digitalization and infrastructure investments across rapidly developing economies like India and China.
The competitive landscape is characterized by a mix of established players like IBM, Hewlett Packard Enterprise, and Microsoft, along with specialized multi-vendor support providers such as Quantum Corp and Clear Technologies. These companies are engaged in strategic partnerships, acquisitions, and technological innovations to expand their service offerings and market reach. Challenges faced by the market include managing the complexities of diverse vendor technologies, ensuring consistent service quality across various platforms, and the increasing need for skilled professionals in this specialized field. Nevertheless, the long-term outlook for the multi-vendor support services market remains positive, fueled by the ongoing trend of IT infrastructure diversification and the ever-increasing demand for efficient and reliable IT support across all industries. The forecast period of 2025-2033 promises further market expansion, driven by sustained growth across all segments and regions.
This comprehensive report provides a detailed analysis of the Multi-Vendor Support Services industry, offering invaluable insights for stakeholders across the value chain. With a study period spanning 2019-2033, a base year of 2025, and a forecast period of 2025-2033, this report unveils the market's dynamics, trends, and future potential. The market is projected to reach xx Million by 2033, exhibiting a CAGR of xx% during the forecast period.

Multi-Vendor Support Services Industry Market Dynamics & Concentration
The Multi-Vendor Support Services market is characterized by a moderately concentrated landscape, with several major players vying for market share. Key players like IBM Corporation, Microsoft Corporation, Oracle Corporation, and Dell Technologies Inc hold significant positions, leveraging their extensive expertise and established client bases. However, the market also witnesses the emergence of agile, specialized providers, driving competitive intensity. The market share of the top 5 players is estimated at xx%, indicating the presence of numerous smaller competitors.
Market concentration is influenced by several factors, including:
- Innovation Drivers: Continuous advancements in cloud computing, network technologies, and AI-driven support solutions are reshaping the competitive landscape, favoring companies with strong R&D capabilities.
- Regulatory Frameworks: Data privacy regulations and industry-specific compliance mandates influence vendor selection and service delivery, creating opportunities for specialized providers that excel in compliance adherence.
- Product Substitutes: The rise of self-service support portals and open-source solutions presents a degree of substitutability but doesn't entirely replace the need for specialized multi-vendor support expertise.
- End-User Trends: The increasing adoption of hybrid and multi-cloud environments fuels demand for comprehensive multi-vendor support services.
- M&A Activities: Consolidation in the market through mergers and acquisitions is anticipated to continue, particularly among companies aiming to expand their service portfolios and geographic reach. The number of M&A deals in the last five years is estimated at xx.
Multi-Vendor Support Services Industry Industry Trends & Analysis
The Multi-Vendor Support Services market is experiencing robust growth, driven by several key factors. The increasing complexity of IT infrastructures, the proliferation of cloud services, and the growing need for seamless integration across various vendor ecosystems are key drivers. The market's CAGR is projected at xx%, demonstrating considerable growth potential. Market penetration in key sectors like IT & Telecommunication and BFSI is high, driven by the need for robust and reliable support.
Technological disruptions, such as the shift towards cloud-native architectures and the adoption of AI-powered support tools, are reshaping the industry. Consumer preferences are trending towards integrated, proactive support solutions that minimize downtime and enhance operational efficiency. Competitive dynamics are characterized by continuous innovation, strategic partnerships, and expansion into new geographical markets. The market penetration for managed services is estimated at xx% in 2025, indicating significant growth opportunities.
Leading Markets & Segments in Multi-Vendor Support Services Industry
The Multi-Vendor Support Services market exhibits diverse regional and segmental growth dynamics.
Dominant Regions: North America and Europe currently dominate the market, driven by high IT adoption rates and robust digital infrastructure. However, the Asia-Pacific region is showing rapid growth due to increasing investments in IT and digital transformation across various sectors.
Dominant Segments:
- End-user Verticals: The IT & Telecommunication sector holds the largest share, followed by BFSI and Healthcare. High technological complexity and stringent regulatory compliance in these sectors drive demand for multi-vendor support.
- Service Type: Managed services are experiencing faster growth compared to professional services due to increasing preference for proactive support and cost optimization.
- Enterprise Size: Large enterprises currently drive a majority of the market, while SMEs are exhibiting increasing adoption, contributing to significant growth opportunities.
Key Drivers:
- IT & Telecommunication: High adoption of cloud services, complex network infrastructures, and 24/7 operational needs.
- BFSI: Stringent regulatory compliance, data security concerns, and the need for high availability.
- Healthcare: Patient data security, interoperability of medical devices, and compliance with HIPAA regulations.
- Economic Policies: Government investments in digital infrastructure and incentives for technology adoption significantly influence market growth.
Multi-Vendor Support Services Industry Product Developments
Recent product developments focus on AI-powered automation, predictive analytics for proactive support, and improved service integration across multiple vendor platforms. These advancements enhance efficiency, reduce resolution times, and improve overall customer experience. The market sees a trend toward cloud-based support platforms offering centralized management and monitoring capabilities. This trend aligns with the broader industry shift towards cloud computing and digital transformation.
Key Drivers of Multi-Vendor Support Services Industry Growth
The Multi-Vendor Support Services market's expansion is propelled by several factors:
- Technological advancements: The increasing adoption of cloud technologies, IoT, and AI-powered tools fuels the need for multi-vendor support capabilities.
- Economic growth: Investment in IT infrastructure and digital transformation across various industries directly correlates with multi-vendor support market growth.
- Regulatory changes: Stringent data privacy and security regulations create demand for specialized multi-vendor support expertise.
Challenges in the Multi-Vendor Support Services Industry Market
The market faces several challenges:
- Integration Complexity: Integrating support across various vendor systems and technologies can be technically complex and time-consuming.
- Skill Gaps: A shortage of skilled professionals experienced in supporting diverse IT ecosystems presents a barrier to market expansion.
- Competitive Pressure: The presence of numerous competitors, both large and small, intensifies the competition and puts pressure on pricing. This pressure is estimated to reduce profit margins by xx% by 2033.
Emerging Opportunities in Multi-Vendor Support Services Industry
Several factors promise long-term growth:
- Expansion into Emerging Markets: Significant opportunities exist in rapidly developing economies with increasing IT adoption.
- Strategic Partnerships: Collaboration between support providers and technology vendors creates synergistic opportunities and enhances service offerings.
- Advanced Automation: Integration of AI and machine learning into support workflows can improve efficiency and service quality, creating a competitive advantage.
Leading Players in the Multi-Vendor Support Services Industry Sector
- Quantum Corp
- Softcat plc
- IBM Corporation
- Hewlett Packard Enterprise Co
- Microsoft Corporation
- NetApp Inc
- Oracle Corporation
- Dell Technologies Inc
- Clear Technologies Inc
- Evernex Group SAS
- Blue Sky Group Ltd
Key Milestones in Multi-Vendor Support Services Industry Industry
- June 2022: Red Hat and Ericsson collaborate to streamline multi-vendor network integration, accelerating the launch of next-generation services. This partnership significantly impacted the market by improving interoperability and reducing integration complexities.
- October 2022: Google Cloud launches Third-Party Technology Support, addressing the challenges of troubleshooting multi-vendor cloud environments. This initiative significantly improves the support experience for organizations utilizing multiple cloud providers, driving market growth.
Strategic Outlook for Multi-Vendor Support Services Industry Market
The Multi-Vendor Support Services market is poised for sustained growth, driven by ongoing digital transformation, increased cloud adoption, and the growing complexity of IT infrastructure. Strategic opportunities lie in developing AI-powered solutions, forging strategic partnerships, and expanding into emerging markets. Focusing on proactive support and enhanced customer experience will be crucial for success in this dynamic market.
Multi-Vendor Support Services Industry Segmentation
-
1. Service Type
- 1.1. Professional
- 1.2. Managed
-
2. Enterprise Size
- 2.1. Small & Medium Enterprises
- 2.2. Large Enterprises
-
3. End-user Verticals
- 3.1. IT & Telecommunication
- 3.2. BFSI
- 3.3. Healthcare
- 3.4. Energy & Power
- 3.5. Industrial Manufacturing
- 3.6. Others (
Multi-Vendor Support Services Industry Segmentation By Geography
- 1. North America
- 2. Europe
- 3. Asia Pacific
- 4. Latin America
- 5. Middle East and Africa
Multi-Vendor Support Services Industry REPORT HIGHLIGHTS
| Aspects | Details |
|---|---|
| Study Period | 2019-2033 |
| Base Year | 2024 |
| Estimated Year | 2025 |
| Forecast Period | 2025-2033 |
| Historical Period | 2019-2024 |
| Growth Rate | CAGR of 4.55% from 2019-2033 |
| Segmentation |
|
Table of Contents
- 1. Introduction
- 1.1. Research Scope
- 1.2. Market Segmentation
- 1.3. Research Methodology
- 1.4. Definitions and Assumptions
- 2. Executive Summary
- 2.1. Introduction
- 3. Market Dynamics
- 3.1. Introduction
- 3.2. Market Drivers
- 3.2.1. Rising Maintenance Cost of OEM Services
- 3.3. Market Restrains
- 3.3.1. Expensive Integration and Maintenance activities; Concerns on Data Security and Privacy; Stringent Data Regulations Imposed in Various Regions
- 3.4. Market Trends
- 3.4.1. IT & Telecommunication Vertical is Expected to Grow at a Significant Rate Over the Forecast Period
- 4. Market Factor Analysis
- 4.1. Porters Five Forces
- 4.2. Supply/Value Chain
- 4.3. PESTEL analysis
- 4.4. Market Entropy
- 4.5. Patent/Trademark Analysis
- 5. Global Multi-Vendor Support Services Industry Analysis, Insights and Forecast, 2019-2031
- 5.1. Market Analysis, Insights and Forecast - by Service Type
- 5.1.1. Professional
- 5.1.2. Managed
- 5.2. Market Analysis, Insights and Forecast - by Enterprise Size
- 5.2.1. Small & Medium Enterprises
- 5.2.2. Large Enterprises
- 5.3. Market Analysis, Insights and Forecast - by End-user Verticals
- 5.3.1. IT & Telecommunication
- 5.3.2. BFSI
- 5.3.3. Healthcare
- 5.3.4. Energy & Power
- 5.3.5. Industrial Manufacturing
- 5.3.6. Others (
- 5.4. Market Analysis, Insights and Forecast - by Region
- 5.4.1. North America
- 5.4.2. Europe
- 5.4.3. Asia Pacific
- 5.4.4. Latin America
- 5.4.5. Middle East and Africa
- 5.1. Market Analysis, Insights and Forecast - by Service Type
- 6. North America Multi-Vendor Support Services Industry Analysis, Insights and Forecast, 2019-2031
- 6.1. Market Analysis, Insights and Forecast - by Service Type
- 6.1.1. Professional
- 6.1.2. Managed
- 6.2. Market Analysis, Insights and Forecast - by Enterprise Size
- 6.2.1. Small & Medium Enterprises
- 6.2.2. Large Enterprises
- 6.3. Market Analysis, Insights and Forecast - by End-user Verticals
- 6.3.1. IT & Telecommunication
- 6.3.2. BFSI
- 6.3.3. Healthcare
- 6.3.4. Energy & Power
- 6.3.5. Industrial Manufacturing
- 6.3.6. Others (
- 6.1. Market Analysis, Insights and Forecast - by Service Type
- 7. Europe Multi-Vendor Support Services Industry Analysis, Insights and Forecast, 2019-2031
- 7.1. Market Analysis, Insights and Forecast - by Service Type
- 7.1.1. Professional
- 7.1.2. Managed
- 7.2. Market Analysis, Insights and Forecast - by Enterprise Size
- 7.2.1. Small & Medium Enterprises
- 7.2.2. Large Enterprises
- 7.3. Market Analysis, Insights and Forecast - by End-user Verticals
- 7.3.1. IT & Telecommunication
- 7.3.2. BFSI
- 7.3.3. Healthcare
- 7.3.4. Energy & Power
- 7.3.5. Industrial Manufacturing
- 7.3.6. Others (
- 7.1. Market Analysis, Insights and Forecast - by Service Type
- 8. Asia Pacific Multi-Vendor Support Services Industry Analysis, Insights and Forecast, 2019-2031
- 8.1. Market Analysis, Insights and Forecast - by Service Type
- 8.1.1. Professional
- 8.1.2. Managed
- 8.2. Market Analysis, Insights and Forecast - by Enterprise Size
- 8.2.1. Small & Medium Enterprises
- 8.2.2. Large Enterprises
- 8.3. Market Analysis, Insights and Forecast - by End-user Verticals
- 8.3.1. IT & Telecommunication
- 8.3.2. BFSI
- 8.3.3. Healthcare
- 8.3.4. Energy & Power
- 8.3.5. Industrial Manufacturing
- 8.3.6. Others (
- 8.1. Market Analysis, Insights and Forecast - by Service Type
- 9. Latin America Multi-Vendor Support Services Industry Analysis, Insights and Forecast, 2019-2031
- 9.1. Market Analysis, Insights and Forecast - by Service Type
- 9.1.1. Professional
- 9.1.2. Managed
- 9.2. Market Analysis, Insights and Forecast - by Enterprise Size
- 9.2.1. Small & Medium Enterprises
- 9.2.2. Large Enterprises
- 9.3. Market Analysis, Insights and Forecast - by End-user Verticals
- 9.3.1. IT & Telecommunication
- 9.3.2. BFSI
- 9.3.3. Healthcare
- 9.3.4. Energy & Power
- 9.3.5. Industrial Manufacturing
- 9.3.6. Others (
- 9.1. Market Analysis, Insights and Forecast - by Service Type
- 10. Middle East and Africa Multi-Vendor Support Services Industry Analysis, Insights and Forecast, 2019-2031
- 10.1. Market Analysis, Insights and Forecast - by Service Type
- 10.1.1. Professional
- 10.1.2. Managed
- 10.2. Market Analysis, Insights and Forecast - by Enterprise Size
- 10.2.1. Small & Medium Enterprises
- 10.2.2. Large Enterprises
- 10.3. Market Analysis, Insights and Forecast - by End-user Verticals
- 10.3.1. IT & Telecommunication
- 10.3.2. BFSI
- 10.3.3. Healthcare
- 10.3.4. Energy & Power
- 10.3.5. Industrial Manufacturing
- 10.3.6. Others (
- 10.1. Market Analysis, Insights and Forecast - by Service Type
- 11. North America Multi-Vendor Support Services Industry Analysis, Insights and Forecast, 2019-2031
- 11.1. Market Analysis, Insights and Forecast - By Country/Sub-region
- 11.1.1 United States
- 11.1.2 Canada
- 11.1.3 Mexico
- 12. Europe Multi-Vendor Support Services Industry Analysis, Insights and Forecast, 2019-2031
- 12.1. Market Analysis, Insights and Forecast - By Country/Sub-region
- 12.1.1 Germany
- 12.1.2 United Kingdom
- 12.1.3 France
- 12.1.4 Spain
- 12.1.5 Italy
- 12.1.6 Spain
- 12.1.7 Belgium
- 12.1.8 Netherland
- 12.1.9 Nordics
- 12.1.10 Rest of Europe
- 13. Asia Pacific Multi-Vendor Support Services Industry Analysis, Insights and Forecast, 2019-2031
- 13.1. Market Analysis, Insights and Forecast - By Country/Sub-region
- 13.1.1 China
- 13.1.2 Japan
- 13.1.3 India
- 13.1.4 South Korea
- 13.1.5 Southeast Asia
- 13.1.6 Australia
- 13.1.7 Indonesia
- 13.1.8 Phillipes
- 13.1.9 Singapore
- 13.1.10 Thailandc
- 13.1.11 Rest of Asia Pacific
- 14. South America Multi-Vendor Support Services Industry Analysis, Insights and Forecast, 2019-2031
- 14.1. Market Analysis, Insights and Forecast - By Country/Sub-region
- 14.1.1 Brazil
- 14.1.2 Argentina
- 14.1.3 Peru
- 14.1.4 Chile
- 14.1.5 Colombia
- 14.1.6 Ecuador
- 14.1.7 Venezuela
- 14.1.8 Rest of South America
- 15. North America Multi-Vendor Support Services Industry Analysis, Insights and Forecast, 2019-2031
- 15.1. Market Analysis, Insights and Forecast - By Country/Sub-region
- 15.1.1 United States
- 15.1.2 Canada
- 15.1.3 Mexico
- 16. MEA Multi-Vendor Support Services Industry Analysis, Insights and Forecast, 2019-2031
- 16.1. Market Analysis, Insights and Forecast - By Country/Sub-region
- 16.1.1 United Arab Emirates
- 16.1.2 Saudi Arabia
- 16.1.3 South Africa
- 16.1.4 Rest of Middle East and Africa
- 17. Competitive Analysis
- 17.1. Global Market Share Analysis 2024
- 17.2. Company Profiles
- 17.2.1 Quantum Corp
- 17.2.1.1. Overview
- 17.2.1.2. Products
- 17.2.1.3. SWOT Analysis
- 17.2.1.4. Recent Developments
- 17.2.1.5. Financials (Based on Availability)
- 17.2.2 Softcat plc
- 17.2.2.1. Overview
- 17.2.2.2. Products
- 17.2.2.3. SWOT Analysis
- 17.2.2.4. Recent Developments
- 17.2.2.5. Financials (Based on Availability)
- 17.2.3 IBM Corporation
- 17.2.3.1. Overview
- 17.2.3.2. Products
- 17.2.3.3. SWOT Analysis
- 17.2.3.4. Recent Developments
- 17.2.3.5. Financials (Based on Availability)
- 17.2.4 Hewlett Packard Enterprise Co
- 17.2.4.1. Overview
- 17.2.4.2. Products
- 17.2.4.3. SWOT Analysis
- 17.2.4.4. Recent Developments
- 17.2.4.5. Financials (Based on Availability)
- 17.2.5 Microsoft Corporation
- 17.2.5.1. Overview
- 17.2.5.2. Products
- 17.2.5.3. SWOT Analysis
- 17.2.5.4. Recent Developments
- 17.2.5.5. Financials (Based on Availability)
- 17.2.6 NetApp Inc
- 17.2.6.1. Overview
- 17.2.6.2. Products
- 17.2.6.3. SWOT Analysis
- 17.2.6.4. Recent Developments
- 17.2.6.5. Financials (Based on Availability)
- 17.2.7 Oracle Corporation
- 17.2.7.1. Overview
- 17.2.7.2. Products
- 17.2.7.3. SWOT Analysis
- 17.2.7.4. Recent Developments
- 17.2.7.5. Financials (Based on Availability)
- 17.2.8 Dell Technologies Inc
- 17.2.8.1. Overview
- 17.2.8.2. Products
- 17.2.8.3. SWOT Analysis
- 17.2.8.4. Recent Developments
- 17.2.8.5. Financials (Based on Availability)
- 17.2.9 Clear Technologies Inc
- 17.2.9.1. Overview
- 17.2.9.2. Products
- 17.2.9.3. SWOT Analysis
- 17.2.9.4. Recent Developments
- 17.2.9.5. Financials (Based on Availability)
- 17.2.10 Evernex Group SAS
- 17.2.10.1. Overview
- 17.2.10.2. Products
- 17.2.10.3. SWOT Analysis
- 17.2.10.4. Recent Developments
- 17.2.10.5. Financials (Based on Availability)
- 17.2.11 Blue Sky Group Ltd
- 17.2.11.1. Overview
- 17.2.11.2. Products
- 17.2.11.3. SWOT Analysis
- 17.2.11.4. Recent Developments
- 17.2.11.5. Financials (Based on Availability)
- 17.2.1 Quantum Corp
List of Figures
- Figure 1: Global Multi-Vendor Support Services Industry Revenue Breakdown (Million, %) by Region 2024 & 2032
- Figure 2: North America Multi-Vendor Support Services Industry Revenue (Million), by Country 2024 & 2032
- Figure 3: North America Multi-Vendor Support Services Industry Revenue Share (%), by Country 2024 & 2032
- Figure 4: Europe Multi-Vendor Support Services Industry Revenue (Million), by Country 2024 & 2032
- Figure 5: Europe Multi-Vendor Support Services Industry Revenue Share (%), by Country 2024 & 2032
- Figure 6: Asia Pacific Multi-Vendor Support Services Industry Revenue (Million), by Country 2024 & 2032
- Figure 7: Asia Pacific Multi-Vendor Support Services Industry Revenue Share (%), by Country 2024 & 2032
- Figure 8: South America Multi-Vendor Support Services Industry Revenue (Million), by Country 2024 & 2032
- Figure 9: South America Multi-Vendor Support Services Industry Revenue Share (%), by Country 2024 & 2032
- Figure 10: North America Multi-Vendor Support Services Industry Revenue (Million), by Country 2024 & 2032
- Figure 11: North America Multi-Vendor Support Services Industry Revenue Share (%), by Country 2024 & 2032
- Figure 12: MEA Multi-Vendor Support Services Industry Revenue (Million), by Country 2024 & 2032
- Figure 13: MEA Multi-Vendor Support Services Industry Revenue Share (%), by Country 2024 & 2032
- Figure 14: North America Multi-Vendor Support Services Industry Revenue (Million), by Service Type 2024 & 2032
- Figure 15: North America Multi-Vendor Support Services Industry Revenue Share (%), by Service Type 2024 & 2032
- Figure 16: North America Multi-Vendor Support Services Industry Revenue (Million), by Enterprise Size 2024 & 2032
- Figure 17: North America Multi-Vendor Support Services Industry Revenue Share (%), by Enterprise Size 2024 & 2032
- Figure 18: North America Multi-Vendor Support Services Industry Revenue (Million), by End-user Verticals 2024 & 2032
- Figure 19: North America Multi-Vendor Support Services Industry Revenue Share (%), by End-user Verticals 2024 & 2032
- Figure 20: North America Multi-Vendor Support Services Industry Revenue (Million), by Country 2024 & 2032
- Figure 21: North America Multi-Vendor Support Services Industry Revenue Share (%), by Country 2024 & 2032
- Figure 22: Europe Multi-Vendor Support Services Industry Revenue (Million), by Service Type 2024 & 2032
- Figure 23: Europe Multi-Vendor Support Services Industry Revenue Share (%), by Service Type 2024 & 2032
- Figure 24: Europe Multi-Vendor Support Services Industry Revenue (Million), by Enterprise Size 2024 & 2032
- Figure 25: Europe Multi-Vendor Support Services Industry Revenue Share (%), by Enterprise Size 2024 & 2032
- Figure 26: Europe Multi-Vendor Support Services Industry Revenue (Million), by End-user Verticals 2024 & 2032
- Figure 27: Europe Multi-Vendor Support Services Industry Revenue Share (%), by End-user Verticals 2024 & 2032
- Figure 28: Europe Multi-Vendor Support Services Industry Revenue (Million), by Country 2024 & 2032
- Figure 29: Europe Multi-Vendor Support Services Industry Revenue Share (%), by Country 2024 & 2032
- Figure 30: Asia Pacific Multi-Vendor Support Services Industry Revenue (Million), by Service Type 2024 & 2032
- Figure 31: Asia Pacific Multi-Vendor Support Services Industry Revenue Share (%), by Service Type 2024 & 2032
- Figure 32: Asia Pacific Multi-Vendor Support Services Industry Revenue (Million), by Enterprise Size 2024 & 2032
- Figure 33: Asia Pacific Multi-Vendor Support Services Industry Revenue Share (%), by Enterprise Size 2024 & 2032
- Figure 34: Asia Pacific Multi-Vendor Support Services Industry Revenue (Million), by End-user Verticals 2024 & 2032
- Figure 35: Asia Pacific Multi-Vendor Support Services Industry Revenue Share (%), by End-user Verticals 2024 & 2032
- Figure 36: Asia Pacific Multi-Vendor Support Services Industry Revenue (Million), by Country 2024 & 2032
- Figure 37: Asia Pacific Multi-Vendor Support Services Industry Revenue Share (%), by Country 2024 & 2032
- Figure 38: Latin America Multi-Vendor Support Services Industry Revenue (Million), by Service Type 2024 & 2032
- Figure 39: Latin America Multi-Vendor Support Services Industry Revenue Share (%), by Service Type 2024 & 2032
- Figure 40: Latin America Multi-Vendor Support Services Industry Revenue (Million), by Enterprise Size 2024 & 2032
- Figure 41: Latin America Multi-Vendor Support Services Industry Revenue Share (%), by Enterprise Size 2024 & 2032
- Figure 42: Latin America Multi-Vendor Support Services Industry Revenue (Million), by End-user Verticals 2024 & 2032
- Figure 43: Latin America Multi-Vendor Support Services Industry Revenue Share (%), by End-user Verticals 2024 & 2032
- Figure 44: Latin America Multi-Vendor Support Services Industry Revenue (Million), by Country 2024 & 2032
- Figure 45: Latin America Multi-Vendor Support Services Industry Revenue Share (%), by Country 2024 & 2032
- Figure 46: Middle East and Africa Multi-Vendor Support Services Industry Revenue (Million), by Service Type 2024 & 2032
- Figure 47: Middle East and Africa Multi-Vendor Support Services Industry Revenue Share (%), by Service Type 2024 & 2032
- Figure 48: Middle East and Africa Multi-Vendor Support Services Industry Revenue (Million), by Enterprise Size 2024 & 2032
- Figure 49: Middle East and Africa Multi-Vendor Support Services Industry Revenue Share (%), by Enterprise Size 2024 & 2032
- Figure 50: Middle East and Africa Multi-Vendor Support Services Industry Revenue (Million), by End-user Verticals 2024 & 2032
- Figure 51: Middle East and Africa Multi-Vendor Support Services Industry Revenue Share (%), by End-user Verticals 2024 & 2032
- Figure 52: Middle East and Africa Multi-Vendor Support Services Industry Revenue (Million), by Country 2024 & 2032
- Figure 53: Middle East and Africa Multi-Vendor Support Services Industry Revenue Share (%), by Country 2024 & 2032
List of Tables
- Table 1: Global Multi-Vendor Support Services Industry Revenue Million Forecast, by Region 2019 & 2032
- Table 2: Global Multi-Vendor Support Services Industry Revenue Million Forecast, by Service Type 2019 & 2032
- Table 3: Global Multi-Vendor Support Services Industry Revenue Million Forecast, by Enterprise Size 2019 & 2032
- Table 4: Global Multi-Vendor Support Services Industry Revenue Million Forecast, by End-user Verticals 2019 & 2032
- Table 5: Global Multi-Vendor Support Services Industry Revenue Million Forecast, by Region 2019 & 2032
- Table 6: Global Multi-Vendor Support Services Industry Revenue Million Forecast, by Country 2019 & 2032
- Table 7: United States Multi-Vendor Support Services Industry Revenue (Million) Forecast, by Application 2019 & 2032
- Table 8: Canada Multi-Vendor Support Services Industry Revenue (Million) Forecast, by Application 2019 & 2032
- Table 9: Mexico Multi-Vendor Support Services Industry Revenue (Million) Forecast, by Application 2019 & 2032
- Table 10: Global Multi-Vendor Support Services Industry Revenue Million Forecast, by Country 2019 & 2032
- Table 11: Germany Multi-Vendor Support Services Industry Revenue (Million) Forecast, by Application 2019 & 2032
- Table 12: United Kingdom Multi-Vendor Support Services Industry Revenue (Million) Forecast, by Application 2019 & 2032
- Table 13: France Multi-Vendor Support Services Industry Revenue (Million) Forecast, by Application 2019 & 2032
- Table 14: Spain Multi-Vendor Support Services Industry Revenue (Million) Forecast, by Application 2019 & 2032
- Table 15: Italy Multi-Vendor Support Services Industry Revenue (Million) Forecast, by Application 2019 & 2032
- Table 16: Spain Multi-Vendor Support Services Industry Revenue (Million) Forecast, by Application 2019 & 2032
- Table 17: Belgium Multi-Vendor Support Services Industry Revenue (Million) Forecast, by Application 2019 & 2032
- Table 18: Netherland Multi-Vendor Support Services Industry Revenue (Million) Forecast, by Application 2019 & 2032
- Table 19: Nordics Multi-Vendor Support Services Industry Revenue (Million) Forecast, by Application 2019 & 2032
- Table 20: Rest of Europe Multi-Vendor Support Services Industry Revenue (Million) Forecast, by Application 2019 & 2032
- Table 21: Global Multi-Vendor Support Services Industry Revenue Million Forecast, by Country 2019 & 2032
- Table 22: China Multi-Vendor Support Services Industry Revenue (Million) Forecast, by Application 2019 & 2032
- Table 23: Japan Multi-Vendor Support Services Industry Revenue (Million) Forecast, by Application 2019 & 2032
- Table 24: India Multi-Vendor Support Services Industry Revenue (Million) Forecast, by Application 2019 & 2032
- Table 25: South Korea Multi-Vendor Support Services Industry Revenue (Million) Forecast, by Application 2019 & 2032
- Table 26: Southeast Asia Multi-Vendor Support Services Industry Revenue (Million) Forecast, by Application 2019 & 2032
- Table 27: Australia Multi-Vendor Support Services Industry Revenue (Million) Forecast, by Application 2019 & 2032
- Table 28: Indonesia Multi-Vendor Support Services Industry Revenue (Million) Forecast, by Application 2019 & 2032
- Table 29: Phillipes Multi-Vendor Support Services Industry Revenue (Million) Forecast, by Application 2019 & 2032
- Table 30: Singapore Multi-Vendor Support Services Industry Revenue (Million) Forecast, by Application 2019 & 2032
- Table 31: Thailandc Multi-Vendor Support Services Industry Revenue (Million) Forecast, by Application 2019 & 2032
- Table 32: Rest of Asia Pacific Multi-Vendor Support Services Industry Revenue (Million) Forecast, by Application 2019 & 2032
- Table 33: Global Multi-Vendor Support Services Industry Revenue Million Forecast, by Country 2019 & 2032
- Table 34: Brazil Multi-Vendor Support Services Industry Revenue (Million) Forecast, by Application 2019 & 2032
- Table 35: Argentina Multi-Vendor Support Services Industry Revenue (Million) Forecast, by Application 2019 & 2032
- Table 36: Peru Multi-Vendor Support Services Industry Revenue (Million) Forecast, by Application 2019 & 2032
- Table 37: Chile Multi-Vendor Support Services Industry Revenue (Million) Forecast, by Application 2019 & 2032
- Table 38: Colombia Multi-Vendor Support Services Industry Revenue (Million) Forecast, by Application 2019 & 2032
- Table 39: Ecuador Multi-Vendor Support Services Industry Revenue (Million) Forecast, by Application 2019 & 2032
- Table 40: Venezuela Multi-Vendor Support Services Industry Revenue (Million) Forecast, by Application 2019 & 2032
- Table 41: Rest of South America Multi-Vendor Support Services Industry Revenue (Million) Forecast, by Application 2019 & 2032
- Table 42: Global Multi-Vendor Support Services Industry Revenue Million Forecast, by Country 2019 & 2032
- Table 43: United States Multi-Vendor Support Services Industry Revenue (Million) Forecast, by Application 2019 & 2032
- Table 44: Canada Multi-Vendor Support Services Industry Revenue (Million) Forecast, by Application 2019 & 2032
- Table 45: Mexico Multi-Vendor Support Services Industry Revenue (Million) Forecast, by Application 2019 & 2032
- Table 46: Global Multi-Vendor Support Services Industry Revenue Million Forecast, by Country 2019 & 2032
- Table 47: United Arab Emirates Multi-Vendor Support Services Industry Revenue (Million) Forecast, by Application 2019 & 2032
- Table 48: Saudi Arabia Multi-Vendor Support Services Industry Revenue (Million) Forecast, by Application 2019 & 2032
- Table 49: South Africa Multi-Vendor Support Services Industry Revenue (Million) Forecast, by Application 2019 & 2032
- Table 50: Rest of Middle East and Africa Multi-Vendor Support Services Industry Revenue (Million) Forecast, by Application 2019 & 2032
- Table 51: Global Multi-Vendor Support Services Industry Revenue Million Forecast, by Service Type 2019 & 2032
- Table 52: Global Multi-Vendor Support Services Industry Revenue Million Forecast, by Enterprise Size 2019 & 2032
- Table 53: Global Multi-Vendor Support Services Industry Revenue Million Forecast, by End-user Verticals 2019 & 2032
- Table 54: Global Multi-Vendor Support Services Industry Revenue Million Forecast, by Country 2019 & 2032
- Table 55: Global Multi-Vendor Support Services Industry Revenue Million Forecast, by Service Type 2019 & 2032
- Table 56: Global Multi-Vendor Support Services Industry Revenue Million Forecast, by Enterprise Size 2019 & 2032
- Table 57: Global Multi-Vendor Support Services Industry Revenue Million Forecast, by End-user Verticals 2019 & 2032
- Table 58: Global Multi-Vendor Support Services Industry Revenue Million Forecast, by Country 2019 & 2032
- Table 59: Global Multi-Vendor Support Services Industry Revenue Million Forecast, by Service Type 2019 & 2032
- Table 60: Global Multi-Vendor Support Services Industry Revenue Million Forecast, by Enterprise Size 2019 & 2032
- Table 61: Global Multi-Vendor Support Services Industry Revenue Million Forecast, by End-user Verticals 2019 & 2032
- Table 62: Global Multi-Vendor Support Services Industry Revenue Million Forecast, by Country 2019 & 2032
- Table 63: Global Multi-Vendor Support Services Industry Revenue Million Forecast, by Service Type 2019 & 2032
- Table 64: Global Multi-Vendor Support Services Industry Revenue Million Forecast, by Enterprise Size 2019 & 2032
- Table 65: Global Multi-Vendor Support Services Industry Revenue Million Forecast, by End-user Verticals 2019 & 2032
- Table 66: Global Multi-Vendor Support Services Industry Revenue Million Forecast, by Country 2019 & 2032
- Table 67: Global Multi-Vendor Support Services Industry Revenue Million Forecast, by Service Type 2019 & 2032
- Table 68: Global Multi-Vendor Support Services Industry Revenue Million Forecast, by Enterprise Size 2019 & 2032
- Table 69: Global Multi-Vendor Support Services Industry Revenue Million Forecast, by End-user Verticals 2019 & 2032
- Table 70: Global Multi-Vendor Support Services Industry Revenue Million Forecast, by Country 2019 & 2032
Frequently Asked Questions
1. What is the projected Compound Annual Growth Rate (CAGR) of the Multi-Vendor Support Services Industry?
The projected CAGR is approximately 4.55%.
2. Which companies are prominent players in the Multi-Vendor Support Services Industry?
Key companies in the market include Quantum Corp, Softcat plc, IBM Corporation, Hewlett Packard Enterprise Co, Microsoft Corporation, NetApp Inc, Oracle Corporation, Dell Technologies Inc, Clear Technologies Inc, Evernex Group SAS, Blue Sky Group Ltd.
3. What are the main segments of the Multi-Vendor Support Services Industry?
The market segments include Service Type, Enterprise Size, End-user Verticals.
4. Can you provide details about the market size?
The market size is estimated to be USD 58.89 Million as of 2022.
5. What are some drivers contributing to market growth?
Rising Maintenance Cost of OEM Services.
6. What are the notable trends driving market growth?
IT & Telecommunication Vertical is Expected to Grow at a Significant Rate Over the Forecast Period.
7. Are there any restraints impacting market growth?
Expensive Integration and Maintenance activities; Concerns on Data Security and Privacy; Stringent Data Regulations Imposed in Various Regions.
8. Can you provide examples of recent developments in the market?
October 2022 - It might be challenging to troubleshoot cloud investments when using numerous cloud providers and apps. Because of this, Google Cloud Third-Party Technology Support is offered as a feature with Premium Support for Google Cloud and is designed to seamlessly resolve issues involving many vendors while also setting up, configuring, and troubleshooting organizations. Intending to foster and ensure infrastructure innovation in the cloud, HashiCorp, a Google technology partner, regularly collaborates with Google Cloud.
9. What pricing options are available for accessing the report?
Pricing options include single-user, multi-user, and enterprise licenses priced at USD 4750, USD 5250, and USD 8750 respectively.
10. Is the market size provided in terms of value or volume?
The market size is provided in terms of value, measured in Million.
11. Are there any specific market keywords associated with the report?
Yes, the market keyword associated with the report is "Multi-Vendor Support Services Industry," which aids in identifying and referencing the specific market segment covered.
12. How do I determine which pricing option suits my needs best?
The pricing options vary based on user requirements and access needs. Individual users may opt for single-user licenses, while businesses requiring broader access may choose multi-user or enterprise licenses for cost-effective access to the report.
13. Are there any additional resources or data provided in the Multi-Vendor Support Services Industry report?
While the report offers comprehensive insights, it's advisable to review the specific contents or supplementary materials provided to ascertain if additional resources or data are available.
14. How can I stay updated on further developments or reports in the Multi-Vendor Support Services Industry?
To stay informed about further developments, trends, and reports in the Multi-Vendor Support Services Industry, consider subscribing to industry newsletters, following relevant companies and organizations, or regularly checking reputable industry news sources and publications.
Methodology
Step 1 - Identification of Relevant Samples Size from Population Database


Step 2 - Approaches for Defining Global Market Size (Value, Volume* & Price*)

Note*: In applicable scenarios
Step 3 - Data Sources
Primary Research
- Web Analytics
- Survey Reports
- Research Institute
- Latest Research Reports
- Opinion Leaders
Secondary Research
- Annual Reports
- White Paper
- Latest Press Release
- Industry Association
- Paid Database
- Investor Presentations

Step 4 - Data Triangulation
Involves using different sources of information in order to increase the validity of a study
These sources are likely to be stakeholders in a program - participants, other researchers, program staff, other community members, and so on.
Then we put all data in single framework & apply various statistical tools to find out the dynamic on the market.
During the analysis stage, feedback from the stakeholder groups would be compared to determine areas of agreement as well as areas of divergence
