

Key Insights
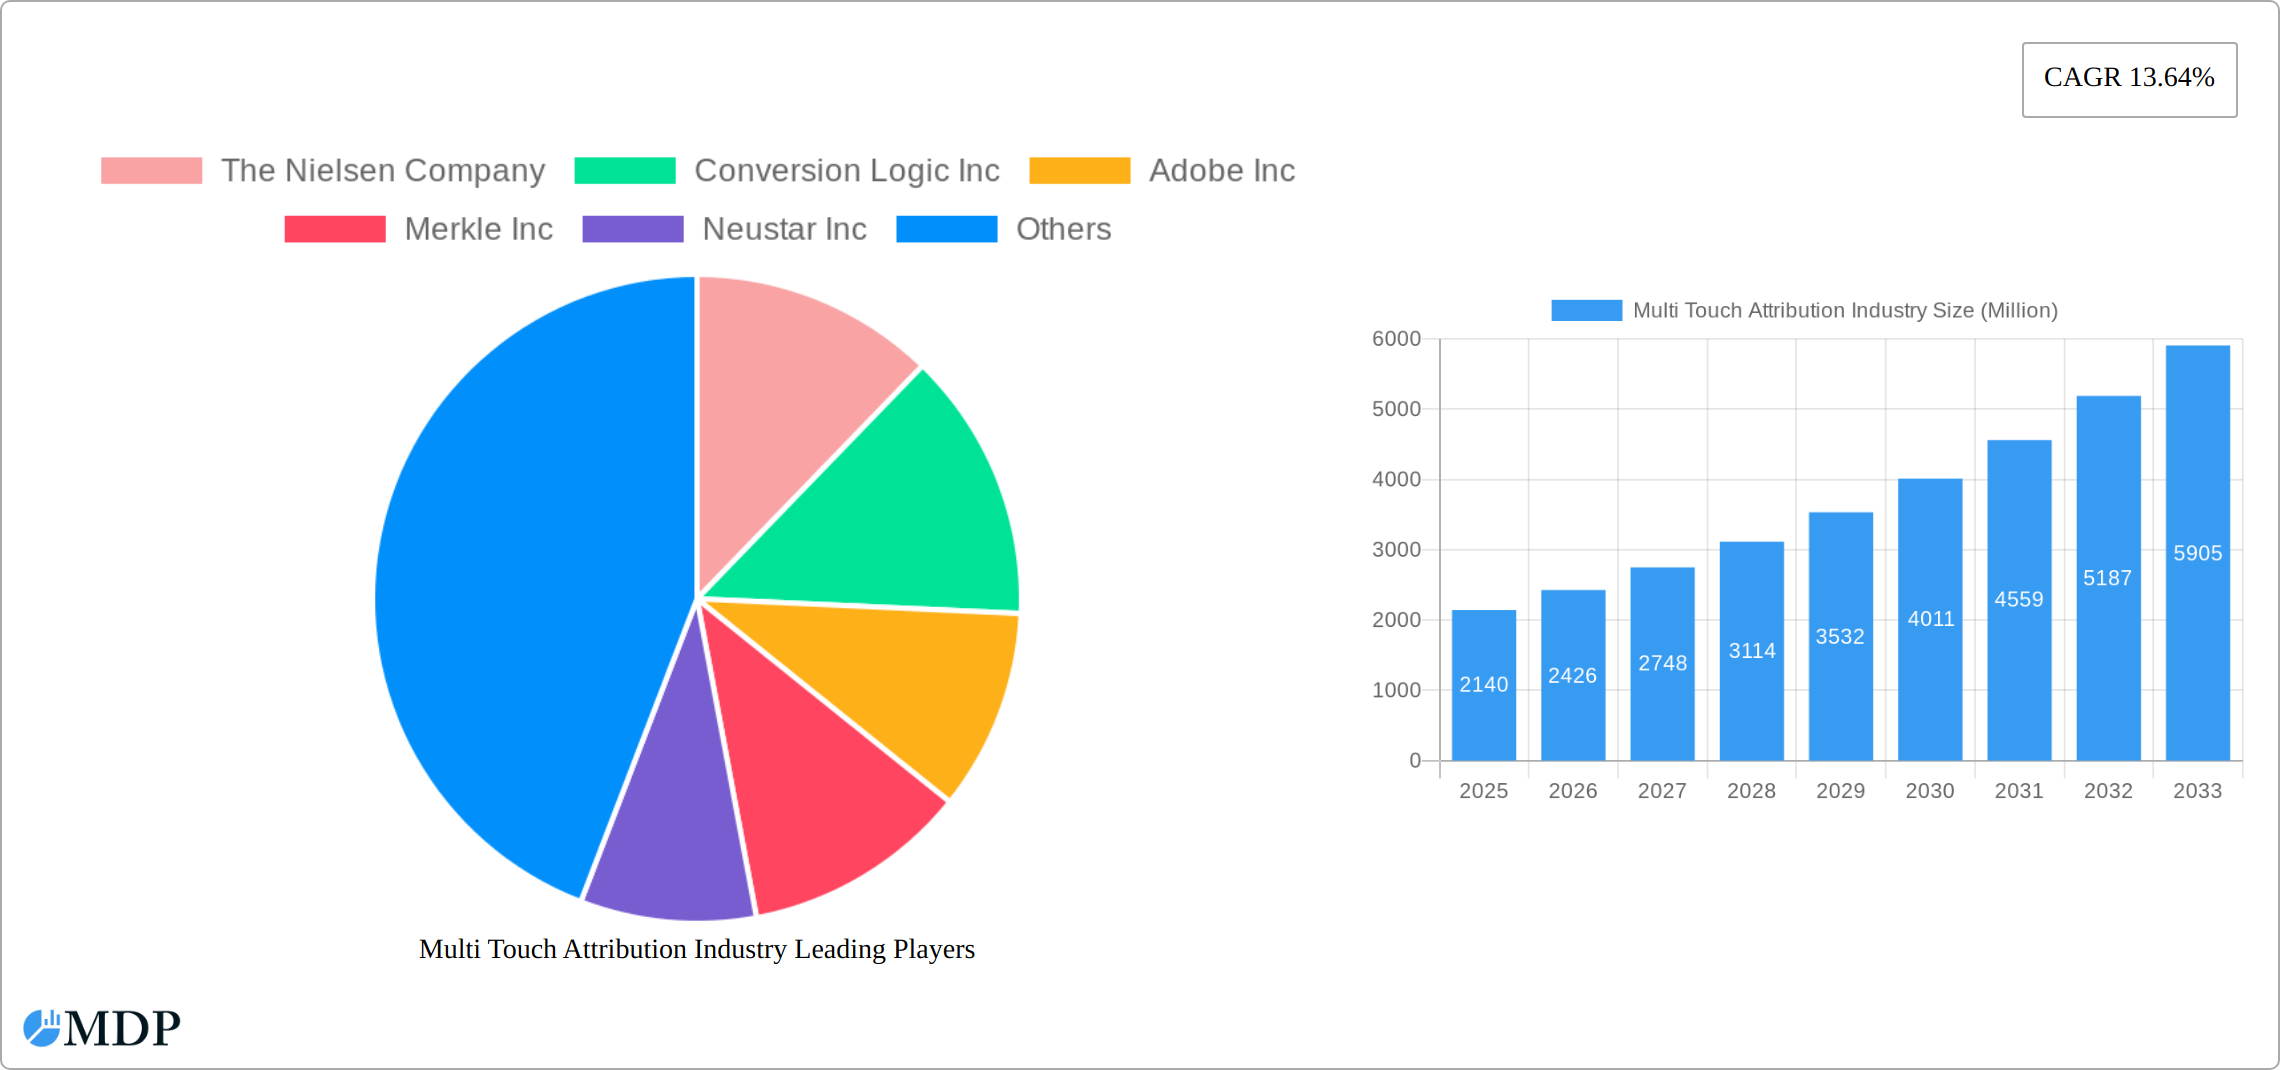
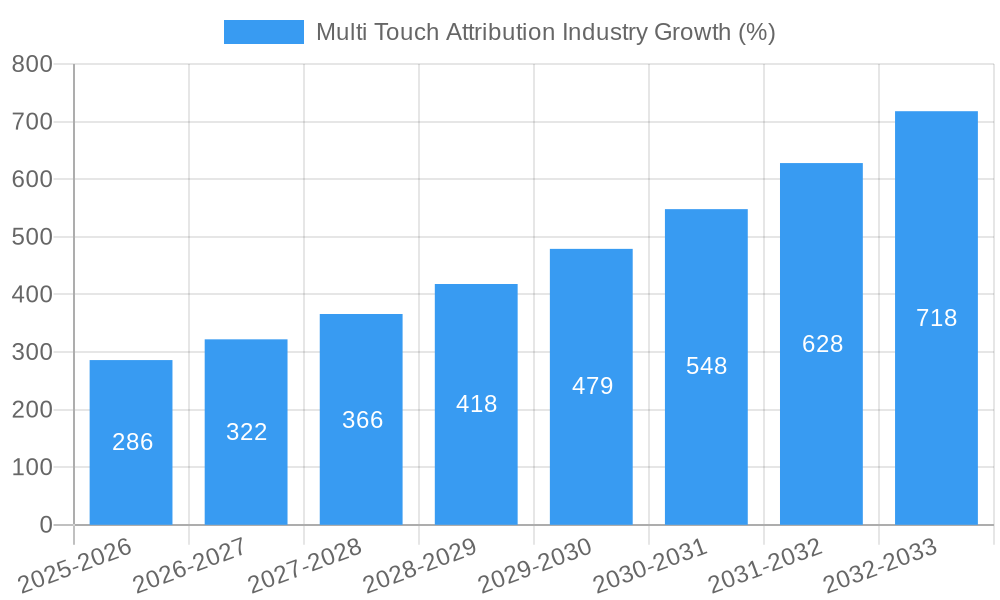
The Multi-Touch Attribution (MTA) market, valued at $2.14 billion in 2025, is experiencing robust growth, projected to expand at a Compound Annual Growth Rate (CAGR) of 13.64% from 2025 to 2033. This surge is fueled by several key factors. The increasing reliance on digital marketing necessitates accurate measurement of campaign effectiveness beyond last-click attribution. Businesses across various sectors, including Retail & E-commerce, BFSI (Banking, Financial Services, and Insurance), IT & Telecom, and Consumer Electronics, are adopting MTA solutions to optimize their marketing ROI and understand the complete customer journey. Furthermore, advancements in data analytics and machine learning are enabling more sophisticated MTA models, providing deeper insights into customer behavior and channel interactions. The growing adoption of omnichannel marketing strategies further emphasizes the need for comprehensive attribution solutions to track customer interactions across multiple touchpoints. Competition is intensifying, with established players like Nielsen and Adobe alongside newer entrants like AppsFlyer and LeadsRx vying for market share. Geographic expansion is also a prominent driver, with North America currently holding a significant market share but considerable growth potential in Asia-Pacific and other emerging regions.
The market faces some challenges, notably data privacy concerns and the increasing complexity of marketing ecosystems. Data silos and difficulties in integrating data from different sources can hinder accurate attribution. However, the continued evolution of data privacy regulations is pushing innovation towards privacy-preserving MTA methods. The ongoing demand for improved marketing efficiency and ROI will likely overcome these hurdles, ensuring consistent market growth. Specific segments like healthcare and life sciences, given their rigorous data regulations, represent a promising but initially slower-growth niche. The ongoing development of more robust and transparent MTA solutions addressing these regulatory challenges will unlock this segment's considerable potential. Overall, the MTA market presents a compelling investment opportunity with significant future growth prospects driven by technological advancements and evolving marketing strategies.
Unlock Growth in the Multi-Touch Attribution Industry: A Comprehensive Market Report (2019-2033)
This in-depth report provides a comprehensive analysis of the Multi-Touch Attribution (MTA) industry, offering invaluable insights for stakeholders seeking to navigate this dynamic market. From market dynamics and concentration to leading players and emerging opportunities, this report covers all essential aspects, projecting a market value of $XX Million by 2033.
Study Period: 2019-2033 Base Year: 2025 Estimated Year: 2025 Forecast Period: 2025-2033 Historical Period: 2019-2024
Multi Touch Attribution Industry Market Dynamics & Concentration
The Multi-Touch Attribution (MTA) industry is experiencing significant growth, driven by the increasing need for precise marketing measurement and optimization. Market concentration is moderate, with several key players holding significant shares, but a fragmented landscape also exists, presenting opportunities for new entrants. Innovation is a crucial driver, with companies continually developing advanced algorithms and integrating new data sources to enhance attribution accuracy. Regulatory frameworks, such as data privacy regulations (e.g., GDPR, CCPA), are influencing industry practices, necessitating compliance and shaping data usage strategies. Product substitutes, such as simpler last-click attribution models, remain present but are gradually losing ground to the superior precision offered by MTA solutions. End-user trends favor more sophisticated attribution models that account for complex customer journeys across multiple touchpoints. Mergers and acquisitions (M&A) activity is moderate, with approximately XX M&A deals recorded in the historical period (2019-2024), indicating a consolidation trend within the market. Key players such as The Nielsen Company and Adobe Inc hold a significant market share of approximately xx%, while smaller players collectively account for the remaining xx%.
Multi Touch Attribution Industry Industry Trends & Analysis
The MTA industry exhibits a robust Compound Annual Growth Rate (CAGR) of XX% during the forecast period (2025-2033), fueled by several key trends. The rising adoption of digital marketing strategies across various industries creates an increased demand for accurate attribution models. Technological disruptions, such as the rise of AI and machine learning, are enhancing MTA capabilities, improving accuracy, and enabling more sophisticated analysis. Evolving consumer preferences, including increased expectations for personalized experiences, necessitate a granular understanding of customer journeys, further bolstering the demand for MTA solutions. Intense competitive dynamics drive innovation and pricing pressures, benefiting consumers but requiring vendors to constantly differentiate their offerings. Market penetration is currently estimated at XX% in 2025, projected to reach XX% by 2033.
Leading Markets & Segments in Multi Touch Attribution Industry
The Retail & E-commerce segment currently dominates the MTA market, driven by its high reliance on diverse digital marketing channels and the need to optimize ROI across complex customer journeys. The BFSI and IT & Telecom sectors demonstrate strong growth potential, with increasing investment in digital marketing and a growing awareness of the importance of precise attribution.
Key Drivers:
- Retail & E-commerce: High reliance on digital marketing, competitive landscape, need for precise ROI measurement.
- BFSI: Growing adoption of digital channels for customer acquisition and retention, focus on personalized customer experience.
- IT & Telecom: Complex customer journeys, increasing investments in digital marketing campaigns, need for accurate campaign performance assessment.
Other segments, including Consumer Electronics, Travel & Tourism, and Healthcare & Life Sciences, exhibit steady growth, with market penetration rates varying based on industry-specific digital marketing maturity. The North American region currently holds the largest market share, owing to factors such as high digital marketing adoption and advanced technological infrastructure.
Multi Touch Attribution Industry Product Developments
Recent innovations in MTA solutions focus on enhancing accuracy, integrating more data sources, and improving user experience. AI-powered algorithms are improving the ability to handle complex interactions and account for non-linear customer journeys. Integration with existing marketing technology stacks and data platforms simplifies implementation and streamlines data flow. The competitive advantage lies in offering accurate, actionable insights, and seamless integration with existing marketing workflows, enhancing user-friendliness and accessibility.
Key Drivers of Multi Touch Attribution Industry Growth
Technological advancements, particularly in AI and machine learning, are paramount, enabling more accurate and sophisticated attribution models. Economic factors, such as increased marketing budgets and a growing focus on ROI, fuel adoption. The evolving regulatory landscape, while posing challenges, also drives demand for compliant and transparent attribution solutions.
Challenges in the Multi Touch Attribution Industry Market
Data privacy regulations create compliance hurdles and limit data usage. Integration complexities with existing marketing technology stacks pose implementation challenges for some businesses. The intense competition necessitates continuous innovation and pricing pressure. These factors contribute to a projected annual loss of approximately $XX Million due to delayed implementations and lost revenue opportunities.
Emerging Opportunities in Multi Touch Attribution Industry
Technological breakthroughs, such as the development of more advanced attribution models and improved data integration capabilities, will open new possibilities. Strategic partnerships between MTA vendors and other marketing technology providers will create comprehensive solutions. Expansion into new markets, particularly in developing economies with growing digital marketing adoption, presents significant potential for growth.
Leading Players in the Multi Touch Attribution Industry Sector
- The Nielsen Company
- Conversion Logic Inc
- Adobe Inc
- Merkle Inc
- Neustar Inc
- Engagio Inc
- Ipsos Group SA
- Equifax Inc
- AppsFlyer
- LeadsRx Inc
- LeanData Inc
- Manthan
Key Milestones in Multi Touch Attribution Industry Industry
- May 2022: Clinch and Neustar collaborated, enhancing real-time campaign insights.
- March 2022: Quotient launched impression-based multi-touch media measurement methodology.
These milestones showcase the industry's continuous innovation and its increasing focus on providing marketers with more comprehensive and real-time data.
Strategic Outlook for Multi Touch Attribution Industry Market
The MTA industry is poised for substantial growth, driven by technological advancements, increased marketing budgets, and a growing demand for precise marketing measurement. Strategic partnerships and expansion into emerging markets will be crucial for continued success. Companies that successfully adapt to the evolving regulatory landscape and offer user-friendly, integrated solutions will be best positioned to capitalize on this significant market opportunity.
Multi Touch Attribution Industry Segmentation
-
1. End-user Industry
- 1.1. Retail & E-commerce
- 1.2. BFSI
- 1.3. IT & Telecom
- 1.4. Consumer Electronics
- 1.5. Travel & Tourism
- 1.6. Other En
Multi Touch Attribution Industry Segmentation By Geography
- 1. North America
- 2. Europe
- 3. Asia Pacific
- 4. Latin America
- 5. Middle East and Africa

Multi Touch Attribution Industry REPORT HIGHLIGHTS
| Aspects | Details |
|---|---|
| Study Period | 2019-2033 |
| Base Year | 2024 |
| Estimated Year | 2025 |
| Forecast Period | 2025-2033 |
| Historical Period | 2019-2024 |
| Growth Rate | CAGR of 13.64% from 2019-2033 |
| Segmentation |
|
Table of Contents
- 1. Introduction
- 1.1. Research Scope
- 1.2. Market Segmentation
- 1.3. Research Methodology
- 1.4. Definitions and Assumptions
- 2. Executive Summary
- 2.1. Introduction
- 3. Market Dynamics
- 3.1. Introduction
- 3.2. Market Drivers
- 3.2.1 Increasing Focus of Marketers on Maximizing the ROI; Growing Number of Marketing Channels and Need for Optimization of Marketing Expenditure; Adoption of Technology and Solutions such as AI
- 3.2.2 Big Data
- 3.2.3 and Cloud Computing in Marketing
- 3.3. Market Restrains
- 3.3.1 Skepticism About Shifting from Existing Marketing Practices
- 3.3.2 Training and Change Management
- 3.4. Market Trends
- 3.4.1. Retail & E-commerce Industry Expected to Show Maximum Growth
- 4. Market Factor Analysis
- 4.1. Porters Five Forces
- 4.2. Supply/Value Chain
- 4.3. PESTEL analysis
- 4.4. Market Entropy
- 4.5. Patent/Trademark Analysis
- 5. Global Multi Touch Attribution Industry Analysis, Insights and Forecast, 2019-2031
- 5.1. Market Analysis, Insights and Forecast - by End-user Industry
- 5.1.1. Retail & E-commerce
- 5.1.2. BFSI
- 5.1.3. IT & Telecom
- 5.1.4. Consumer Electronics
- 5.1.5. Travel & Tourism
- 5.1.6. Other En
- 5.2. Market Analysis, Insights and Forecast - by Region
- 5.2.1. North America
- 5.2.2. Europe
- 5.2.3. Asia Pacific
- 5.2.4. Latin America
- 5.2.5. Middle East and Africa
- 5.1. Market Analysis, Insights and Forecast - by End-user Industry
- 6. North America Multi Touch Attribution Industry Analysis, Insights and Forecast, 2019-2031
- 6.1. Market Analysis, Insights and Forecast - by End-user Industry
- 6.1.1. Retail & E-commerce
- 6.1.2. BFSI
- 6.1.3. IT & Telecom
- 6.1.4. Consumer Electronics
- 6.1.5. Travel & Tourism
- 6.1.6. Other En
- 6.1. Market Analysis, Insights and Forecast - by End-user Industry
- 7. Europe Multi Touch Attribution Industry Analysis, Insights and Forecast, 2019-2031
- 7.1. Market Analysis, Insights and Forecast - by End-user Industry
- 7.1.1. Retail & E-commerce
- 7.1.2. BFSI
- 7.1.3. IT & Telecom
- 7.1.4. Consumer Electronics
- 7.1.5. Travel & Tourism
- 7.1.6. Other En
- 7.1. Market Analysis, Insights and Forecast - by End-user Industry
- 8. Asia Pacific Multi Touch Attribution Industry Analysis, Insights and Forecast, 2019-2031
- 8.1. Market Analysis, Insights and Forecast - by End-user Industry
- 8.1.1. Retail & E-commerce
- 8.1.2. BFSI
- 8.1.3. IT & Telecom
- 8.1.4. Consumer Electronics
- 8.1.5. Travel & Tourism
- 8.1.6. Other En
- 8.1. Market Analysis, Insights and Forecast - by End-user Industry
- 9. Latin America Multi Touch Attribution Industry Analysis, Insights and Forecast, 2019-2031
- 9.1. Market Analysis, Insights and Forecast - by End-user Industry
- 9.1.1. Retail & E-commerce
- 9.1.2. BFSI
- 9.1.3. IT & Telecom
- 9.1.4. Consumer Electronics
- 9.1.5. Travel & Tourism
- 9.1.6. Other En
- 9.1. Market Analysis, Insights and Forecast - by End-user Industry
- 10. Middle East and Africa Multi Touch Attribution Industry Analysis, Insights and Forecast, 2019-2031
- 10.1. Market Analysis, Insights and Forecast - by End-user Industry
- 10.1.1. Retail & E-commerce
- 10.1.2. BFSI
- 10.1.3. IT & Telecom
- 10.1.4. Consumer Electronics
- 10.1.5. Travel & Tourism
- 10.1.6. Other En
- 10.1. Market Analysis, Insights and Forecast - by End-user Industry
- 11. North America Multi Touch Attribution Industry Analysis, Insights and Forecast, 2019-2031
- 11.1. Market Analysis, Insights and Forecast - By Country/Sub-region
- 11.1.1 United States
- 11.1.2 Canada
- 11.1.3 Mexico
- 12. Europe Multi Touch Attribution Industry Analysis, Insights and Forecast, 2019-2031
- 12.1. Market Analysis, Insights and Forecast - By Country/Sub-region
- 12.1.1 Germany
- 12.1.2 United Kingdom
- 12.1.3 France
- 12.1.4 Spain
- 12.1.5 Italy
- 12.1.6 Spain
- 12.1.7 Belgium
- 12.1.8 Netherland
- 12.1.9 Nordics
- 12.1.10 Rest of Europe
- 13. Asia Pacific Multi Touch Attribution Industry Analysis, Insights and Forecast, 2019-2031
- 13.1. Market Analysis, Insights and Forecast - By Country/Sub-region
- 13.1.1 China
- 13.1.2 Japan
- 13.1.3 India
- 13.1.4 South Korea
- 13.1.5 Southeast Asia
- 13.1.6 Australia
- 13.1.7 Indonesia
- 13.1.8 Phillipes
- 13.1.9 Singapore
- 13.1.10 Thailandc
- 13.1.11 Rest of Asia Pacific
- 14. South America Multi Touch Attribution Industry Analysis, Insights and Forecast, 2019-2031
- 14.1. Market Analysis, Insights and Forecast - By Country/Sub-region
- 14.1.1 Brazil
- 14.1.2 Argentina
- 14.1.3 Peru
- 14.1.4 Chile
- 14.1.5 Colombia
- 14.1.6 Ecuador
- 14.1.7 Venezuela
- 14.1.8 Rest of South America
- 15. North America Multi Touch Attribution Industry Analysis, Insights and Forecast, 2019-2031
- 15.1. Market Analysis, Insights and Forecast - By Country/Sub-region
- 15.1.1 United States
- 15.1.2 Canada
- 15.1.3 Mexico
- 16. MEA Multi Touch Attribution Industry Analysis, Insights and Forecast, 2019-2031
- 16.1. Market Analysis, Insights and Forecast - By Country/Sub-region
- 16.1.1 United Arab Emirates
- 16.1.2 Saudi Arabia
- 16.1.3 South Africa
- 16.1.4 Rest of Middle East and Africa
- 17. Competitive Analysis
- 17.1. Global Market Share Analysis 2024
- 17.2. Company Profiles
- 17.2.1 The Nielsen Company
- 17.2.1.1. Overview
- 17.2.1.2. Products
- 17.2.1.3. SWOT Analysis
- 17.2.1.4. Recent Developments
- 17.2.1.5. Financials (Based on Availability)
- 17.2.2 Conversion Logic Inc
- 17.2.2.1. Overview
- 17.2.2.2. Products
- 17.2.2.3. SWOT Analysis
- 17.2.2.4. Recent Developments
- 17.2.2.5. Financials (Based on Availability)
- 17.2.3 Adobe Inc
- 17.2.3.1. Overview
- 17.2.3.2. Products
- 17.2.3.3. SWOT Analysis
- 17.2.3.4. Recent Developments
- 17.2.3.5. Financials (Based on Availability)
- 17.2.4 Merkle Inc
- 17.2.4.1. Overview
- 17.2.4.2. Products
- 17.2.4.3. SWOT Analysis
- 17.2.4.4. Recent Developments
- 17.2.4.5. Financials (Based on Availability)
- 17.2.5 Neustar Inc
- 17.2.5.1. Overview
- 17.2.5.2. Products
- 17.2.5.3. SWOT Analysis
- 17.2.5.4. Recent Developments
- 17.2.5.5. Financials (Based on Availability)
- 17.2.6 Engagio Inc
- 17.2.6.1. Overview
- 17.2.6.2. Products
- 17.2.6.3. SWOT Analysis
- 17.2.6.4. Recent Developments
- 17.2.6.5. Financials (Based on Availability)
- 17.2.7 Ipsos Group SA
- 17.2.7.1. Overview
- 17.2.7.2. Products
- 17.2.7.3. SWOT Analysis
- 17.2.7.4. Recent Developments
- 17.2.7.5. Financials (Based on Availability)
- 17.2.8 Equifax Inc
- 17.2.8.1. Overview
- 17.2.8.2. Products
- 17.2.8.3. SWOT Analysis
- 17.2.8.4. Recent Developments
- 17.2.8.5. Financials (Based on Availability)
- 17.2.9 AppsFlyer
- 17.2.9.1. Overview
- 17.2.9.2. Products
- 17.2.9.3. SWOT Analysis
- 17.2.9.4. Recent Developments
- 17.2.9.5. Financials (Based on Availability)
- 17.2.10 LeadsRx Inc
- 17.2.10.1. Overview
- 17.2.10.2. Products
- 17.2.10.3. SWOT Analysis
- 17.2.10.4. Recent Developments
- 17.2.10.5. Financials (Based on Availability)
- 17.2.11 LeanData Inc
- 17.2.11.1. Overview
- 17.2.11.2. Products
- 17.2.11.3. SWOT Analysis
- 17.2.11.4. Recent Developments
- 17.2.11.5. Financials (Based on Availability)
- 17.2.12 Manthan
- 17.2.12.1. Overview
- 17.2.12.2. Products
- 17.2.12.3. SWOT Analysis
- 17.2.12.4. Recent Developments
- 17.2.12.5. Financials (Based on Availability)
- 17.2.1 The Nielsen Company
List of Figures
- Figure 1: Global Multi Touch Attribution Industry Revenue Breakdown (Million, %) by Region 2024 & 2032
- Figure 2: Global Multi Touch Attribution Industry Volume Breakdown (K Unit, %) by Region 2024 & 2032
- Figure 3: North America Multi Touch Attribution Industry Revenue (Million), by Country 2024 & 2032
- Figure 4: North America Multi Touch Attribution Industry Volume (K Unit), by Country 2024 & 2032
- Figure 5: North America Multi Touch Attribution Industry Revenue Share (%), by Country 2024 & 2032
- Figure 6: North America Multi Touch Attribution Industry Volume Share (%), by Country 2024 & 2032
- Figure 7: Europe Multi Touch Attribution Industry Revenue (Million), by Country 2024 & 2032
- Figure 8: Europe Multi Touch Attribution Industry Volume (K Unit), by Country 2024 & 2032
- Figure 9: Europe Multi Touch Attribution Industry Revenue Share (%), by Country 2024 & 2032
- Figure 10: Europe Multi Touch Attribution Industry Volume Share (%), by Country 2024 & 2032
- Figure 11: Asia Pacific Multi Touch Attribution Industry Revenue (Million), by Country 2024 & 2032
- Figure 12: Asia Pacific Multi Touch Attribution Industry Volume (K Unit), by Country 2024 & 2032
- Figure 13: Asia Pacific Multi Touch Attribution Industry Revenue Share (%), by Country 2024 & 2032
- Figure 14: Asia Pacific Multi Touch Attribution Industry Volume Share (%), by Country 2024 & 2032
- Figure 15: South America Multi Touch Attribution Industry Revenue (Million), by Country 2024 & 2032
- Figure 16: South America Multi Touch Attribution Industry Volume (K Unit), by Country 2024 & 2032
- Figure 17: South America Multi Touch Attribution Industry Revenue Share (%), by Country 2024 & 2032
- Figure 18: South America Multi Touch Attribution Industry Volume Share (%), by Country 2024 & 2032
- Figure 19: North America Multi Touch Attribution Industry Revenue (Million), by Country 2024 & 2032
- Figure 20: North America Multi Touch Attribution Industry Volume (K Unit), by Country 2024 & 2032
- Figure 21: North America Multi Touch Attribution Industry Revenue Share (%), by Country 2024 & 2032
- Figure 22: North America Multi Touch Attribution Industry Volume Share (%), by Country 2024 & 2032
- Figure 23: MEA Multi Touch Attribution Industry Revenue (Million), by Country 2024 & 2032
- Figure 24: MEA Multi Touch Attribution Industry Volume (K Unit), by Country 2024 & 2032
- Figure 25: MEA Multi Touch Attribution Industry Revenue Share (%), by Country 2024 & 2032
- Figure 26: MEA Multi Touch Attribution Industry Volume Share (%), by Country 2024 & 2032
- Figure 27: North America Multi Touch Attribution Industry Revenue (Million), by End-user Industry 2024 & 2032
- Figure 28: North America Multi Touch Attribution Industry Volume (K Unit), by End-user Industry 2024 & 2032
- Figure 29: North America Multi Touch Attribution Industry Revenue Share (%), by End-user Industry 2024 & 2032
- Figure 30: North America Multi Touch Attribution Industry Volume Share (%), by End-user Industry 2024 & 2032
- Figure 31: North America Multi Touch Attribution Industry Revenue (Million), by Country 2024 & 2032
- Figure 32: North America Multi Touch Attribution Industry Volume (K Unit), by Country 2024 & 2032
- Figure 33: North America Multi Touch Attribution Industry Revenue Share (%), by Country 2024 & 2032
- Figure 34: North America Multi Touch Attribution Industry Volume Share (%), by Country 2024 & 2032
- Figure 35: Europe Multi Touch Attribution Industry Revenue (Million), by End-user Industry 2024 & 2032
- Figure 36: Europe Multi Touch Attribution Industry Volume (K Unit), by End-user Industry 2024 & 2032
- Figure 37: Europe Multi Touch Attribution Industry Revenue Share (%), by End-user Industry 2024 & 2032
- Figure 38: Europe Multi Touch Attribution Industry Volume Share (%), by End-user Industry 2024 & 2032
- Figure 39: Europe Multi Touch Attribution Industry Revenue (Million), by Country 2024 & 2032
- Figure 40: Europe Multi Touch Attribution Industry Volume (K Unit), by Country 2024 & 2032
- Figure 41: Europe Multi Touch Attribution Industry Revenue Share (%), by Country 2024 & 2032
- Figure 42: Europe Multi Touch Attribution Industry Volume Share (%), by Country 2024 & 2032
- Figure 43: Asia Pacific Multi Touch Attribution Industry Revenue (Million), by End-user Industry 2024 & 2032
- Figure 44: Asia Pacific Multi Touch Attribution Industry Volume (K Unit), by End-user Industry 2024 & 2032
- Figure 45: Asia Pacific Multi Touch Attribution Industry Revenue Share (%), by End-user Industry 2024 & 2032
- Figure 46: Asia Pacific Multi Touch Attribution Industry Volume Share (%), by End-user Industry 2024 & 2032
- Figure 47: Asia Pacific Multi Touch Attribution Industry Revenue (Million), by Country 2024 & 2032
- Figure 48: Asia Pacific Multi Touch Attribution Industry Volume (K Unit), by Country 2024 & 2032
- Figure 49: Asia Pacific Multi Touch Attribution Industry Revenue Share (%), by Country 2024 & 2032
- Figure 50: Asia Pacific Multi Touch Attribution Industry Volume Share (%), by Country 2024 & 2032
- Figure 51: Latin America Multi Touch Attribution Industry Revenue (Million), by End-user Industry 2024 & 2032
- Figure 52: Latin America Multi Touch Attribution Industry Volume (K Unit), by End-user Industry 2024 & 2032
- Figure 53: Latin America Multi Touch Attribution Industry Revenue Share (%), by End-user Industry 2024 & 2032
- Figure 54: Latin America Multi Touch Attribution Industry Volume Share (%), by End-user Industry 2024 & 2032
- Figure 55: Latin America Multi Touch Attribution Industry Revenue (Million), by Country 2024 & 2032
- Figure 56: Latin America Multi Touch Attribution Industry Volume (K Unit), by Country 2024 & 2032
- Figure 57: Latin America Multi Touch Attribution Industry Revenue Share (%), by Country 2024 & 2032
- Figure 58: Latin America Multi Touch Attribution Industry Volume Share (%), by Country 2024 & 2032
- Figure 59: Middle East and Africa Multi Touch Attribution Industry Revenue (Million), by End-user Industry 2024 & 2032
- Figure 60: Middle East and Africa Multi Touch Attribution Industry Volume (K Unit), by End-user Industry 2024 & 2032
- Figure 61: Middle East and Africa Multi Touch Attribution Industry Revenue Share (%), by End-user Industry 2024 & 2032
- Figure 62: Middle East and Africa Multi Touch Attribution Industry Volume Share (%), by End-user Industry 2024 & 2032
- Figure 63: Middle East and Africa Multi Touch Attribution Industry Revenue (Million), by Country 2024 & 2032
- Figure 64: Middle East and Africa Multi Touch Attribution Industry Volume (K Unit), by Country 2024 & 2032
- Figure 65: Middle East and Africa Multi Touch Attribution Industry Revenue Share (%), by Country 2024 & 2032
- Figure 66: Middle East and Africa Multi Touch Attribution Industry Volume Share (%), by Country 2024 & 2032
List of Tables
- Table 1: Global Multi Touch Attribution Industry Revenue Million Forecast, by Region 2019 & 2032
- Table 2: Global Multi Touch Attribution Industry Volume K Unit Forecast, by Region 2019 & 2032
- Table 3: Global Multi Touch Attribution Industry Revenue Million Forecast, by End-user Industry 2019 & 2032
- Table 4: Global Multi Touch Attribution Industry Volume K Unit Forecast, by End-user Industry 2019 & 2032
- Table 5: Global Multi Touch Attribution Industry Revenue Million Forecast, by Region 2019 & 2032
- Table 6: Global Multi Touch Attribution Industry Volume K Unit Forecast, by Region 2019 & 2032
- Table 7: Global Multi Touch Attribution Industry Revenue Million Forecast, by Country 2019 & 2032
- Table 8: Global Multi Touch Attribution Industry Volume K Unit Forecast, by Country 2019 & 2032
- Table 9: United States Multi Touch Attribution Industry Revenue (Million) Forecast, by Application 2019 & 2032
- Table 10: United States Multi Touch Attribution Industry Volume (K Unit) Forecast, by Application 2019 & 2032
- Table 11: Canada Multi Touch Attribution Industry Revenue (Million) Forecast, by Application 2019 & 2032
- Table 12: Canada Multi Touch Attribution Industry Volume (K Unit) Forecast, by Application 2019 & 2032
- Table 13: Mexico Multi Touch Attribution Industry Revenue (Million) Forecast, by Application 2019 & 2032
- Table 14: Mexico Multi Touch Attribution Industry Volume (K Unit) Forecast, by Application 2019 & 2032
- Table 15: Global Multi Touch Attribution Industry Revenue Million Forecast, by Country 2019 & 2032
- Table 16: Global Multi Touch Attribution Industry Volume K Unit Forecast, by Country 2019 & 2032
- Table 17: Germany Multi Touch Attribution Industry Revenue (Million) Forecast, by Application 2019 & 2032
- Table 18: Germany Multi Touch Attribution Industry Volume (K Unit) Forecast, by Application 2019 & 2032
- Table 19: United Kingdom Multi Touch Attribution Industry Revenue (Million) Forecast, by Application 2019 & 2032
- Table 20: United Kingdom Multi Touch Attribution Industry Volume (K Unit) Forecast, by Application 2019 & 2032
- Table 21: France Multi Touch Attribution Industry Revenue (Million) Forecast, by Application 2019 & 2032
- Table 22: France Multi Touch Attribution Industry Volume (K Unit) Forecast, by Application 2019 & 2032
- Table 23: Spain Multi Touch Attribution Industry Revenue (Million) Forecast, by Application 2019 & 2032
- Table 24: Spain Multi Touch Attribution Industry Volume (K Unit) Forecast, by Application 2019 & 2032
- Table 25: Italy Multi Touch Attribution Industry Revenue (Million) Forecast, by Application 2019 & 2032
- Table 26: Italy Multi Touch Attribution Industry Volume (K Unit) Forecast, by Application 2019 & 2032
- Table 27: Spain Multi Touch Attribution Industry Revenue (Million) Forecast, by Application 2019 & 2032
- Table 28: Spain Multi Touch Attribution Industry Volume (K Unit) Forecast, by Application 2019 & 2032
- Table 29: Belgium Multi Touch Attribution Industry Revenue (Million) Forecast, by Application 2019 & 2032
- Table 30: Belgium Multi Touch Attribution Industry Volume (K Unit) Forecast, by Application 2019 & 2032
- Table 31: Netherland Multi Touch Attribution Industry Revenue (Million) Forecast, by Application 2019 & 2032
- Table 32: Netherland Multi Touch Attribution Industry Volume (K Unit) Forecast, by Application 2019 & 2032
- Table 33: Nordics Multi Touch Attribution Industry Revenue (Million) Forecast, by Application 2019 & 2032
- Table 34: Nordics Multi Touch Attribution Industry Volume (K Unit) Forecast, by Application 2019 & 2032
- Table 35: Rest of Europe Multi Touch Attribution Industry Revenue (Million) Forecast, by Application 2019 & 2032
- Table 36: Rest of Europe Multi Touch Attribution Industry Volume (K Unit) Forecast, by Application 2019 & 2032
- Table 37: Global Multi Touch Attribution Industry Revenue Million Forecast, by Country 2019 & 2032
- Table 38: Global Multi Touch Attribution Industry Volume K Unit Forecast, by Country 2019 & 2032
- Table 39: China Multi Touch Attribution Industry Revenue (Million) Forecast, by Application 2019 & 2032
- Table 40: China Multi Touch Attribution Industry Volume (K Unit) Forecast, by Application 2019 & 2032
- Table 41: Japan Multi Touch Attribution Industry Revenue (Million) Forecast, by Application 2019 & 2032
- Table 42: Japan Multi Touch Attribution Industry Volume (K Unit) Forecast, by Application 2019 & 2032
- Table 43: India Multi Touch Attribution Industry Revenue (Million) Forecast, by Application 2019 & 2032
- Table 44: India Multi Touch Attribution Industry Volume (K Unit) Forecast, by Application 2019 & 2032
- Table 45: South Korea Multi Touch Attribution Industry Revenue (Million) Forecast, by Application 2019 & 2032
- Table 46: South Korea Multi Touch Attribution Industry Volume (K Unit) Forecast, by Application 2019 & 2032
- Table 47: Southeast Asia Multi Touch Attribution Industry Revenue (Million) Forecast, by Application 2019 & 2032
- Table 48: Southeast Asia Multi Touch Attribution Industry Volume (K Unit) Forecast, by Application 2019 & 2032
- Table 49: Australia Multi Touch Attribution Industry Revenue (Million) Forecast, by Application 2019 & 2032
- Table 50: Australia Multi Touch Attribution Industry Volume (K Unit) Forecast, by Application 2019 & 2032
- Table 51: Indonesia Multi Touch Attribution Industry Revenue (Million) Forecast, by Application 2019 & 2032
- Table 52: Indonesia Multi Touch Attribution Industry Volume (K Unit) Forecast, by Application 2019 & 2032
- Table 53: Phillipes Multi Touch Attribution Industry Revenue (Million) Forecast, by Application 2019 & 2032
- Table 54: Phillipes Multi Touch Attribution Industry Volume (K Unit) Forecast, by Application 2019 & 2032
- Table 55: Singapore Multi Touch Attribution Industry Revenue (Million) Forecast, by Application 2019 & 2032
- Table 56: Singapore Multi Touch Attribution Industry Volume (K Unit) Forecast, by Application 2019 & 2032
- Table 57: Thailandc Multi Touch Attribution Industry Revenue (Million) Forecast, by Application 2019 & 2032
- Table 58: Thailandc Multi Touch Attribution Industry Volume (K Unit) Forecast, by Application 2019 & 2032
- Table 59: Rest of Asia Pacific Multi Touch Attribution Industry Revenue (Million) Forecast, by Application 2019 & 2032
- Table 60: Rest of Asia Pacific Multi Touch Attribution Industry Volume (K Unit) Forecast, by Application 2019 & 2032
- Table 61: Global Multi Touch Attribution Industry Revenue Million Forecast, by Country 2019 & 2032
- Table 62: Global Multi Touch Attribution Industry Volume K Unit Forecast, by Country 2019 & 2032
- Table 63: Brazil Multi Touch Attribution Industry Revenue (Million) Forecast, by Application 2019 & 2032
- Table 64: Brazil Multi Touch Attribution Industry Volume (K Unit) Forecast, by Application 2019 & 2032
- Table 65: Argentina Multi Touch Attribution Industry Revenue (Million) Forecast, by Application 2019 & 2032
- Table 66: Argentina Multi Touch Attribution Industry Volume (K Unit) Forecast, by Application 2019 & 2032
- Table 67: Peru Multi Touch Attribution Industry Revenue (Million) Forecast, by Application 2019 & 2032
- Table 68: Peru Multi Touch Attribution Industry Volume (K Unit) Forecast, by Application 2019 & 2032
- Table 69: Chile Multi Touch Attribution Industry Revenue (Million) Forecast, by Application 2019 & 2032
- Table 70: Chile Multi Touch Attribution Industry Volume (K Unit) Forecast, by Application 2019 & 2032
- Table 71: Colombia Multi Touch Attribution Industry Revenue (Million) Forecast, by Application 2019 & 2032
- Table 72: Colombia Multi Touch Attribution Industry Volume (K Unit) Forecast, by Application 2019 & 2032
- Table 73: Ecuador Multi Touch Attribution Industry Revenue (Million) Forecast, by Application 2019 & 2032
- Table 74: Ecuador Multi Touch Attribution Industry Volume (K Unit) Forecast, by Application 2019 & 2032
- Table 75: Venezuela Multi Touch Attribution Industry Revenue (Million) Forecast, by Application 2019 & 2032
- Table 76: Venezuela Multi Touch Attribution Industry Volume (K Unit) Forecast, by Application 2019 & 2032
- Table 77: Rest of South America Multi Touch Attribution Industry Revenue (Million) Forecast, by Application 2019 & 2032
- Table 78: Rest of South America Multi Touch Attribution Industry Volume (K Unit) Forecast, by Application 2019 & 2032
- Table 79: Global Multi Touch Attribution Industry Revenue Million Forecast, by Country 2019 & 2032
- Table 80: Global Multi Touch Attribution Industry Volume K Unit Forecast, by Country 2019 & 2032
- Table 81: United States Multi Touch Attribution Industry Revenue (Million) Forecast, by Application 2019 & 2032
- Table 82: United States Multi Touch Attribution Industry Volume (K Unit) Forecast, by Application 2019 & 2032
- Table 83: Canada Multi Touch Attribution Industry Revenue (Million) Forecast, by Application 2019 & 2032
- Table 84: Canada Multi Touch Attribution Industry Volume (K Unit) Forecast, by Application 2019 & 2032
- Table 85: Mexico Multi Touch Attribution Industry Revenue (Million) Forecast, by Application 2019 & 2032
- Table 86: Mexico Multi Touch Attribution Industry Volume (K Unit) Forecast, by Application 2019 & 2032
- Table 87: Global Multi Touch Attribution Industry Revenue Million Forecast, by Country 2019 & 2032
- Table 88: Global Multi Touch Attribution Industry Volume K Unit Forecast, by Country 2019 & 2032
- Table 89: United Arab Emirates Multi Touch Attribution Industry Revenue (Million) Forecast, by Application 2019 & 2032
- Table 90: United Arab Emirates Multi Touch Attribution Industry Volume (K Unit) Forecast, by Application 2019 & 2032
- Table 91: Saudi Arabia Multi Touch Attribution Industry Revenue (Million) Forecast, by Application 2019 & 2032
- Table 92: Saudi Arabia Multi Touch Attribution Industry Volume (K Unit) Forecast, by Application 2019 & 2032
- Table 93: South Africa Multi Touch Attribution Industry Revenue (Million) Forecast, by Application 2019 & 2032
- Table 94: South Africa Multi Touch Attribution Industry Volume (K Unit) Forecast, by Application 2019 & 2032
- Table 95: Rest of Middle East and Africa Multi Touch Attribution Industry Revenue (Million) Forecast, by Application 2019 & 2032
- Table 96: Rest of Middle East and Africa Multi Touch Attribution Industry Volume (K Unit) Forecast, by Application 2019 & 2032
- Table 97: Global Multi Touch Attribution Industry Revenue Million Forecast, by End-user Industry 2019 & 2032
- Table 98: Global Multi Touch Attribution Industry Volume K Unit Forecast, by End-user Industry 2019 & 2032
- Table 99: Global Multi Touch Attribution Industry Revenue Million Forecast, by Country 2019 & 2032
- Table 100: Global Multi Touch Attribution Industry Volume K Unit Forecast, by Country 2019 & 2032
- Table 101: Global Multi Touch Attribution Industry Revenue Million Forecast, by End-user Industry 2019 & 2032
- Table 102: Global Multi Touch Attribution Industry Volume K Unit Forecast, by End-user Industry 2019 & 2032
- Table 103: Global Multi Touch Attribution Industry Revenue Million Forecast, by Country 2019 & 2032
- Table 104: Global Multi Touch Attribution Industry Volume K Unit Forecast, by Country 2019 & 2032
- Table 105: Global Multi Touch Attribution Industry Revenue Million Forecast, by End-user Industry 2019 & 2032
- Table 106: Global Multi Touch Attribution Industry Volume K Unit Forecast, by End-user Industry 2019 & 2032
- Table 107: Global Multi Touch Attribution Industry Revenue Million Forecast, by Country 2019 & 2032
- Table 108: Global Multi Touch Attribution Industry Volume K Unit Forecast, by Country 2019 & 2032
- Table 109: Global Multi Touch Attribution Industry Revenue Million Forecast, by End-user Industry 2019 & 2032
- Table 110: Global Multi Touch Attribution Industry Volume K Unit Forecast, by End-user Industry 2019 & 2032
- Table 111: Global Multi Touch Attribution Industry Revenue Million Forecast, by Country 2019 & 2032
- Table 112: Global Multi Touch Attribution Industry Volume K Unit Forecast, by Country 2019 & 2032
- Table 113: Global Multi Touch Attribution Industry Revenue Million Forecast, by End-user Industry 2019 & 2032
- Table 114: Global Multi Touch Attribution Industry Volume K Unit Forecast, by End-user Industry 2019 & 2032
- Table 115: Global Multi Touch Attribution Industry Revenue Million Forecast, by Country 2019 & 2032
- Table 116: Global Multi Touch Attribution Industry Volume K Unit Forecast, by Country 2019 & 2032
Frequently Asked Questions
1. What is the projected Compound Annual Growth Rate (CAGR) of the Multi Touch Attribution Industry?
The projected CAGR is approximately 13.64%.
2. Which companies are prominent players in the Multi Touch Attribution Industry?
Key companies in the market include The Nielsen Company, Conversion Logic Inc, Adobe Inc, Merkle Inc, Neustar Inc, Engagio Inc, Ipsos Group SA, Equifax Inc, AppsFlyer, LeadsRx Inc, LeanData Inc, Manthan.
3. What are the main segments of the Multi Touch Attribution Industry?
The market segments include End-user Industry.
4. Can you provide details about the market size?
The market size is estimated to be USD 2.14 Million as of 2022.
5. What are some drivers contributing to market growth?
Increasing Focus of Marketers on Maximizing the ROI; Growing Number of Marketing Channels and Need for Optimization of Marketing Expenditure; Adoption of Technology and Solutions such as AI. Big Data. and Cloud Computing in Marketing.
6. What are the notable trends driving market growth?
Retail & E-commerce Industry Expected to Show Maximum Growth.
7. Are there any restraints impacting market growth?
Skepticism About Shifting from Existing Marketing Practices. Training and Change Management.
8. Can you provide examples of recent developments in the market?
May 2022: Clinch and Neustar collaborated to give marketers a more comprehensive picture of attribution throughout their full campaign footprint. Neustar's Marketing Attribution solution can now be engaged within the Clinch UI, providing advertisers with extensive real-time insights into the channels, tactics, creatives, and other aspects of campaign performance.
9. What pricing options are available for accessing the report?
Pricing options include single-user, multi-user, and enterprise licenses priced at USD 4750, USD 5250, and USD 8750 respectively.
10. Is the market size provided in terms of value or volume?
The market size is provided in terms of value, measured in Million and volume, measured in K Unit.
11. Are there any specific market keywords associated with the report?
Yes, the market keyword associated with the report is "Multi Touch Attribution Industry," which aids in identifying and referencing the specific market segment covered.
12. How do I determine which pricing option suits my needs best?
The pricing options vary based on user requirements and access needs. Individual users may opt for single-user licenses, while businesses requiring broader access may choose multi-user or enterprise licenses for cost-effective access to the report.
13. Are there any additional resources or data provided in the Multi Touch Attribution Industry report?
While the report offers comprehensive insights, it's advisable to review the specific contents or supplementary materials provided to ascertain if additional resources or data are available.
14. How can I stay updated on further developments or reports in the Multi Touch Attribution Industry?
To stay informed about further developments, trends, and reports in the Multi Touch Attribution Industry, consider subscribing to industry newsletters, following relevant companies and organizations, or regularly checking reputable industry news sources and publications.
Methodology
Step 1 - Identification of Relevant Samples Size from Population Database


Step 2 - Approaches for Defining Global Market Size (Value, Volume* & Price*)

Note*: In applicable scenarios
Step 3 - Data Sources
Primary Research
- Web Analytics
- Survey Reports
- Research Institute
- Latest Research Reports
- Opinion Leaders
Secondary Research
- Annual Reports
- White Paper
- Latest Press Release
- Industry Association
- Paid Database
- Investor Presentations

Step 4 - Data Triangulation
Involves using different sources of information in order to increase the validity of a study
These sources are likely to be stakeholders in a program - participants, other researchers, program staff, other community members, and so on.
Then we put all data in single framework & apply various statistical tools to find out the dynamic on the market.
During the analysis stage, feedback from the stakeholder groups would be compared to determine areas of agreement as well as areas of divergence
