

Key Insights
The MRO (Maintenance, Repair, and Operations) distribution market within the food industry is poised for steady expansion, with a projected market size of $641.87 billion in 2023 and an anticipated Compound Annual Growth Rate (CAGR) of 2.5% during the study period. This growth is underpinned by the critical need for uninterrupted food production, stringent food safety regulations, and the increasing sophistication of food processing machinery. Key drivers include the constant demand for high-quality and safe food products, which necessitates robust maintenance programs to prevent equipment failures and product contamination. Furthermore, the expanding global food processing sector, driven by population growth and changing dietary preferences, directly fuels the demand for MRO services and supplies. Preventive and scheduled maintenance strategies are becoming increasingly prominent as food manufacturers seek to optimize operational efficiency, minimize downtime, and extend the lifespan of their valuable assets. This proactive approach not only reduces the risk of costly breakdowns but also ensures compliance with evolving industry standards.
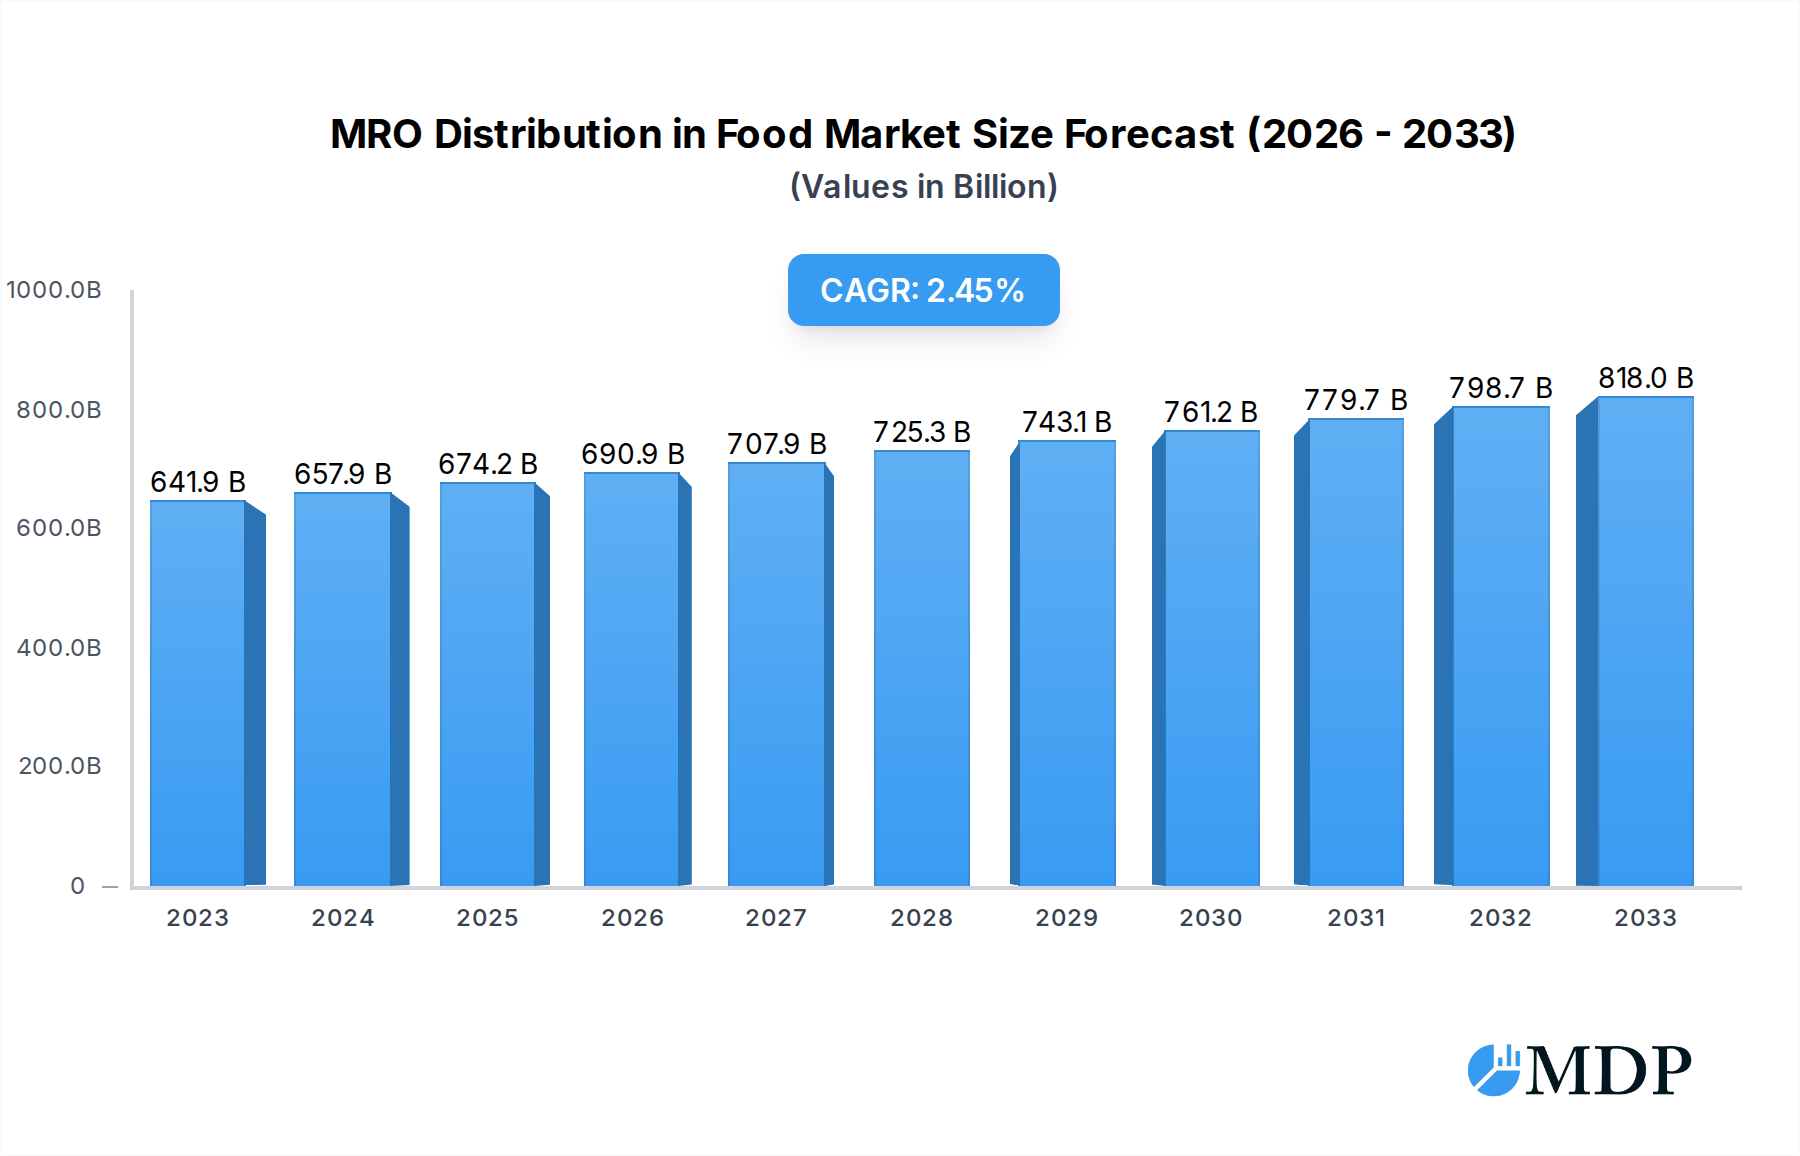
MRO Distribution in Food Market Size (In Billion)
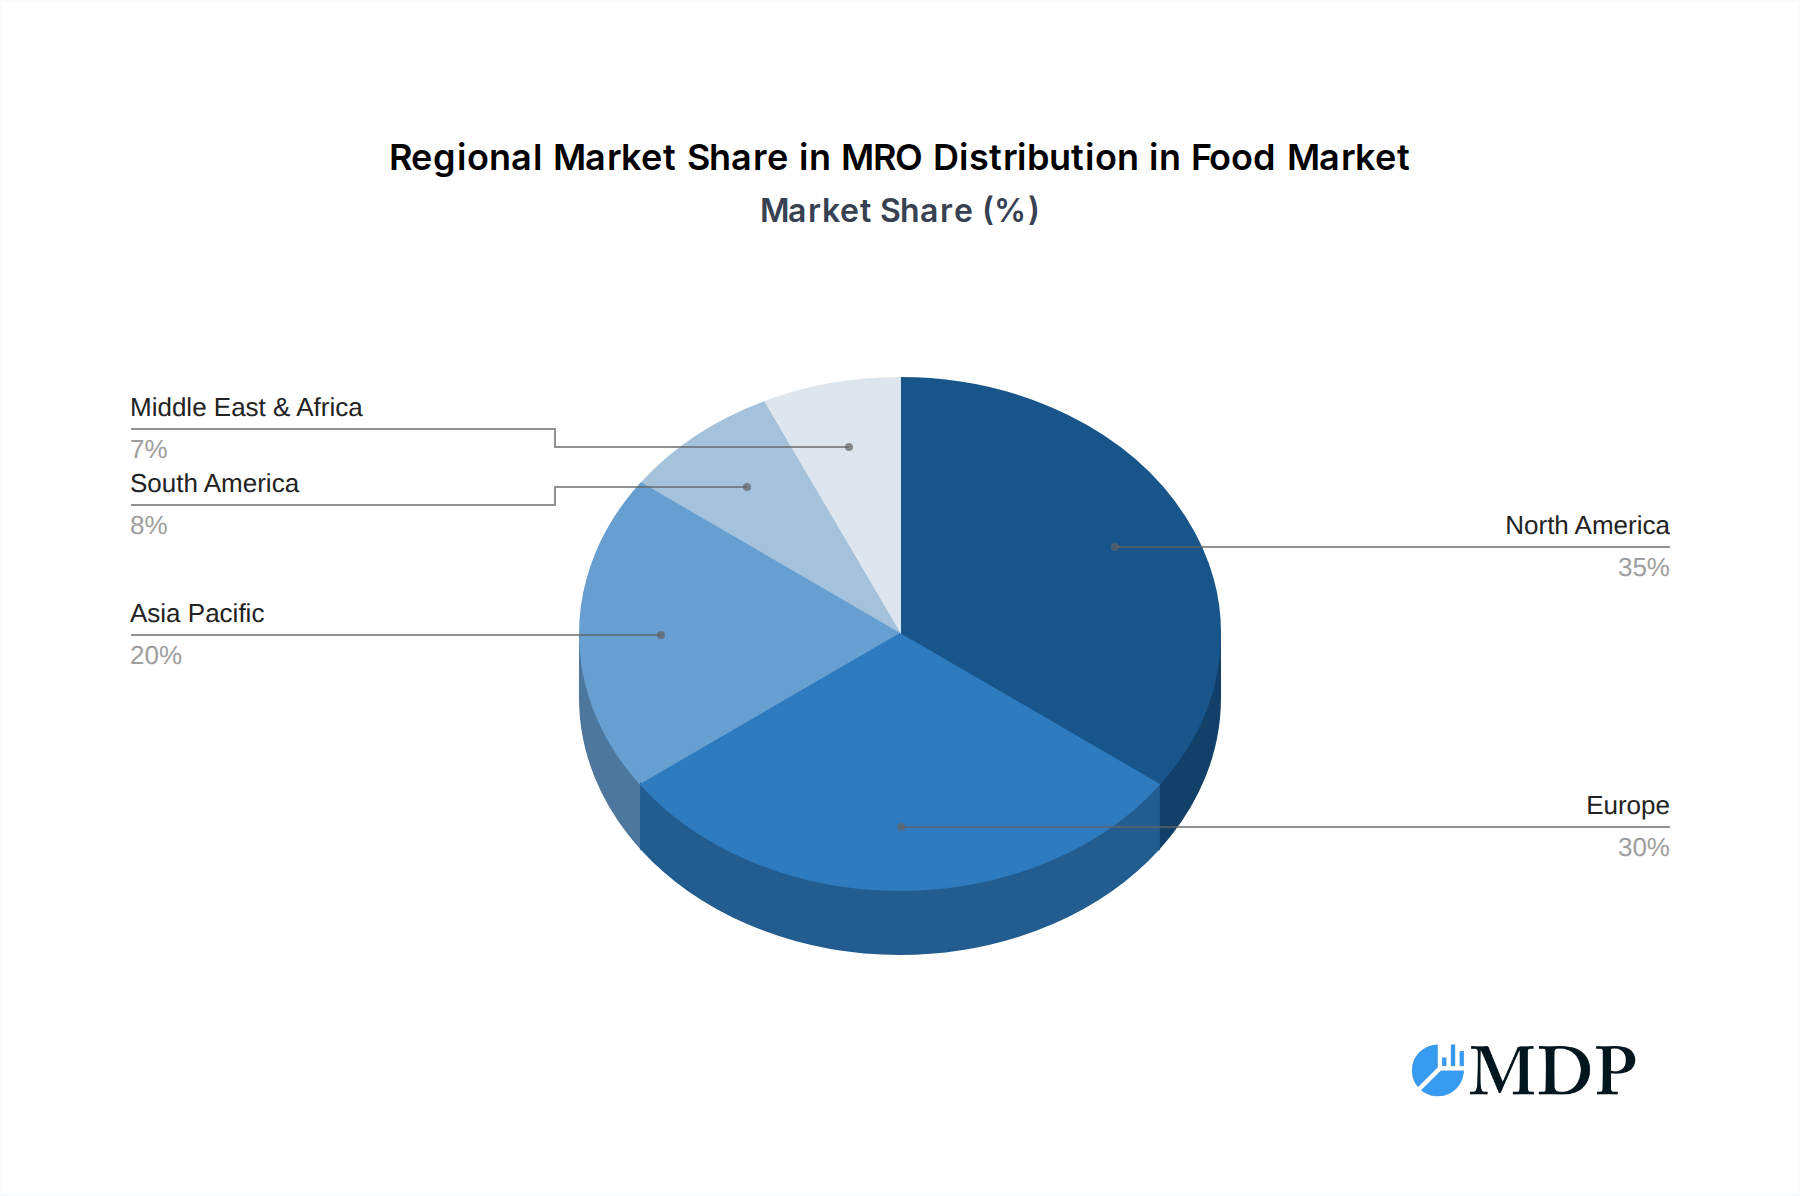
The market's trajectory is further shaped by prevailing trends such as the adoption of digital technologies for predictive maintenance, the growing emphasis on sustainable MRO practices, and the consolidation of distribution channels. While the market offers substantial opportunities, certain restraints, such as the high initial investment for advanced MRO technologies and potential supply chain disruptions, could pose challenges. The market is segmented into internal and external MRO distribution, with preventive/scheduled maintenance holding a significant share over corrective maintenance due to the emphasis on operational continuity. Geographically, North America and Europe are expected to remain dominant regions, owing to their mature food processing infrastructure and stringent regulatory frameworks. However, the Asia Pacific region, with its rapidly growing food industry, presents significant untapped potential for MRO distribution players.

MRO Distribution in Food Company Market Share
Unlock unparalleled insights into the global MRO distribution landscape for the food industry. This in-depth report, spanning from 2019 to 2033, with a base year of 2025 and a forecast period of 2025–2033, provides a critical analysis of market dynamics, trends, and future opportunities. Essential for food manufacturers, MRO suppliers, logistics providers, and investors, this report offers actionable intelligence to navigate the evolving MRO distribution in food sector. Explore market concentration, innovation drivers, regulatory frameworks, product substitutes, end-user trends, and M&A activities, alongside detailed segment analysis, leading market intelligence, product developments, growth drivers, challenges, and emerging opportunities.
MRO Distribution in Food Market Dynamics & Concentration
The MRO distribution in food market exhibits a moderate concentration, with a few key players holding significant market share, estimated at approximately 35% in the base year of 2025. Innovation drivers are primarily focused on enhancing supply chain efficiency, ensuring regulatory compliance, and reducing operational downtime in food processing facilities. Regulatory frameworks, particularly those pertaining to food safety and hygiene standards, significantly influence product selection and distribution strategies. Product substitutes, while present in some commodity MRO categories, are less prevalent in specialized equipment and critical spare parts where performance and reliability are paramount. End-user trends show a growing demand for integrated MRO solutions, including predictive maintenance services and digital inventory management, driven by the need to optimize operational costs and maintain continuous production. Mergers and acquisitions (M&A) activities, with an estimated 15 significant deals in the historical period (2019-2024), indicate consolidation efforts by larger entities to expand their service offerings and geographical reach. The projected M&A deal count for the forecast period (2025-2033) is expected to be around 25, reflecting ongoing industry maturation.
MRO Distribution in Food Industry Trends & Analysis
The MRO distribution in food industry is poised for robust growth, driven by several interconnected trends. A primary growth driver is the increasing demand for processed and packaged foods globally, necessitating greater investment in sophisticated food processing machinery and robust maintenance practices to ensure uninterrupted operations. The Compound Annual Growth Rate (CAGR) for this sector is projected to be a healthy 6.8% from 2025 to 2033. Technological disruptions are reshaping the landscape, with the integration of the Internet of Things (IoT) for predictive maintenance, artificial intelligence (AI) for inventory optimization, and advanced analytics for demand forecasting. This leads to a significant increase in the adoption of smart MRO solutions, contributing to higher market penetration of specialized services. Consumer preferences for food safety, traceability, and sustainability are indirectly influencing MRO distribution by demanding higher quality and compliant components, as well as more efficient and environmentally friendly logistics. Competitive dynamics are characterized by a blend of large, diversified MRO providers and niche specialists focusing on specific food industry segments. The strategic importance of efficient MRO is amplified by the high cost of production downtime in food manufacturing, where even brief interruptions can lead to substantial financial losses and reputational damage. Furthermore, the increasing complexity of food production lines requires specialized MRO expertise and a reliable supply of critical parts, reinforcing the value proposition of dedicated MRO distributors. The drive for operational excellence and cost optimization within the food sector directly translates into increased spending on MRO, making it a critical component of the overall food manufacturing ecosystem.
Leading Markets & Segments in MRO Distribution in Food
The Internal application segment is demonstrating significant dominance within the MRO distribution in food market, projected to account for approximately 65% of the market share by 2025. This dominance is driven by the critical need to maintain the operational integrity and efficiency of in-house food processing machinery, including conveyors, packaging equipment, and refrigeration systems. Economic policies supporting domestic manufacturing and stringent food safety regulations within major food-producing nations contribute to sustained investment in internal MRO.
- Key Drivers for Internal Application Dominance:
- High Operational Dependency: Food processing lines rely heavily on internal machinery functioning continuously to meet production targets.
- Food Safety Compliance: Maintaining hygiene and preventing contamination within processing facilities necessitates regular and thorough maintenance of internal equipment.
- Reduced Downtime Costs: Proactive maintenance of internal assets significantly minimizes costly production stoppages.
- Technological Advancements in Automation: The increasing automation of food production requires specialized MRO for complex internal systems.
The Preventive/Scheduled Maintenance type segment is another leading contributor, representing an estimated 70% of the MRO distribution in food market in 2025. This preference for scheduled maintenance over corrective measures is a direct result of the high stakes involved in food production, where unplanned breakdowns can lead to product spoilage, recall, and severe reputational damage. Economic policies emphasizing risk mitigation and the long-term cost-effectiveness of preventative care are key influencers.
- Key Drivers for Preventive/Scheduled Maintenance Dominance:
- Minimizing Production Interruptions: Scheduled maintenance prevents unexpected failures that can halt operations and lead to significant losses.
- Extending Equipment Lifespan: Regular servicing ensures machinery functions optimally for longer periods, reducing capital expenditure on replacements.
- Ensuring Food Safety and Quality: Proactive maintenance guarantees that equipment operates within specified parameters, upholding product integrity.
- Cost Predictability: Scheduled maintenance allows for better budgeting and resource allocation compared to the unpredictable costs of emergency repairs.
MRO Distribution in Food Product Developments
Product developments in MRO distribution for the food industry are increasingly focused on enhancing reliability, safety, and efficiency. Innovations include smart sensors for real-time equipment monitoring, predictive maintenance software powered by AI, and the development of food-grade lubricants and cleaning agents that meet stringent regulatory requirements. Competitive advantages are being derived from distributors offering integrated MRO solutions, including inventory management, on-site technical support, and customized maintenance plans. Technological trends are pushing towards digitalization, with a growing emphasis on digital twins of machinery for simulation and predictive analysis.
Key Drivers of MRO Distribution in Food Growth
The growth of the MRO distribution in food market is propelled by several key factors. Technologically, the widespread adoption of Industry 4.0 principles, including IoT sensors and AI-driven analytics for predictive maintenance, is enhancing operational efficiency and reducing downtime. Economically, the increasing global demand for processed foods fuels investments in advanced manufacturing capabilities and, consequently, MRO services. Regulatory frameworks, particularly stringent food safety and hygiene standards worldwide, necessitate continuous investment in well-maintained equipment and the use of compliant MRO supplies. For instance, evolving HACCP regulations directly impact the types of MRO products and services required by food manufacturers.
Challenges in the MRO Distribution in Food Market
Significant challenges persist within the MRO distribution in food market. Regulatory hurdles, while driving demand, also impose complex compliance requirements for MRO products and their sourcing, adding to operational costs. Supply chain disruptions, as witnessed in recent years, can lead to stockouts of critical spare parts and extended lead times, impacting production schedules. Competitive pressures from both established MRO providers and in-house maintenance teams can also limit market penetration and influence pricing strategies. The cost of implementing advanced MRO technologies, such as AI-powered predictive maintenance platforms, can also be a barrier for smaller food manufacturers.
Emerging Opportunities in MRO Distribution in Food
Catalysts driving long-term growth in the MRO distribution in food market are abundant. Technological breakthroughs in areas like robotics for automated maintenance and advanced material science for longer-lasting components present significant opportunities. Strategic partnerships between MRO distributors and food equipment manufacturers can lead to integrated service offerings and optimized spare parts management. Furthermore, market expansion into emerging economies with growing food processing sectors and the increasing focus on sustainable MRO practices, such as remanufacturing and recycling of parts, will fuel future growth. The development of digital marketplaces for MRO procurement is also an emerging opportunity for increased efficiency and accessibility.
Leading Players in the MRO Distribution in Food Sector
- Cromwell Group (Holdings) Limited (Grainger)
- Graco Inc.
- WABCO (ZF)
- Mento AS
- Valeo Service UK Ltd
- Ascendum
- Bodo Möller Chemie GmbH
- Lindberg & Lund AS (Biesterfeld)
- Neumo-Egmo Spain SL
- Gazechim Composites Norden AB
- ABB Group
- Rohde & Schwarz
- Schneider Electric
Key Milestones in MRO Distribution in Food Industry
- 2019: Increased adoption of IoT for remote equipment monitoring in large-scale food processing plants.
- 2020: Heightened focus on supply chain resilience due to global events, leading to greater inventory diversification for MRO.
- 2021: Introduction of AI-powered predictive maintenance solutions gaining traction for critical food processing machinery.
- 2022: Expansion of digital MRO procurement platforms, simplifying ordering and inventory management.
- 2023: Growing demand for sustainable MRO solutions and environmentally friendly product alternatives.
- 2024: Increased M&A activity as larger players consolidate their market positions and expand service portfolios.
Strategic Outlook for MRO Distribution in Food Market
The strategic outlook for the MRO distribution in food market is characterized by continued innovation and integration. Growth accelerators include the deeper penetration of digital technologies like AI and IoT for predictive and prescriptive maintenance, alongside a stronger emphasis on customized MRO solutions tailored to specific food production processes. Companies that can offer end-to-end MRO services, encompassing parts, labor, and advanced diagnostics, will gain a significant competitive edge. The future market potential lies in becoming indispensable partners in ensuring food safety, operational efficiency, and supply chain robustness for food manufacturers worldwide.
MRO Distribution in Food Segmentation
-
1. Application
- 1.1. Internal
- 1.2. External
-
2. Types
- 2.1. Preventive/Scheduled Maintenance
- 2.2. Corrective Maintenance
MRO Distribution in Food Segmentation By Geography
-
1. North America
- 1.1. United States
- 1.2. Canada
- 1.3. Mexico
-
2. South America
- 2.1. Brazil
- 2.2. Argentina
- 2.3. Rest of South America
-
3. Europe
- 3.1. United Kingdom
- 3.2. Germany
- 3.3. France
- 3.4. Italy
- 3.5. Spain
- 3.6. Russia
- 3.7. Benelux
- 3.8. Nordics
- 3.9. Rest of Europe
-
4. Middle East & Africa
- 4.1. Turkey
- 4.2. Israel
- 4.3. GCC
- 4.4. North Africa
- 4.5. South Africa
- 4.6. Rest of Middle East & Africa
-
5. Asia Pacific
- 5.1. China
- 5.2. India
- 5.3. Japan
- 5.4. South Korea
- 5.5. ASEAN
- 5.6. Oceania
- 5.7. Rest of Asia Pacific
MRO Distribution in Food Regional Market Share
Geographic Coverage of MRO Distribution in Food
MRO Distribution in Food REPORT HIGHLIGHTS
| Aspects | Details |
|---|---|
| Study Period | 2020-2034 |
| Base Year | 2025 |
| Estimated Year | 2026 |
| Forecast Period | 2026-2034 |
| Historical Period | 2020-2025 |
| Growth Rate | CAGR of 2.6% from 2020-2034 |
| Segmentation |
|
Table of Contents
- 1. Introduction
- 1.1. Research Scope
- 1.2. Market Segmentation
- 1.3. Research Objective
- 1.4. Definitions and Assumptions
- 2. Executive Summary
- 2.1. Market Snapshot
- 3. Market Dynamics
- 3.1. Market Drivers
- 3.2. Market Restrains
- 3.3. Market Trends
- 3.4. Market Opportunities
- 4. Market Factor Analysis
- 4.1. Porters Five Forces
- 4.1.1. Bargaining Power of Suppliers
- 4.1.2. Bargaining Power of Buyers
- 4.1.3. Threat of New Entrants
- 4.1.4. Threat of Substitutes
- 4.1.5. Competitive Rivalry
- 4.2. PESTEL analysis
- 4.3. BCG Analysis
- 4.3.1. Stars (High Growth, High Market Share)
- 4.3.2. Cash Cows (Low Growth, High Market Share)
- 4.3.3. Question Mark (High Growth, Low Market Share)
- 4.3.4. Dogs (Low Growth, Low Market Share)
- 4.4. Ansoff Matrix Analysis
- 4.5. Supply Chain Analysis
- 4.6. Regulatory Landscape
- 4.7. Current Market Potential and Opportunity Assessment (TAM–SAM–SOM Framework)
- 4.8. MDP Analyst Note
- 4.1. Porters Five Forces
- 5. Market Analysis, Insights and Forecast 2021-2033
- 5.1. Market Analysis, Insights and Forecast - by Application
- 5.1.1. Internal
- 5.1.2. External
- 5.2. Market Analysis, Insights and Forecast - by Types
- 5.2.1. Preventive/Scheduled Maintenance
- 5.2.2. Corrective Maintenance
- 5.3. Market Analysis, Insights and Forecast - by Region
- 5.3.1. North America
- 5.3.2. South America
- 5.3.3. Europe
- 5.3.4. Middle East & Africa
- 5.3.5. Asia Pacific
- 5.1. Market Analysis, Insights and Forecast - by Application
- 6. Global MRO Distribution in Food Analysis, Insights and Forecast, 2021-2033
- 6.1. Market Analysis, Insights and Forecast - by Application
- 6.1.1. Internal
- 6.1.2. External
- 6.2. Market Analysis, Insights and Forecast - by Types
- 6.2.1. Preventive/Scheduled Maintenance
- 6.2.2. Corrective Maintenance
- 6.1. Market Analysis, Insights and Forecast - by Application
- 7. North America MRO Distribution in Food Analysis, Insights and Forecast, 2020-2032
- 7.1. Market Analysis, Insights and Forecast - by Application
- 7.1.1. Internal
- 7.1.2. External
- 7.2. Market Analysis, Insights and Forecast - by Types
- 7.2.1. Preventive/Scheduled Maintenance
- 7.2.2. Corrective Maintenance
- 7.1. Market Analysis, Insights and Forecast - by Application
- 8. South America MRO Distribution in Food Analysis, Insights and Forecast, 2020-2032
- 8.1. Market Analysis, Insights and Forecast - by Application
- 8.1.1. Internal
- 8.1.2. External
- 8.2. Market Analysis, Insights and Forecast - by Types
- 8.2.1. Preventive/Scheduled Maintenance
- 8.2.2. Corrective Maintenance
- 8.1. Market Analysis, Insights and Forecast - by Application
- 9. Europe MRO Distribution in Food Analysis, Insights and Forecast, 2020-2032
- 9.1. Market Analysis, Insights and Forecast - by Application
- 9.1.1. Internal
- 9.1.2. External
- 9.2. Market Analysis, Insights and Forecast - by Types
- 9.2.1. Preventive/Scheduled Maintenance
- 9.2.2. Corrective Maintenance
- 9.1. Market Analysis, Insights and Forecast - by Application
- 10. Middle East & Africa MRO Distribution in Food Analysis, Insights and Forecast, 2020-2032
- 10.1. Market Analysis, Insights and Forecast - by Application
- 10.1.1. Internal
- 10.1.2. External
- 10.2. Market Analysis, Insights and Forecast - by Types
- 10.2.1. Preventive/Scheduled Maintenance
- 10.2.2. Corrective Maintenance
- 10.1. Market Analysis, Insights and Forecast - by Application
- 11. Asia Pacific MRO Distribution in Food Analysis, Insights and Forecast, 2020-2032
- 11.1. Market Analysis, Insights and Forecast - by Application
- 11.1.1. Internal
- 11.1.2. External
- 11.2. Market Analysis, Insights and Forecast - by Types
- 11.2.1. Preventive/Scheduled Maintenance
- 11.2.2. Corrective Maintenance
- 11.1. Market Analysis, Insights and Forecast - by Application
- 12. Competitive Analysis
- 12.1. Company Profiles
- 12.1.1 Cromwell Group (Holdings) Limited (Grainger)
- 12.1.1.1. Company Overview
- 12.1.1.2. Products
- 12.1.1.3. Company Financials
- 12.1.1.4. SWOT Analysis
- 12.1.2 Graco Inc.
- 12.1.2.1. Company Overview
- 12.1.2.2. Products
- 12.1.2.3. Company Financials
- 12.1.2.4. SWOT Analysis
- 12.1.3 WABCO (ZF)
- 12.1.3.1. Company Overview
- 12.1.3.2. Products
- 12.1.3.3. Company Financials
- 12.1.3.4. SWOT Analysis
- 12.1.4 Mento AS
- 12.1.4.1. Company Overview
- 12.1.4.2. Products
- 12.1.4.3. Company Financials
- 12.1.4.4. SWOT Analysis
- 12.1.5 Valeo Service UK Ltd
- 12.1.5.1. Company Overview
- 12.1.5.2. Products
- 12.1.5.3. Company Financials
- 12.1.5.4. SWOT Analysis
- 12.1.6 Ascendum
- 12.1.6.1. Company Overview
- 12.1.6.2. Products
- 12.1.6.3. Company Financials
- 12.1.6.4. SWOT Analysis
- 12.1.7 Bodo Möller Chemie GmbH
- 12.1.7.1. Company Overview
- 12.1.7.2. Products
- 12.1.7.3. Company Financials
- 12.1.7.4. SWOT Analysis
- 12.1.8 Lindberg & Lund AS (Biesterfeld)
- 12.1.8.1. Company Overview
- 12.1.8.2. Products
- 12.1.8.3. Company Financials
- 12.1.8.4. SWOT Analysis
- 12.1.9 Neumo-Egmo Spain SL
- 12.1.9.1. Company Overview
- 12.1.9.2. Products
- 12.1.9.3. Company Financials
- 12.1.9.4. SWOT Analysis
- 12.1.10 Gazechim Composites Norden AB
- 12.1.10.1. Company Overview
- 12.1.10.2. Products
- 12.1.10.3. Company Financials
- 12.1.10.4. SWOT Analysis
- 12.1.11 ABB Group
- 12.1.11.1. Company Overview
- 12.1.11.2. Products
- 12.1.11.3. Company Financials
- 12.1.11.4. SWOT Analysis
- 12.1.12 Rohde & Schwarz
- 12.1.12.1. Company Overview
- 12.1.12.2. Products
- 12.1.12.3. Company Financials
- 12.1.12.4. SWOT Analysis
- 12.1.13 Schneider Electric
- 12.1.13.1. Company Overview
- 12.1.13.2. Products
- 12.1.13.3. Company Financials
- 12.1.13.4. SWOT Analysis
- 12.1.1 Cromwell Group (Holdings) Limited (Grainger)
- 12.2. Market Entropy
- 12.2.1 Company's Key Areas Served
- 12.2.2 Recent Developments
- 12.3. Company Market Share Analysis 2025
- 12.3.1 Top 5 Companies Market Share Analysis
- 12.3.2 Top 3 Companies Market Share Analysis
- 12.4. List of Potential Customers
- 13. Research Methodology
List of Figures
- Figure 1: Global MRO Distribution in Food Revenue Breakdown (billion, %) by Region 2025 & 2033
- Figure 2: North America MRO Distribution in Food Revenue (billion), by Application 2025 & 2033
- Figure 3: North America MRO Distribution in Food Revenue Share (%), by Application 2025 & 2033
- Figure 4: North America MRO Distribution in Food Revenue (billion), by Types 2025 & 2033
- Figure 5: North America MRO Distribution in Food Revenue Share (%), by Types 2025 & 2033
- Figure 6: North America MRO Distribution in Food Revenue (billion), by Country 2025 & 2033
- Figure 7: North America MRO Distribution in Food Revenue Share (%), by Country 2025 & 2033
- Figure 8: South America MRO Distribution in Food Revenue (billion), by Application 2025 & 2033
- Figure 9: South America MRO Distribution in Food Revenue Share (%), by Application 2025 & 2033
- Figure 10: South America MRO Distribution in Food Revenue (billion), by Types 2025 & 2033
- Figure 11: South America MRO Distribution in Food Revenue Share (%), by Types 2025 & 2033
- Figure 12: South America MRO Distribution in Food Revenue (billion), by Country 2025 & 2033
- Figure 13: South America MRO Distribution in Food Revenue Share (%), by Country 2025 & 2033
- Figure 14: Europe MRO Distribution in Food Revenue (billion), by Application 2025 & 2033
- Figure 15: Europe MRO Distribution in Food Revenue Share (%), by Application 2025 & 2033
- Figure 16: Europe MRO Distribution in Food Revenue (billion), by Types 2025 & 2033
- Figure 17: Europe MRO Distribution in Food Revenue Share (%), by Types 2025 & 2033
- Figure 18: Europe MRO Distribution in Food Revenue (billion), by Country 2025 & 2033
- Figure 19: Europe MRO Distribution in Food Revenue Share (%), by Country 2025 & 2033
- Figure 20: Middle East & Africa MRO Distribution in Food Revenue (billion), by Application 2025 & 2033
- Figure 21: Middle East & Africa MRO Distribution in Food Revenue Share (%), by Application 2025 & 2033
- Figure 22: Middle East & Africa MRO Distribution in Food Revenue (billion), by Types 2025 & 2033
- Figure 23: Middle East & Africa MRO Distribution in Food Revenue Share (%), by Types 2025 & 2033
- Figure 24: Middle East & Africa MRO Distribution in Food Revenue (billion), by Country 2025 & 2033
- Figure 25: Middle East & Africa MRO Distribution in Food Revenue Share (%), by Country 2025 & 2033
- Figure 26: Asia Pacific MRO Distribution in Food Revenue (billion), by Application 2025 & 2033
- Figure 27: Asia Pacific MRO Distribution in Food Revenue Share (%), by Application 2025 & 2033
- Figure 28: Asia Pacific MRO Distribution in Food Revenue (billion), by Types 2025 & 2033
- Figure 29: Asia Pacific MRO Distribution in Food Revenue Share (%), by Types 2025 & 2033
- Figure 30: Asia Pacific MRO Distribution in Food Revenue (billion), by Country 2025 & 2033
- Figure 31: Asia Pacific MRO Distribution in Food Revenue Share (%), by Country 2025 & 2033
List of Tables
- Table 1: Global MRO Distribution in Food Revenue billion Forecast, by Application 2020 & 2033
- Table 2: Global MRO Distribution in Food Revenue billion Forecast, by Types 2020 & 2033
- Table 3: Global MRO Distribution in Food Revenue billion Forecast, by Region 2020 & 2033
- Table 4: Global MRO Distribution in Food Revenue billion Forecast, by Application 2020 & 2033
- Table 5: Global MRO Distribution in Food Revenue billion Forecast, by Types 2020 & 2033
- Table 6: Global MRO Distribution in Food Revenue billion Forecast, by Country 2020 & 2033
- Table 7: United States MRO Distribution in Food Revenue (billion) Forecast, by Application 2020 & 2033
- Table 8: Canada MRO Distribution in Food Revenue (billion) Forecast, by Application 2020 & 2033
- Table 9: Mexico MRO Distribution in Food Revenue (billion) Forecast, by Application 2020 & 2033
- Table 10: Global MRO Distribution in Food Revenue billion Forecast, by Application 2020 & 2033
- Table 11: Global MRO Distribution in Food Revenue billion Forecast, by Types 2020 & 2033
- Table 12: Global MRO Distribution in Food Revenue billion Forecast, by Country 2020 & 2033
- Table 13: Brazil MRO Distribution in Food Revenue (billion) Forecast, by Application 2020 & 2033
- Table 14: Argentina MRO Distribution in Food Revenue (billion) Forecast, by Application 2020 & 2033
- Table 15: Rest of South America MRO Distribution in Food Revenue (billion) Forecast, by Application 2020 & 2033
- Table 16: Global MRO Distribution in Food Revenue billion Forecast, by Application 2020 & 2033
- Table 17: Global MRO Distribution in Food Revenue billion Forecast, by Types 2020 & 2033
- Table 18: Global MRO Distribution in Food Revenue billion Forecast, by Country 2020 & 2033
- Table 19: United Kingdom MRO Distribution in Food Revenue (billion) Forecast, by Application 2020 & 2033
- Table 20: Germany MRO Distribution in Food Revenue (billion) Forecast, by Application 2020 & 2033
- Table 21: France MRO Distribution in Food Revenue (billion) Forecast, by Application 2020 & 2033
- Table 22: Italy MRO Distribution in Food Revenue (billion) Forecast, by Application 2020 & 2033
- Table 23: Spain MRO Distribution in Food Revenue (billion) Forecast, by Application 2020 & 2033
- Table 24: Russia MRO Distribution in Food Revenue (billion) Forecast, by Application 2020 & 2033
- Table 25: Benelux MRO Distribution in Food Revenue (billion) Forecast, by Application 2020 & 2033
- Table 26: Nordics MRO Distribution in Food Revenue (billion) Forecast, by Application 2020 & 2033
- Table 27: Rest of Europe MRO Distribution in Food Revenue (billion) Forecast, by Application 2020 & 2033
- Table 28: Global MRO Distribution in Food Revenue billion Forecast, by Application 2020 & 2033
- Table 29: Global MRO Distribution in Food Revenue billion Forecast, by Types 2020 & 2033
- Table 30: Global MRO Distribution in Food Revenue billion Forecast, by Country 2020 & 2033
- Table 31: Turkey MRO Distribution in Food Revenue (billion) Forecast, by Application 2020 & 2033
- Table 32: Israel MRO Distribution in Food Revenue (billion) Forecast, by Application 2020 & 2033
- Table 33: GCC MRO Distribution in Food Revenue (billion) Forecast, by Application 2020 & 2033
- Table 34: North Africa MRO Distribution in Food Revenue (billion) Forecast, by Application 2020 & 2033
- Table 35: South Africa MRO Distribution in Food Revenue (billion) Forecast, by Application 2020 & 2033
- Table 36: Rest of Middle East & Africa MRO Distribution in Food Revenue (billion) Forecast, by Application 2020 & 2033
- Table 37: Global MRO Distribution in Food Revenue billion Forecast, by Application 2020 & 2033
- Table 38: Global MRO Distribution in Food Revenue billion Forecast, by Types 2020 & 2033
- Table 39: Global MRO Distribution in Food Revenue billion Forecast, by Country 2020 & 2033
- Table 40: China MRO Distribution in Food Revenue (billion) Forecast, by Application 2020 & 2033
- Table 41: India MRO Distribution in Food Revenue (billion) Forecast, by Application 2020 & 2033
- Table 42: Japan MRO Distribution in Food Revenue (billion) Forecast, by Application 2020 & 2033
- Table 43: South Korea MRO Distribution in Food Revenue (billion) Forecast, by Application 2020 & 2033
- Table 44: ASEAN MRO Distribution in Food Revenue (billion) Forecast, by Application 2020 & 2033
- Table 45: Oceania MRO Distribution in Food Revenue (billion) Forecast, by Application 2020 & 2033
- Table 46: Rest of Asia Pacific MRO Distribution in Food Revenue (billion) Forecast, by Application 2020 & 2033
Frequently Asked Questions
1. What is the projected Compound Annual Growth Rate (CAGR) of the MRO Distribution in Food?
The projected CAGR is approximately 2.6%.
2. Which companies are prominent players in the MRO Distribution in Food?
Key companies in the market include Cromwell Group (Holdings) Limited (Grainger), Graco Inc., WABCO (ZF), Mento AS, Valeo Service UK Ltd, Ascendum, Bodo Möller Chemie GmbH, Lindberg & Lund AS (Biesterfeld), Neumo-Egmo Spain SL, Gazechim Composites Norden AB, ABB Group, Rohde & Schwarz, Schneider Electric.
3. What are the main segments of the MRO Distribution in Food?
The market segments include Application, Types.
4. Can you provide details about the market size?
The market size is estimated to be USD 161.7 billion as of 2022.
5. What are some drivers contributing to market growth?
N/A
6. What are the notable trends driving market growth?
N/A
7. Are there any restraints impacting market growth?
N/A
8. Can you provide examples of recent developments in the market?
N/A
9. What pricing options are available for accessing the report?
Pricing options include single-user, multi-user, and enterprise licenses priced at USD 3350.00, USD 5025.00, and USD 6700.00 respectively.
10. Is the market size provided in terms of value or volume?
The market size is provided in terms of value, measured in billion.
11. Are there any specific market keywords associated with the report?
Yes, the market keyword associated with the report is "MRO Distribution in Food," which aids in identifying and referencing the specific market segment covered.
12. How do I determine which pricing option suits my needs best?
The pricing options vary based on user requirements and access needs. Individual users may opt for single-user licenses, while businesses requiring broader access may choose multi-user or enterprise licenses for cost-effective access to the report.
13. Are there any additional resources or data provided in the MRO Distribution in Food report?
While the report offers comprehensive insights, it's advisable to review the specific contents or supplementary materials provided to ascertain if additional resources or data are available.
14. How can I stay updated on further developments or reports in the MRO Distribution in Food?
To stay informed about further developments, trends, and reports in the MRO Distribution in Food, consider subscribing to industry newsletters, following relevant companies and organizations, or regularly checking reputable industry news sources and publications.
Methodology
Step 1 - Identification of Relevant Samples Size from Population Database


Step 2 - Approaches for Defining Global Market Size (Value, Volume* & Price*)

Note*: In applicable scenarios
Step 3 - Data Sources
Primary Research
- Web Analytics
- Survey Reports
- Research Institute
- Latest Research Reports
- Opinion Leaders
Secondary Research
- Annual Reports
- White Paper
- Latest Press Release
- Industry Association
- Paid Database
- Investor Presentations

Step 4 - Data Triangulation
Involves using different sources of information in order to increase the validity of a study
These sources are likely to be stakeholders in a program - participants, other researchers, program staff, other community members, and so on.
Then we put all data in single framework & apply various statistical tools to find out the dynamic on the market.
During the analysis stage, feedback from the stakeholder groups would be compared to determine areas of agreement as well as areas of divergence