

Key Insights
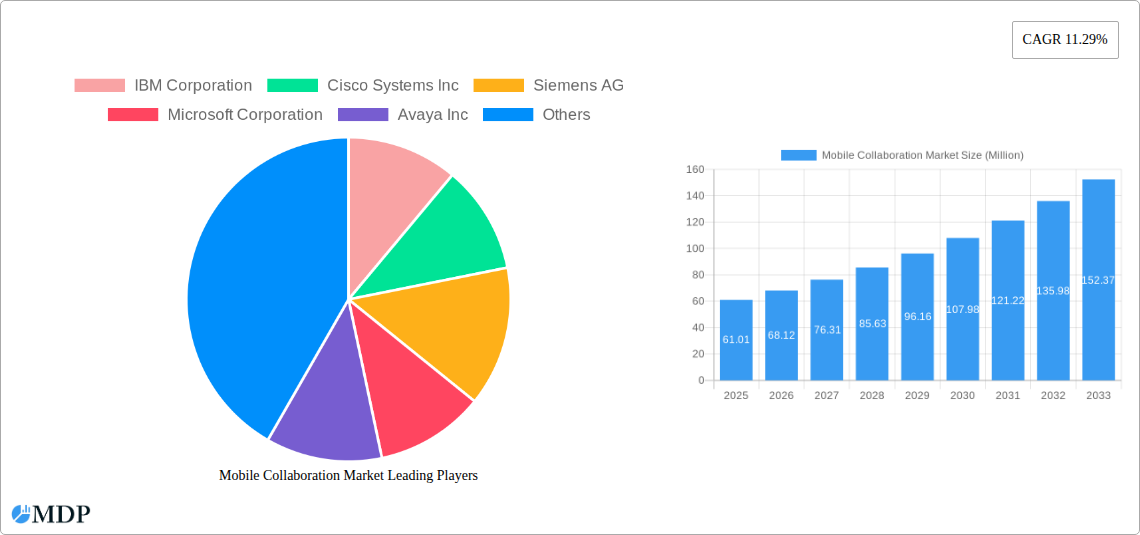
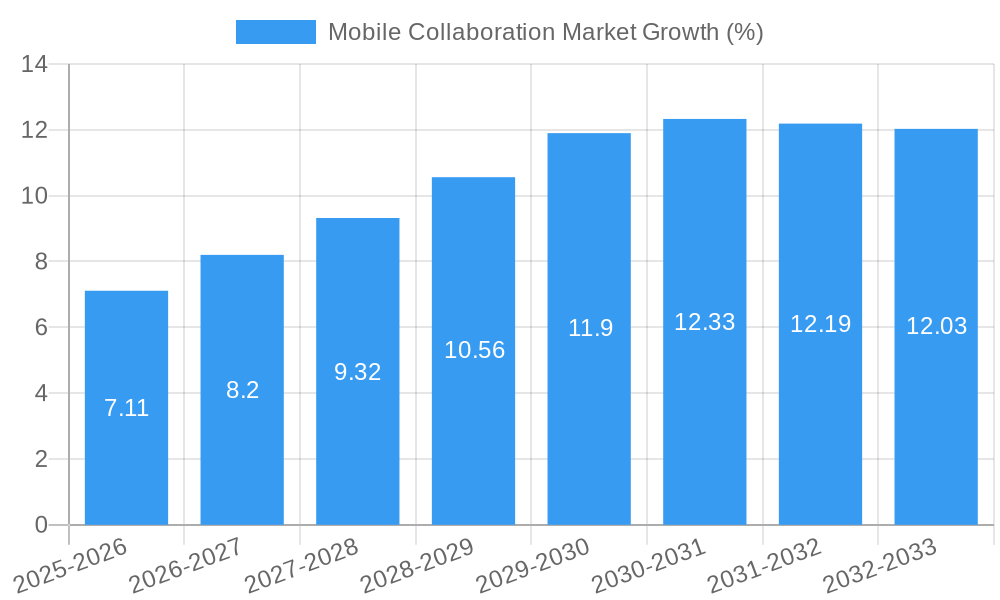
The global mobile collaboration market, valued at $61.01 million in 2025, is experiencing robust growth, projected to expand at a Compound Annual Growth Rate (CAGR) of 11.29% from 2025 to 2033. This expansion is driven by several key factors. The increasing adoption of mobile devices and the rise of remote work and hybrid work models significantly fuel the demand for seamless communication and collaboration solutions. Businesses are increasingly investing in mobile-first strategies to enhance employee productivity and streamline workflows, leading to a surge in the adoption of mobile collaboration tools. Furthermore, advancements in technologies such as 5G, cloud computing, and artificial intelligence are enabling the development of more sophisticated and feature-rich mobile collaboration platforms, further stimulating market growth. The BFSI, public sector, and healthcare sectors are leading adopters, leveraging mobile collaboration for improved operational efficiency, enhanced customer service, and better data security.
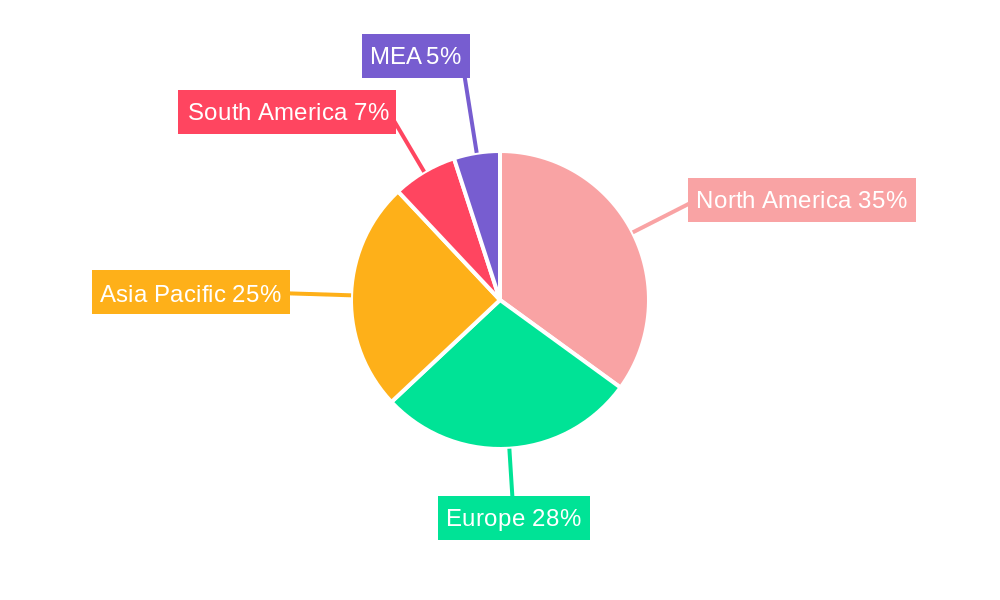
Market segmentation reveals significant opportunities across various service types, including managed and professional services. The preference for specific solutions varies across industries, with portals and intranet platforms, file sharing and synchronization, and enterprise video seeing strong traction. Geographically, North America and Europe currently hold substantial market shares, but the Asia-Pacific region is projected to witness the fastest growth due to rising smartphone penetration and increasing digitalization. Competition is fierce, with established players like IBM, Cisco, Microsoft, and Oracle alongside emerging technology providers vying for market dominance. However, challenges remain, including concerns regarding data security and privacy, integration complexities with existing IT infrastructure, and the need for robust training and support for effective adoption. Future growth will depend on continuous innovation, addressing security concerns, and expanding accessibility to diverse user groups.
Unlock Explosive Growth: The Comprehensive Mobile Collaboration Market Report (2019-2033)
This in-depth report provides a comprehensive analysis of the Mobile Collaboration Market, offering invaluable insights for businesses, investors, and industry stakeholders seeking to navigate this rapidly evolving landscape. Leveraging data from 2019-2024 (historical period) and projecting to 2033 (forecast period), with a base year of 2025 and estimated year of 2025, this report offers a detailed look at market dynamics, key players, and future trends. The market is projected to reach xx Million by 2033, showcasing significant growth potential.
Mobile Collaboration Market Market Dynamics & Concentration
The Mobile Collaboration Market is experiencing dynamic growth fueled by technological innovation, evolving regulatory frameworks, and shifting end-user preferences. Market concentration is moderate, with key players such as IBM Corporation, Cisco Systems Inc, and Microsoft Corporation holding significant shares. However, the market also exhibits considerable fragmentation, with numerous smaller players competing in specialized niches.
Key Dynamics:
- Innovation Drivers: Advancements in cloud computing, 5G technology, and AI are driving the adoption of advanced mobile collaboration solutions. The integration of these technologies is enabling more seamless communication, enhanced data security, and improved user experience.
- Regulatory Frameworks: Data privacy regulations (e.g., GDPR) are impacting the market, influencing the development of compliant solutions and driving demand for secure collaboration platforms.
- Product Substitutes: While dedicated mobile collaboration platforms dominate the market, alternative communication channels like video conferencing apps and instant messaging services pose a degree of competitive pressure.
- End-User Trends: The increasing adoption of remote work models and the growing need for flexible work arrangements are boosting demand for mobile collaboration tools.
- M&A Activities: The market has witnessed a moderate number of mergers and acquisitions (xx deals in the past 5 years), reflecting strategic consolidation and efforts to expand market share. Market share data indicates that the top 5 players currently hold approximately xx% of the market share collectively.
Mobile Collaboration Market Industry Trends & Analysis
The Mobile Collaboration Market is characterized by robust growth, driven by several key factors. The market is projected to register a CAGR of xx% during the forecast period (2025-2033). This growth is fueled by the increasing adoption of mobile devices in the workplace, rising demand for enhanced productivity and efficiency, and the expanding need for seamless communication and collaboration across geographically dispersed teams.
Technological disruptions, particularly the widespread adoption of cloud-based solutions and the integration of AI-powered features, are reshaping the competitive landscape. Consumer preferences are shifting towards user-friendly, feature-rich platforms that offer seamless integration with other business applications. The competitive dynamics are highly intense, with established players and new entrants vying for market share through innovation, strategic partnerships, and aggressive pricing strategies. Market penetration is steadily increasing, particularly within the BFSI, IT & Telecom, and Public Sector segments.
Leading Markets & Segments in Mobile Collaboration Market
The North American region currently holds the dominant position in the Mobile Collaboration Market, driven by factors such as robust IT infrastructure, high technological adoption rates, and a strong focus on digital transformation. However, the Asia-Pacific region is poised for rapid growth due to increasing smartphone penetration and expanding internet connectivity.
Leading Segments:
- By Services: Managed services are projected to experience faster growth than professional services due to cost-effectiveness and scalability.
- By End-user Industry: The BFSI sector is a major driver, driven by the need for secure and compliant collaboration solutions. The Public Sector is another significant segment, fueled by the need for efficient communication and information sharing. Healthcare and IT & Telecom also exhibit robust growth.
- By Solution: File sharing and synchronization solutions dominate the market due to their widespread applicability and relative ease of use. Enterprise video conferencing is also witnessing substantial growth.
Key Drivers by Region:
- North America: Strong IT infrastructure, high digital literacy rates, and robust government support for technology adoption.
- Asia-Pacific: Rising smartphone penetration, expanding internet connectivity, and increasing adoption of cloud-based solutions.
- Europe: Stringent data privacy regulations driving demand for secure collaboration solutions.
Mobile Collaboration Market Product Developments
Recent product innovations focus on enhancing security, improving user experience, and integrating advanced functionalities such as AI-powered chatbots and real-time translation capabilities. These improvements are designed to increase market fit and provide competitive advantages. The trend toward integrating mobile collaboration tools with existing enterprise resource planning (ERP) and customer relationship management (CRM) systems is also gaining traction, boosting productivity and streamlining workflows.
Key Drivers of Mobile Collaboration Market Growth
Several key factors are driving the growth of the Mobile Collaboration Market:
- Technological advancements: Cloud computing, AI, and 5G are enabling enhanced functionalities and improved user experiences.
- Economic factors: The increasing adoption of remote work models and the need for cost-effective collaboration solutions are contributing to market growth.
- Regulatory factors: Data privacy regulations are driving demand for secure and compliant collaboration platforms.
Challenges in the Mobile Collaboration Market Market
The Mobile Collaboration Market faces several challenges:
- Regulatory hurdles: Compliance with data privacy regulations adds complexity and cost to product development and deployment.
- Supply chain issues: Global supply chain disruptions can impact the availability of hardware and software components.
- Competitive pressures: The market is highly competitive, with numerous players vying for market share.
Emerging Opportunities in Mobile Collaboration Market
Emerging opportunities include the integration of Extended Reality (XR) technologies, the development of more sophisticated AI-powered features, and the expansion into new and underserved markets. Strategic partnerships and the development of innovative business models are also expected to drive long-term growth.
Leading Players in the Mobile Collaboration Market Sector
- IBM Corporation
- Cisco Systems Inc
- Siemens AG
- Microsoft Corporation
- Avaya Inc
- NEC Corporation
- Oracle Corporation
- Ribbon Communications LLC
- Alcatel-Lucent SA
Key Milestones in Mobile Collaboration Market Industry
- 2020: Widespread adoption of remote work accelerates the demand for mobile collaboration tools.
- 2021: Significant investments in R&D for AI-powered collaboration features.
- 2022: Several major M&A activities reshape the competitive landscape.
- 2023: Launch of several new cloud-based mobile collaboration platforms.
Strategic Outlook for Mobile Collaboration Market Market
The Mobile Collaboration Market is poised for sustained growth, driven by ongoing technological advancements, expanding market penetration, and the increasing need for seamless communication and collaboration. Strategic opportunities exist for companies that can effectively leverage emerging technologies, develop innovative business models, and cater to the evolving needs of diverse end-user segments. The market's future is bright, presenting significant growth potential for forward-thinking businesses.
Mobile Collaboration Market Segmentation
-
1. Solution
- 1.1. Portals and Intranet Platform
- 1.2. File Sharing and Synchronization
- 1.3. Enterprise Video
- 1.4. Enterprise Social Network
- 1.5. Other Solutions
-
2. Services
- 2.1. Managed Services
- 2.2. Professional Services
-
3. End-user Industry
- 3.1. BFSI
- 3.2. Public Sector
- 3.3. Healthcare
- 3.4. Energy and Utilities
- 3.5. Retail
- 3.6. IT and Telecom
- 3.7. Travel and Hospitality
Mobile Collaboration Market Segmentation By Geography
- 1. North America
- 2. Europe
- 3. Asia Pacific
- 4. Latin America
- 5. Middle East
Mobile Collaboration Market REPORT HIGHLIGHTS
| Aspects | Details |
|---|---|
| Study Period | 2019-2033 |
| Base Year | 2024 |
| Estimated Year | 2025 |
| Forecast Period | 2025-2033 |
| Historical Period | 2019-2024 |
| Growth Rate | CAGR of 11.29% from 2019-2033 |
| Segmentation |
|
Table of Contents
- 1. Introduction
- 1.1. Research Scope
- 1.2. Market Segmentation
- 1.3. Research Methodology
- 1.4. Definitions and Assumptions
- 2. Executive Summary
- 2.1. Introduction
- 3. Market Dynamics
- 3.1. Introduction
- 3.2. Market Drivers
- 3.2.1. Increased Demand for BYOD Applications; Growing Smart Devices Sales
- 3.3. Market Restrains
- 3.3.1. Security Concerns to Challenge the Market Growth
- 3.4. Market Trends
- 3.4.1. Retail Segment is Expected to Witness High Growth
- 4. Market Factor Analysis
- 4.1. Porters Five Forces
- 4.2. Supply/Value Chain
- 4.3. PESTEL analysis
- 4.4. Market Entropy
- 4.5. Patent/Trademark Analysis
- 5. Global Mobile Collaboration Market Analysis, Insights and Forecast, 2019-2031
- 5.1. Market Analysis, Insights and Forecast - by Solution
- 5.1.1. Portals and Intranet Platform
- 5.1.2. File Sharing and Synchronization
- 5.1.3. Enterprise Video
- 5.1.4. Enterprise Social Network
- 5.1.5. Other Solutions
- 5.2. Market Analysis, Insights and Forecast - by Services
- 5.2.1. Managed Services
- 5.2.2. Professional Services
- 5.3. Market Analysis, Insights and Forecast - by End-user Industry
- 5.3.1. BFSI
- 5.3.2. Public Sector
- 5.3.3. Healthcare
- 5.3.4. Energy and Utilities
- 5.3.5. Retail
- 5.3.6. IT and Telecom
- 5.3.7. Travel and Hospitality
- 5.4. Market Analysis, Insights and Forecast - by Region
- 5.4.1. North America
- 5.4.2. Europe
- 5.4.3. Asia Pacific
- 5.4.4. Latin America
- 5.4.5. Middle East
- 5.1. Market Analysis, Insights and Forecast - by Solution
- 6. North America Mobile Collaboration Market Analysis, Insights and Forecast, 2019-2031
- 6.1. Market Analysis, Insights and Forecast - by Solution
- 6.1.1. Portals and Intranet Platform
- 6.1.2. File Sharing and Synchronization
- 6.1.3. Enterprise Video
- 6.1.4. Enterprise Social Network
- 6.1.5. Other Solutions
- 6.2. Market Analysis, Insights and Forecast - by Services
- 6.2.1. Managed Services
- 6.2.2. Professional Services
- 6.3. Market Analysis, Insights and Forecast - by End-user Industry
- 6.3.1. BFSI
- 6.3.2. Public Sector
- 6.3.3. Healthcare
- 6.3.4. Energy and Utilities
- 6.3.5. Retail
- 6.3.6. IT and Telecom
- 6.3.7. Travel and Hospitality
- 6.1. Market Analysis, Insights and Forecast - by Solution
- 7. Europe Mobile Collaboration Market Analysis, Insights and Forecast, 2019-2031
- 7.1. Market Analysis, Insights and Forecast - by Solution
- 7.1.1. Portals and Intranet Platform
- 7.1.2. File Sharing and Synchronization
- 7.1.3. Enterprise Video
- 7.1.4. Enterprise Social Network
- 7.1.5. Other Solutions
- 7.2. Market Analysis, Insights and Forecast - by Services
- 7.2.1. Managed Services
- 7.2.2. Professional Services
- 7.3. Market Analysis, Insights and Forecast - by End-user Industry
- 7.3.1. BFSI
- 7.3.2. Public Sector
- 7.3.3. Healthcare
- 7.3.4. Energy and Utilities
- 7.3.5. Retail
- 7.3.6. IT and Telecom
- 7.3.7. Travel and Hospitality
- 7.1. Market Analysis, Insights and Forecast - by Solution
- 8. Asia Pacific Mobile Collaboration Market Analysis, Insights and Forecast, 2019-2031
- 8.1. Market Analysis, Insights and Forecast - by Solution
- 8.1.1. Portals and Intranet Platform
- 8.1.2. File Sharing and Synchronization
- 8.1.3. Enterprise Video
- 8.1.4. Enterprise Social Network
- 8.1.5. Other Solutions
- 8.2. Market Analysis, Insights and Forecast - by Services
- 8.2.1. Managed Services
- 8.2.2. Professional Services
- 8.3. Market Analysis, Insights and Forecast - by End-user Industry
- 8.3.1. BFSI
- 8.3.2. Public Sector
- 8.3.3. Healthcare
- 8.3.4. Energy and Utilities
- 8.3.5. Retail
- 8.3.6. IT and Telecom
- 8.3.7. Travel and Hospitality
- 8.1. Market Analysis, Insights and Forecast - by Solution
- 9. Latin America Mobile Collaboration Market Analysis, Insights and Forecast, 2019-2031
- 9.1. Market Analysis, Insights and Forecast - by Solution
- 9.1.1. Portals and Intranet Platform
- 9.1.2. File Sharing and Synchronization
- 9.1.3. Enterprise Video
- 9.1.4. Enterprise Social Network
- 9.1.5. Other Solutions
- 9.2. Market Analysis, Insights and Forecast - by Services
- 9.2.1. Managed Services
- 9.2.2. Professional Services
- 9.3. Market Analysis, Insights and Forecast - by End-user Industry
- 9.3.1. BFSI
- 9.3.2. Public Sector
- 9.3.3. Healthcare
- 9.3.4. Energy and Utilities
- 9.3.5. Retail
- 9.3.6. IT and Telecom
- 9.3.7. Travel and Hospitality
- 9.1. Market Analysis, Insights and Forecast - by Solution
- 10. Middle East Mobile Collaboration Market Analysis, Insights and Forecast, 2019-2031
- 10.1. Market Analysis, Insights and Forecast - by Solution
- 10.1.1. Portals and Intranet Platform
- 10.1.2. File Sharing and Synchronization
- 10.1.3. Enterprise Video
- 10.1.4. Enterprise Social Network
- 10.1.5. Other Solutions
- 10.2. Market Analysis, Insights and Forecast - by Services
- 10.2.1. Managed Services
- 10.2.2. Professional Services
- 10.3. Market Analysis, Insights and Forecast - by End-user Industry
- 10.3.1. BFSI
- 10.3.2. Public Sector
- 10.3.3. Healthcare
- 10.3.4. Energy and Utilities
- 10.3.5. Retail
- 10.3.6. IT and Telecom
- 10.3.7. Travel and Hospitality
- 10.1. Market Analysis, Insights and Forecast - by Solution
- 11. North America Mobile Collaboration Market Analysis, Insights and Forecast, 2019-2031
- 11.1. Market Analysis, Insights and Forecast - By Country/Sub-region
- 11.1.1 United States
- 11.1.2 Canada
- 11.1.3 Mexico
- 12. Europe Mobile Collaboration Market Analysis, Insights and Forecast, 2019-2031
- 12.1. Market Analysis, Insights and Forecast - By Country/Sub-region
- 12.1.1 Germany
- 12.1.2 United Kingdom
- 12.1.3 France
- 12.1.4 Spain
- 12.1.5 Italy
- 12.1.6 Spain
- 12.1.7 Belgium
- 12.1.8 Netherland
- 12.1.9 Nordics
- 12.1.10 Rest of Europe
- 13. Asia Pacific Mobile Collaboration Market Analysis, Insights and Forecast, 2019-2031
- 13.1. Market Analysis, Insights and Forecast - By Country/Sub-region
- 13.1.1 China
- 13.1.2 Japan
- 13.1.3 India
- 13.1.4 South Korea
- 13.1.5 Southeast Asia
- 13.1.6 Australia
- 13.1.7 Indonesia
- 13.1.8 Phillipes
- 13.1.9 Singapore
- 13.1.10 Thailandc
- 13.1.11 Rest of Asia Pacific
- 14. South America Mobile Collaboration Market Analysis, Insights and Forecast, 2019-2031
- 14.1. Market Analysis, Insights and Forecast - By Country/Sub-region
- 14.1.1 Brazil
- 14.1.2 Argentina
- 14.1.3 Peru
- 14.1.4 Chile
- 14.1.5 Colombia
- 14.1.6 Ecuador
- 14.1.7 Venezuela
- 14.1.8 Rest of South America
- 15. North America Mobile Collaboration Market Analysis, Insights and Forecast, 2019-2031
- 15.1. Market Analysis, Insights and Forecast - By Country/Sub-region
- 15.1.1 United States
- 15.1.2 Canada
- 15.1.3 Mexico
- 16. MEA Mobile Collaboration Market Analysis, Insights and Forecast, 2019-2031
- 16.1. Market Analysis, Insights and Forecast - By Country/Sub-region
- 16.1.1 United Arab Emirates
- 16.1.2 Saudi Arabia
- 16.1.3 South Africa
- 16.1.4 Rest of Middle East and Africa
- 17. Competitive Analysis
- 17.1. Global Market Share Analysis 2024
- 17.2. Company Profiles
- 17.2.1 IBM Corporation
- 17.2.1.1. Overview
- 17.2.1.2. Products
- 17.2.1.3. SWOT Analysis
- 17.2.1.4. Recent Developments
- 17.2.1.5. Financials (Based on Availability)
- 17.2.2 Cisco Systems Inc
- 17.2.2.1. Overview
- 17.2.2.2. Products
- 17.2.2.3. SWOT Analysis
- 17.2.2.4. Recent Developments
- 17.2.2.5. Financials (Based on Availability)
- 17.2.3 Siemens AG
- 17.2.3.1. Overview
- 17.2.3.2. Products
- 17.2.3.3. SWOT Analysis
- 17.2.3.4. Recent Developments
- 17.2.3.5. Financials (Based on Availability)
- 17.2.4 Microsoft Corporation
- 17.2.4.1. Overview
- 17.2.4.2. Products
- 17.2.4.3. SWOT Analysis
- 17.2.4.4. Recent Developments
- 17.2.4.5. Financials (Based on Availability)
- 17.2.5 Avaya Inc
- 17.2.5.1. Overview
- 17.2.5.2. Products
- 17.2.5.3. SWOT Analysis
- 17.2.5.4. Recent Developments
- 17.2.5.5. Financials (Based on Availability)
- 17.2.6 NEC Corporation
- 17.2.6.1. Overview
- 17.2.6.2. Products
- 17.2.6.3. SWOT Analysis
- 17.2.6.4. Recent Developments
- 17.2.6.5. Financials (Based on Availability)
- 17.2.7 Oracle Corporation
- 17.2.7.1. Overview
- 17.2.7.2. Products
- 17.2.7.3. SWOT Analysis
- 17.2.7.4. Recent Developments
- 17.2.7.5. Financials (Based on Availability)
- 17.2.8 Ribbon Communications LLC
- 17.2.8.1. Overview
- 17.2.8.2. Products
- 17.2.8.3. SWOT Analysis
- 17.2.8.4. Recent Developments
- 17.2.8.5. Financials (Based on Availability)
- 17.2.9 Alcatel-Lucent SA
- 17.2.9.1. Overview
- 17.2.9.2. Products
- 17.2.9.3. SWOT Analysis
- 17.2.9.4. Recent Developments
- 17.2.9.5. Financials (Based on Availability)
- 17.2.1 IBM Corporation
List of Figures
- Figure 1: Global Mobile Collaboration Market Revenue Breakdown (Million, %) by Region 2024 & 2032
- Figure 2: Global Mobile Collaboration Market Volume Breakdown (K Unit, %) by Region 2024 & 2032
- Figure 3: North America Mobile Collaboration Market Revenue (Million), by Country 2024 & 2032
- Figure 4: North America Mobile Collaboration Market Volume (K Unit), by Country 2024 & 2032
- Figure 5: North America Mobile Collaboration Market Revenue Share (%), by Country 2024 & 2032
- Figure 6: North America Mobile Collaboration Market Volume Share (%), by Country 2024 & 2032
- Figure 7: Europe Mobile Collaboration Market Revenue (Million), by Country 2024 & 2032
- Figure 8: Europe Mobile Collaboration Market Volume (K Unit), by Country 2024 & 2032
- Figure 9: Europe Mobile Collaboration Market Revenue Share (%), by Country 2024 & 2032
- Figure 10: Europe Mobile Collaboration Market Volume Share (%), by Country 2024 & 2032
- Figure 11: Asia Pacific Mobile Collaboration Market Revenue (Million), by Country 2024 & 2032
- Figure 12: Asia Pacific Mobile Collaboration Market Volume (K Unit), by Country 2024 & 2032
- Figure 13: Asia Pacific Mobile Collaboration Market Revenue Share (%), by Country 2024 & 2032
- Figure 14: Asia Pacific Mobile Collaboration Market Volume Share (%), by Country 2024 & 2032
- Figure 15: South America Mobile Collaboration Market Revenue (Million), by Country 2024 & 2032
- Figure 16: South America Mobile Collaboration Market Volume (K Unit), by Country 2024 & 2032
- Figure 17: South America Mobile Collaboration Market Revenue Share (%), by Country 2024 & 2032
- Figure 18: South America Mobile Collaboration Market Volume Share (%), by Country 2024 & 2032
- Figure 19: North America Mobile Collaboration Market Revenue (Million), by Country 2024 & 2032
- Figure 20: North America Mobile Collaboration Market Volume (K Unit), by Country 2024 & 2032
- Figure 21: North America Mobile Collaboration Market Revenue Share (%), by Country 2024 & 2032
- Figure 22: North America Mobile Collaboration Market Volume Share (%), by Country 2024 & 2032
- Figure 23: MEA Mobile Collaboration Market Revenue (Million), by Country 2024 & 2032
- Figure 24: MEA Mobile Collaboration Market Volume (K Unit), by Country 2024 & 2032
- Figure 25: MEA Mobile Collaboration Market Revenue Share (%), by Country 2024 & 2032
- Figure 26: MEA Mobile Collaboration Market Volume Share (%), by Country 2024 & 2032
- Figure 27: North America Mobile Collaboration Market Revenue (Million), by Solution 2024 & 2032
- Figure 28: North America Mobile Collaboration Market Volume (K Unit), by Solution 2024 & 2032
- Figure 29: North America Mobile Collaboration Market Revenue Share (%), by Solution 2024 & 2032
- Figure 30: North America Mobile Collaboration Market Volume Share (%), by Solution 2024 & 2032
- Figure 31: North America Mobile Collaboration Market Revenue (Million), by Services 2024 & 2032
- Figure 32: North America Mobile Collaboration Market Volume (K Unit), by Services 2024 & 2032
- Figure 33: North America Mobile Collaboration Market Revenue Share (%), by Services 2024 & 2032
- Figure 34: North America Mobile Collaboration Market Volume Share (%), by Services 2024 & 2032
- Figure 35: North America Mobile Collaboration Market Revenue (Million), by End-user Industry 2024 & 2032
- Figure 36: North America Mobile Collaboration Market Volume (K Unit), by End-user Industry 2024 & 2032
- Figure 37: North America Mobile Collaboration Market Revenue Share (%), by End-user Industry 2024 & 2032
- Figure 38: North America Mobile Collaboration Market Volume Share (%), by End-user Industry 2024 & 2032
- Figure 39: North America Mobile Collaboration Market Revenue (Million), by Country 2024 & 2032
- Figure 40: North America Mobile Collaboration Market Volume (K Unit), by Country 2024 & 2032
- Figure 41: North America Mobile Collaboration Market Revenue Share (%), by Country 2024 & 2032
- Figure 42: North America Mobile Collaboration Market Volume Share (%), by Country 2024 & 2032
- Figure 43: Europe Mobile Collaboration Market Revenue (Million), by Solution 2024 & 2032
- Figure 44: Europe Mobile Collaboration Market Volume (K Unit), by Solution 2024 & 2032
- Figure 45: Europe Mobile Collaboration Market Revenue Share (%), by Solution 2024 & 2032
- Figure 46: Europe Mobile Collaboration Market Volume Share (%), by Solution 2024 & 2032
- Figure 47: Europe Mobile Collaboration Market Revenue (Million), by Services 2024 & 2032
- Figure 48: Europe Mobile Collaboration Market Volume (K Unit), by Services 2024 & 2032
- Figure 49: Europe Mobile Collaboration Market Revenue Share (%), by Services 2024 & 2032
- Figure 50: Europe Mobile Collaboration Market Volume Share (%), by Services 2024 & 2032
- Figure 51: Europe Mobile Collaboration Market Revenue (Million), by End-user Industry 2024 & 2032
- Figure 52: Europe Mobile Collaboration Market Volume (K Unit), by End-user Industry 2024 & 2032
- Figure 53: Europe Mobile Collaboration Market Revenue Share (%), by End-user Industry 2024 & 2032
- Figure 54: Europe Mobile Collaboration Market Volume Share (%), by End-user Industry 2024 & 2032
- Figure 55: Europe Mobile Collaboration Market Revenue (Million), by Country 2024 & 2032
- Figure 56: Europe Mobile Collaboration Market Volume (K Unit), by Country 2024 & 2032
- Figure 57: Europe Mobile Collaboration Market Revenue Share (%), by Country 2024 & 2032
- Figure 58: Europe Mobile Collaboration Market Volume Share (%), by Country 2024 & 2032
- Figure 59: Asia Pacific Mobile Collaboration Market Revenue (Million), by Solution 2024 & 2032
- Figure 60: Asia Pacific Mobile Collaboration Market Volume (K Unit), by Solution 2024 & 2032
- Figure 61: Asia Pacific Mobile Collaboration Market Revenue Share (%), by Solution 2024 & 2032
- Figure 62: Asia Pacific Mobile Collaboration Market Volume Share (%), by Solution 2024 & 2032
- Figure 63: Asia Pacific Mobile Collaboration Market Revenue (Million), by Services 2024 & 2032
- Figure 64: Asia Pacific Mobile Collaboration Market Volume (K Unit), by Services 2024 & 2032
- Figure 65: Asia Pacific Mobile Collaboration Market Revenue Share (%), by Services 2024 & 2032
- Figure 66: Asia Pacific Mobile Collaboration Market Volume Share (%), by Services 2024 & 2032
- Figure 67: Asia Pacific Mobile Collaboration Market Revenue (Million), by End-user Industry 2024 & 2032
- Figure 68: Asia Pacific Mobile Collaboration Market Volume (K Unit), by End-user Industry 2024 & 2032
- Figure 69: Asia Pacific Mobile Collaboration Market Revenue Share (%), by End-user Industry 2024 & 2032
- Figure 70: Asia Pacific Mobile Collaboration Market Volume Share (%), by End-user Industry 2024 & 2032
- Figure 71: Asia Pacific Mobile Collaboration Market Revenue (Million), by Country 2024 & 2032
- Figure 72: Asia Pacific Mobile Collaboration Market Volume (K Unit), by Country 2024 & 2032
- Figure 73: Asia Pacific Mobile Collaboration Market Revenue Share (%), by Country 2024 & 2032
- Figure 74: Asia Pacific Mobile Collaboration Market Volume Share (%), by Country 2024 & 2032
- Figure 75: Latin America Mobile Collaboration Market Revenue (Million), by Solution 2024 & 2032
- Figure 76: Latin America Mobile Collaboration Market Volume (K Unit), by Solution 2024 & 2032
- Figure 77: Latin America Mobile Collaboration Market Revenue Share (%), by Solution 2024 & 2032
- Figure 78: Latin America Mobile Collaboration Market Volume Share (%), by Solution 2024 & 2032
- Figure 79: Latin America Mobile Collaboration Market Revenue (Million), by Services 2024 & 2032
- Figure 80: Latin America Mobile Collaboration Market Volume (K Unit), by Services 2024 & 2032
- Figure 81: Latin America Mobile Collaboration Market Revenue Share (%), by Services 2024 & 2032
- Figure 82: Latin America Mobile Collaboration Market Volume Share (%), by Services 2024 & 2032
- Figure 83: Latin America Mobile Collaboration Market Revenue (Million), by End-user Industry 2024 & 2032
- Figure 84: Latin America Mobile Collaboration Market Volume (K Unit), by End-user Industry 2024 & 2032
- Figure 85: Latin America Mobile Collaboration Market Revenue Share (%), by End-user Industry 2024 & 2032
- Figure 86: Latin America Mobile Collaboration Market Volume Share (%), by End-user Industry 2024 & 2032
- Figure 87: Latin America Mobile Collaboration Market Revenue (Million), by Country 2024 & 2032
- Figure 88: Latin America Mobile Collaboration Market Volume (K Unit), by Country 2024 & 2032
- Figure 89: Latin America Mobile Collaboration Market Revenue Share (%), by Country 2024 & 2032
- Figure 90: Latin America Mobile Collaboration Market Volume Share (%), by Country 2024 & 2032
- Figure 91: Middle East Mobile Collaboration Market Revenue (Million), by Solution 2024 & 2032
- Figure 92: Middle East Mobile Collaboration Market Volume (K Unit), by Solution 2024 & 2032
- Figure 93: Middle East Mobile Collaboration Market Revenue Share (%), by Solution 2024 & 2032
- Figure 94: Middle East Mobile Collaboration Market Volume Share (%), by Solution 2024 & 2032
- Figure 95: Middle East Mobile Collaboration Market Revenue (Million), by Services 2024 & 2032
- Figure 96: Middle East Mobile Collaboration Market Volume (K Unit), by Services 2024 & 2032
- Figure 97: Middle East Mobile Collaboration Market Revenue Share (%), by Services 2024 & 2032
- Figure 98: Middle East Mobile Collaboration Market Volume Share (%), by Services 2024 & 2032
- Figure 99: Middle East Mobile Collaboration Market Revenue (Million), by End-user Industry 2024 & 2032
- Figure 100: Middle East Mobile Collaboration Market Volume (K Unit), by End-user Industry 2024 & 2032
- Figure 101: Middle East Mobile Collaboration Market Revenue Share (%), by End-user Industry 2024 & 2032
- Figure 102: Middle East Mobile Collaboration Market Volume Share (%), by End-user Industry 2024 & 2032
- Figure 103: Middle East Mobile Collaboration Market Revenue (Million), by Country 2024 & 2032
- Figure 104: Middle East Mobile Collaboration Market Volume (K Unit), by Country 2024 & 2032
- Figure 105: Middle East Mobile Collaboration Market Revenue Share (%), by Country 2024 & 2032
- Figure 106: Middle East Mobile Collaboration Market Volume Share (%), by Country 2024 & 2032
List of Tables
- Table 1: Global Mobile Collaboration Market Revenue Million Forecast, by Region 2019 & 2032
- Table 2: Global Mobile Collaboration Market Volume K Unit Forecast, by Region 2019 & 2032
- Table 3: Global Mobile Collaboration Market Revenue Million Forecast, by Solution 2019 & 2032
- Table 4: Global Mobile Collaboration Market Volume K Unit Forecast, by Solution 2019 & 2032
- Table 5: Global Mobile Collaboration Market Revenue Million Forecast, by Services 2019 & 2032
- Table 6: Global Mobile Collaboration Market Volume K Unit Forecast, by Services 2019 & 2032
- Table 7: Global Mobile Collaboration Market Revenue Million Forecast, by End-user Industry 2019 & 2032
- Table 8: Global Mobile Collaboration Market Volume K Unit Forecast, by End-user Industry 2019 & 2032
- Table 9: Global Mobile Collaboration Market Revenue Million Forecast, by Region 2019 & 2032
- Table 10: Global Mobile Collaboration Market Volume K Unit Forecast, by Region 2019 & 2032
- Table 11: Global Mobile Collaboration Market Revenue Million Forecast, by Country 2019 & 2032
- Table 12: Global Mobile Collaboration Market Volume K Unit Forecast, by Country 2019 & 2032
- Table 13: United States Mobile Collaboration Market Revenue (Million) Forecast, by Application 2019 & 2032
- Table 14: United States Mobile Collaboration Market Volume (K Unit) Forecast, by Application 2019 & 2032
- Table 15: Canada Mobile Collaboration Market Revenue (Million) Forecast, by Application 2019 & 2032
- Table 16: Canada Mobile Collaboration Market Volume (K Unit) Forecast, by Application 2019 & 2032
- Table 17: Mexico Mobile Collaboration Market Revenue (Million) Forecast, by Application 2019 & 2032
- Table 18: Mexico Mobile Collaboration Market Volume (K Unit) Forecast, by Application 2019 & 2032
- Table 19: Global Mobile Collaboration Market Revenue Million Forecast, by Country 2019 & 2032
- Table 20: Global Mobile Collaboration Market Volume K Unit Forecast, by Country 2019 & 2032
- Table 21: Germany Mobile Collaboration Market Revenue (Million) Forecast, by Application 2019 & 2032
- Table 22: Germany Mobile Collaboration Market Volume (K Unit) Forecast, by Application 2019 & 2032
- Table 23: United Kingdom Mobile Collaboration Market Revenue (Million) Forecast, by Application 2019 & 2032
- Table 24: United Kingdom Mobile Collaboration Market Volume (K Unit) Forecast, by Application 2019 & 2032
- Table 25: France Mobile Collaboration Market Revenue (Million) Forecast, by Application 2019 & 2032
- Table 26: France Mobile Collaboration Market Volume (K Unit) Forecast, by Application 2019 & 2032
- Table 27: Spain Mobile Collaboration Market Revenue (Million) Forecast, by Application 2019 & 2032
- Table 28: Spain Mobile Collaboration Market Volume (K Unit) Forecast, by Application 2019 & 2032
- Table 29: Italy Mobile Collaboration Market Revenue (Million) Forecast, by Application 2019 & 2032
- Table 30: Italy Mobile Collaboration Market Volume (K Unit) Forecast, by Application 2019 & 2032
- Table 31: Spain Mobile Collaboration Market Revenue (Million) Forecast, by Application 2019 & 2032
- Table 32: Spain Mobile Collaboration Market Volume (K Unit) Forecast, by Application 2019 & 2032
- Table 33: Belgium Mobile Collaboration Market Revenue (Million) Forecast, by Application 2019 & 2032
- Table 34: Belgium Mobile Collaboration Market Volume (K Unit) Forecast, by Application 2019 & 2032
- Table 35: Netherland Mobile Collaboration Market Revenue (Million) Forecast, by Application 2019 & 2032
- Table 36: Netherland Mobile Collaboration Market Volume (K Unit) Forecast, by Application 2019 & 2032
- Table 37: Nordics Mobile Collaboration Market Revenue (Million) Forecast, by Application 2019 & 2032
- Table 38: Nordics Mobile Collaboration Market Volume (K Unit) Forecast, by Application 2019 & 2032
- Table 39: Rest of Europe Mobile Collaboration Market Revenue (Million) Forecast, by Application 2019 & 2032
- Table 40: Rest of Europe Mobile Collaboration Market Volume (K Unit) Forecast, by Application 2019 & 2032
- Table 41: Global Mobile Collaboration Market Revenue Million Forecast, by Country 2019 & 2032
- Table 42: Global Mobile Collaboration Market Volume K Unit Forecast, by Country 2019 & 2032
- Table 43: China Mobile Collaboration Market Revenue (Million) Forecast, by Application 2019 & 2032
- Table 44: China Mobile Collaboration Market Volume (K Unit) Forecast, by Application 2019 & 2032
- Table 45: Japan Mobile Collaboration Market Revenue (Million) Forecast, by Application 2019 & 2032
- Table 46: Japan Mobile Collaboration Market Volume (K Unit) Forecast, by Application 2019 & 2032
- Table 47: India Mobile Collaboration Market Revenue (Million) Forecast, by Application 2019 & 2032
- Table 48: India Mobile Collaboration Market Volume (K Unit) Forecast, by Application 2019 & 2032
- Table 49: South Korea Mobile Collaboration Market Revenue (Million) Forecast, by Application 2019 & 2032
- Table 50: South Korea Mobile Collaboration Market Volume (K Unit) Forecast, by Application 2019 & 2032
- Table 51: Southeast Asia Mobile Collaboration Market Revenue (Million) Forecast, by Application 2019 & 2032
- Table 52: Southeast Asia Mobile Collaboration Market Volume (K Unit) Forecast, by Application 2019 & 2032
- Table 53: Australia Mobile Collaboration Market Revenue (Million) Forecast, by Application 2019 & 2032
- Table 54: Australia Mobile Collaboration Market Volume (K Unit) Forecast, by Application 2019 & 2032
- Table 55: Indonesia Mobile Collaboration Market Revenue (Million) Forecast, by Application 2019 & 2032
- Table 56: Indonesia Mobile Collaboration Market Volume (K Unit) Forecast, by Application 2019 & 2032
- Table 57: Phillipes Mobile Collaboration Market Revenue (Million) Forecast, by Application 2019 & 2032
- Table 58: Phillipes Mobile Collaboration Market Volume (K Unit) Forecast, by Application 2019 & 2032
- Table 59: Singapore Mobile Collaboration Market Revenue (Million) Forecast, by Application 2019 & 2032
- Table 60: Singapore Mobile Collaboration Market Volume (K Unit) Forecast, by Application 2019 & 2032
- Table 61: Thailandc Mobile Collaboration Market Revenue (Million) Forecast, by Application 2019 & 2032
- Table 62: Thailandc Mobile Collaboration Market Volume (K Unit) Forecast, by Application 2019 & 2032
- Table 63: Rest of Asia Pacific Mobile Collaboration Market Revenue (Million) Forecast, by Application 2019 & 2032
- Table 64: Rest of Asia Pacific Mobile Collaboration Market Volume (K Unit) Forecast, by Application 2019 & 2032
- Table 65: Global Mobile Collaboration Market Revenue Million Forecast, by Country 2019 & 2032
- Table 66: Global Mobile Collaboration Market Volume K Unit Forecast, by Country 2019 & 2032
- Table 67: Brazil Mobile Collaboration Market Revenue (Million) Forecast, by Application 2019 & 2032
- Table 68: Brazil Mobile Collaboration Market Volume (K Unit) Forecast, by Application 2019 & 2032
- Table 69: Argentina Mobile Collaboration Market Revenue (Million) Forecast, by Application 2019 & 2032
- Table 70: Argentina Mobile Collaboration Market Volume (K Unit) Forecast, by Application 2019 & 2032
- Table 71: Peru Mobile Collaboration Market Revenue (Million) Forecast, by Application 2019 & 2032
- Table 72: Peru Mobile Collaboration Market Volume (K Unit) Forecast, by Application 2019 & 2032
- Table 73: Chile Mobile Collaboration Market Revenue (Million) Forecast, by Application 2019 & 2032
- Table 74: Chile Mobile Collaboration Market Volume (K Unit) Forecast, by Application 2019 & 2032
- Table 75: Colombia Mobile Collaboration Market Revenue (Million) Forecast, by Application 2019 & 2032
- Table 76: Colombia Mobile Collaboration Market Volume (K Unit) Forecast, by Application 2019 & 2032
- Table 77: Ecuador Mobile Collaboration Market Revenue (Million) Forecast, by Application 2019 & 2032
- Table 78: Ecuador Mobile Collaboration Market Volume (K Unit) Forecast, by Application 2019 & 2032
- Table 79: Venezuela Mobile Collaboration Market Revenue (Million) Forecast, by Application 2019 & 2032
- Table 80: Venezuela Mobile Collaboration Market Volume (K Unit) Forecast, by Application 2019 & 2032
- Table 81: Rest of South America Mobile Collaboration Market Revenue (Million) Forecast, by Application 2019 & 2032
- Table 82: Rest of South America Mobile Collaboration Market Volume (K Unit) Forecast, by Application 2019 & 2032
- Table 83: Global Mobile Collaboration Market Revenue Million Forecast, by Country 2019 & 2032
- Table 84: Global Mobile Collaboration Market Volume K Unit Forecast, by Country 2019 & 2032
- Table 85: United States Mobile Collaboration Market Revenue (Million) Forecast, by Application 2019 & 2032
- Table 86: United States Mobile Collaboration Market Volume (K Unit) Forecast, by Application 2019 & 2032
- Table 87: Canada Mobile Collaboration Market Revenue (Million) Forecast, by Application 2019 & 2032
- Table 88: Canada Mobile Collaboration Market Volume (K Unit) Forecast, by Application 2019 & 2032
- Table 89: Mexico Mobile Collaboration Market Revenue (Million) Forecast, by Application 2019 & 2032
- Table 90: Mexico Mobile Collaboration Market Volume (K Unit) Forecast, by Application 2019 & 2032
- Table 91: Global Mobile Collaboration Market Revenue Million Forecast, by Country 2019 & 2032
- Table 92: Global Mobile Collaboration Market Volume K Unit Forecast, by Country 2019 & 2032
- Table 93: United Arab Emirates Mobile Collaboration Market Revenue (Million) Forecast, by Application 2019 & 2032
- Table 94: United Arab Emirates Mobile Collaboration Market Volume (K Unit) Forecast, by Application 2019 & 2032
- Table 95: Saudi Arabia Mobile Collaboration Market Revenue (Million) Forecast, by Application 2019 & 2032
- Table 96: Saudi Arabia Mobile Collaboration Market Volume (K Unit) Forecast, by Application 2019 & 2032
- Table 97: South Africa Mobile Collaboration Market Revenue (Million) Forecast, by Application 2019 & 2032
- Table 98: South Africa Mobile Collaboration Market Volume (K Unit) Forecast, by Application 2019 & 2032
- Table 99: Rest of Middle East and Africa Mobile Collaboration Market Revenue (Million) Forecast, by Application 2019 & 2032
- Table 100: Rest of Middle East and Africa Mobile Collaboration Market Volume (K Unit) Forecast, by Application 2019 & 2032
- Table 101: Global Mobile Collaboration Market Revenue Million Forecast, by Solution 2019 & 2032
- Table 102: Global Mobile Collaboration Market Volume K Unit Forecast, by Solution 2019 & 2032
- Table 103: Global Mobile Collaboration Market Revenue Million Forecast, by Services 2019 & 2032
- Table 104: Global Mobile Collaboration Market Volume K Unit Forecast, by Services 2019 & 2032
- Table 105: Global Mobile Collaboration Market Revenue Million Forecast, by End-user Industry 2019 & 2032
- Table 106: Global Mobile Collaboration Market Volume K Unit Forecast, by End-user Industry 2019 & 2032
- Table 107: Global Mobile Collaboration Market Revenue Million Forecast, by Country 2019 & 2032
- Table 108: Global Mobile Collaboration Market Volume K Unit Forecast, by Country 2019 & 2032
- Table 109: Global Mobile Collaboration Market Revenue Million Forecast, by Solution 2019 & 2032
- Table 110: Global Mobile Collaboration Market Volume K Unit Forecast, by Solution 2019 & 2032
- Table 111: Global Mobile Collaboration Market Revenue Million Forecast, by Services 2019 & 2032
- Table 112: Global Mobile Collaboration Market Volume K Unit Forecast, by Services 2019 & 2032
- Table 113: Global Mobile Collaboration Market Revenue Million Forecast, by End-user Industry 2019 & 2032
- Table 114: Global Mobile Collaboration Market Volume K Unit Forecast, by End-user Industry 2019 & 2032
- Table 115: Global Mobile Collaboration Market Revenue Million Forecast, by Country 2019 & 2032
- Table 116: Global Mobile Collaboration Market Volume K Unit Forecast, by Country 2019 & 2032
- Table 117: Global Mobile Collaboration Market Revenue Million Forecast, by Solution 2019 & 2032
- Table 118: Global Mobile Collaboration Market Volume K Unit Forecast, by Solution 2019 & 2032
- Table 119: Global Mobile Collaboration Market Revenue Million Forecast, by Services 2019 & 2032
- Table 120: Global Mobile Collaboration Market Volume K Unit Forecast, by Services 2019 & 2032
- Table 121: Global Mobile Collaboration Market Revenue Million Forecast, by End-user Industry 2019 & 2032
- Table 122: Global Mobile Collaboration Market Volume K Unit Forecast, by End-user Industry 2019 & 2032
- Table 123: Global Mobile Collaboration Market Revenue Million Forecast, by Country 2019 & 2032
- Table 124: Global Mobile Collaboration Market Volume K Unit Forecast, by Country 2019 & 2032
- Table 125: Global Mobile Collaboration Market Revenue Million Forecast, by Solution 2019 & 2032
- Table 126: Global Mobile Collaboration Market Volume K Unit Forecast, by Solution 2019 & 2032
- Table 127: Global Mobile Collaboration Market Revenue Million Forecast, by Services 2019 & 2032
- Table 128: Global Mobile Collaboration Market Volume K Unit Forecast, by Services 2019 & 2032
- Table 129: Global Mobile Collaboration Market Revenue Million Forecast, by End-user Industry 2019 & 2032
- Table 130: Global Mobile Collaboration Market Volume K Unit Forecast, by End-user Industry 2019 & 2032
- Table 131: Global Mobile Collaboration Market Revenue Million Forecast, by Country 2019 & 2032
- Table 132: Global Mobile Collaboration Market Volume K Unit Forecast, by Country 2019 & 2032
- Table 133: Global Mobile Collaboration Market Revenue Million Forecast, by Solution 2019 & 2032
- Table 134: Global Mobile Collaboration Market Volume K Unit Forecast, by Solution 2019 & 2032
- Table 135: Global Mobile Collaboration Market Revenue Million Forecast, by Services 2019 & 2032
- Table 136: Global Mobile Collaboration Market Volume K Unit Forecast, by Services 2019 & 2032
- Table 137: Global Mobile Collaboration Market Revenue Million Forecast, by End-user Industry 2019 & 2032
- Table 138: Global Mobile Collaboration Market Volume K Unit Forecast, by End-user Industry 2019 & 2032
- Table 139: Global Mobile Collaboration Market Revenue Million Forecast, by Country 2019 & 2032
- Table 140: Global Mobile Collaboration Market Volume K Unit Forecast, by Country 2019 & 2032
Frequently Asked Questions
1. What is the projected Compound Annual Growth Rate (CAGR) of the Mobile Collaboration Market?
The projected CAGR is approximately 11.29%.
2. Which companies are prominent players in the Mobile Collaboration Market?
Key companies in the market include IBM Corporation, Cisco Systems Inc, Siemens AG, Microsoft Corporation, Avaya Inc, NEC Corporation, Oracle Corporation, Ribbon Communications LLC, Alcatel-Lucent SA.
3. What are the main segments of the Mobile Collaboration Market?
The market segments include Solution, Services, End-user Industry.
4. Can you provide details about the market size?
The market size is estimated to be USD 61.01 Million as of 2022.
5. What are some drivers contributing to market growth?
Increased Demand for BYOD Applications; Growing Smart Devices Sales.
6. What are the notable trends driving market growth?
Retail Segment is Expected to Witness High Growth.
7. Are there any restraints impacting market growth?
Security Concerns to Challenge the Market Growth.
8. Can you provide examples of recent developments in the market?
N/A
9. What pricing options are available for accessing the report?
Pricing options include single-user, multi-user, and enterprise licenses priced at USD 4750, USD 5250, and USD 8750 respectively.
10. Is the market size provided in terms of value or volume?
The market size is provided in terms of value, measured in Million and volume, measured in K Unit.
11. Are there any specific market keywords associated with the report?
Yes, the market keyword associated with the report is "Mobile Collaboration Market," which aids in identifying and referencing the specific market segment covered.
12. How do I determine which pricing option suits my needs best?
The pricing options vary based on user requirements and access needs. Individual users may opt for single-user licenses, while businesses requiring broader access may choose multi-user or enterprise licenses for cost-effective access to the report.
13. Are there any additional resources or data provided in the Mobile Collaboration Market report?
While the report offers comprehensive insights, it's advisable to review the specific contents or supplementary materials provided to ascertain if additional resources or data are available.
14. How can I stay updated on further developments or reports in the Mobile Collaboration Market?
To stay informed about further developments, trends, and reports in the Mobile Collaboration Market, consider subscribing to industry newsletters, following relevant companies and organizations, or regularly checking reputable industry news sources and publications.
Methodology
Step 1 - Identification of Relevant Samples Size from Population Database


Step 2 - Approaches for Defining Global Market Size (Value, Volume* & Price*)

Note*: In applicable scenarios
Step 3 - Data Sources
Primary Research
- Web Analytics
- Survey Reports
- Research Institute
- Latest Research Reports
- Opinion Leaders
Secondary Research
- Annual Reports
- White Paper
- Latest Press Release
- Industry Association
- Paid Database
- Investor Presentations

Step 4 - Data Triangulation
Involves using different sources of information in order to increase the validity of a study
These sources are likely to be stakeholders in a program - participants, other researchers, program staff, other community members, and so on.
Then we put all data in single framework & apply various statistical tools to find out the dynamic on the market.
During the analysis stage, feedback from the stakeholder groups would be compared to determine areas of agreement as well as areas of divergence
