

Key Insights
The Middle East and Africa (MEA) optical imaging market is experiencing robust growth, projected to reach a significant market size by 2033, driven by a compound annual growth rate (CAGR) of 7.20%. This expansion is fueled by several key factors. Firstly, the increasing prevalence of chronic diseases like cancer, cardiovascular diseases, and ophthalmological conditions across the region is driving demand for advanced diagnostic tools offering superior image quality and precision. Secondly, substantial investments in healthcare infrastructure development, particularly in countries like Saudi Arabia and the UAE, are creating a favorable environment for technology adoption. Furthermore, the rising awareness among healthcare professionals and patients regarding the benefits of minimally invasive procedures facilitated by optical imaging is boosting market growth. Technological advancements, such as improvements in optical coherence tomography (OCT) and photoacoustic tomography (PAT) for enhanced resolution and speed, are further propelling market expansion. However, challenges like high equipment costs, limited skilled professionals in certain regions, and uneven healthcare infrastructure development across the MEA region represent potential restraints to the market’s full potential.
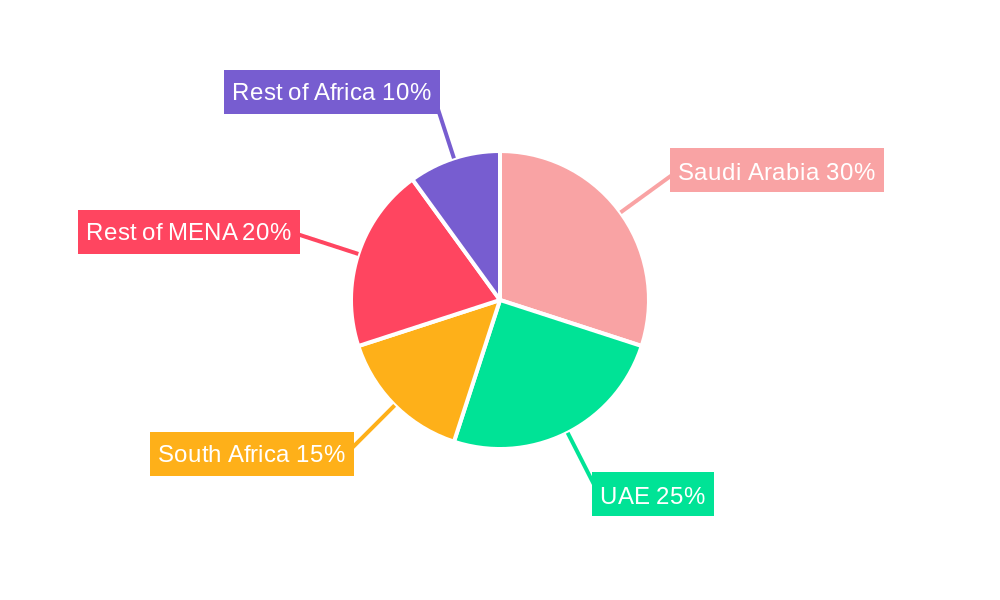
Significant market segmentation exists within the MEA optical imaging industry. While countries like Saudi Arabia and the UAE are leading the market due to their advanced healthcare infrastructure and economic strength, other nations in the MENA region and South Africa exhibit strong growth potential. The market is also diversified by technology (with OCT and PAT leading), product (imaging systems and software holding significant share), application area (ophthalmology and oncology being dominant), and end-user industry (hospitals and research labs driving demand). Key players like Canon, Carl Zeiss Meditec, and Heidelberg Engineering are actively shaping market dynamics through continuous innovation and strategic partnerships. Focusing on addressing the existing restraints and capitalizing on the strong underlying drivers, the MEA optical imaging market is poised for substantial growth over the forecast period. Specific market segmentation data will provide a more granular view of opportunities within various segments. The future of this market is bright, especially in emerging economies within the region where infrastructure investment and access to innovative technology are increasing.
Middle East & Africa Optical Imaging Market Report: 2019-2033
Dive into the comprehensive analysis of the burgeoning Middle East and Africa Optical Imaging market, projected to reach xx Million by 2033. This in-depth report provides a granular view of the industry's dynamics, key players, and future growth trajectory, offering actionable insights for stakeholders across the value chain. The study covers the period 2019-2033, with 2025 as the base year.
Middle-East and Africa Optical Imaging Industry Market Dynamics & Concentration
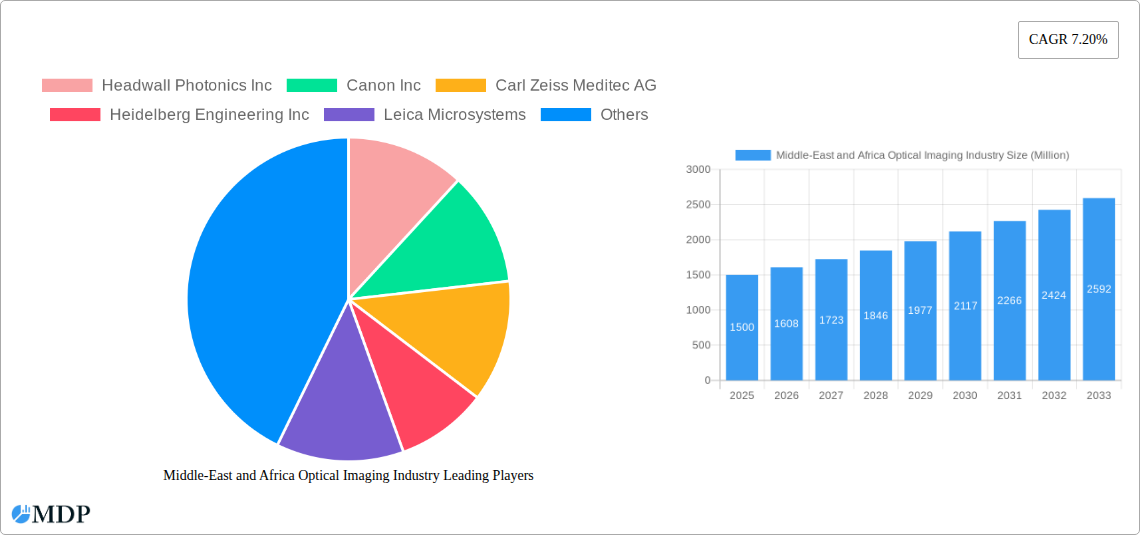
The Middle East and Africa optical imaging market exhibits a moderately concentrated landscape, with key players like Canon Inc, Carl Zeiss Meditec AG, and Heidelberg Engineering Inc holding significant market share. However, the market is witnessing increased competition from smaller, specialized companies offering innovative solutions. Market concentration is further influenced by factors such as regulatory approvals, technological advancements, and the prevalence of various imaging modalities across different healthcare segments.
The market is driven by continuous innovation in imaging technologies, particularly in areas like Optical Coherence Tomography (OCT) and Photoacoustic Tomography (PAT). Stringent regulatory frameworks governing medical device approvals and data privacy influence market access and adoption rates. The presence of substitute technologies, such as conventional imaging techniques, also impacts market growth. End-user trends, such as increasing adoption of minimally invasive procedures and a growing preference for advanced diagnostic tools, are shaping market demand. The industry has seen a moderate number of M&A activities (xx deals in the past five years), primarily driven by companies seeking to expand their product portfolios and geographical reach. The estimated market share of the top three players is approximately xx%.
Middle-East and Africa Optical Imaging Industry Industry Trends & Analysis
The Middle East and Africa optical imaging market is experiencing robust growth, driven by factors such as increasing prevalence of chronic diseases, rising healthcare expenditure, and improving healthcare infrastructure. Technological advancements, particularly in areas like artificial intelligence (AI) and machine learning (ML), are enabling the development of more accurate and efficient imaging systems. Consumer preferences are shifting towards non-invasive and minimally invasive diagnostic procedures, boosting the demand for optical imaging technologies. The market is characterized by intense competition, with both established players and emerging companies vying for market share. The compound annual growth rate (CAGR) during the forecast period (2025-2033) is estimated at xx%, with market penetration expected to reach xx% by 2033. This growth trajectory is influenced by factors such as government initiatives to improve healthcare access, increasing investment in medical research, and the growing adoption of telemedicine.
Leading Markets & Segments in Middle-East and Africa Optical Imaging Industry
Dominant Regions/Countries: Saudi Arabia and the United Arab Emirates lead the MEA optical imaging market due to high healthcare expenditure, advanced healthcare infrastructure, and a growing prevalence of chronic diseases. South Africa holds a significant market share within Africa.
Dominant Technologies: Optical Coherence Tomography (OCT) dominates the technology segment due to its wide applications in ophthalmology and cardiology. Hyperspectral imaging and near-infrared spectroscopy are witnessing significant growth driven by their use in oncology and dermatology.
Dominant Products: Imaging systems represent the largest product segment, followed by optical imaging software.
Dominant Application Areas: Ophthalmology, Oncology and Cardiology are major application areas driving market growth.
Key Drivers for Leading Segments:
- Saudi Arabia & UAE: Significant investments in healthcare infrastructure, government initiatives to improve healthcare access, and a growing private healthcare sector.
- Ophthalmology: Increasing prevalence of age-related eye diseases, rising awareness about eye health, and technological advancements in ophthalmic imaging.
- Oncology: Growing incidence of cancer, the need for early and accurate diagnosis, and advancements in cancer detection techniques using optical imaging.
- OCT Technology: High accuracy, non-invasive nature, and wide range of clinical applications.
Middle-East and Africa Optical Imaging Industry Product Developments
Recent product innovations focus on enhancing image quality, improving speed and efficiency, and integrating AI for automated analysis. Miniaturization of devices for easier portability and use in diverse settings is also a key trend. The market sees competition focused on offering superior image resolution, faster processing speeds, and user-friendly interfaces. The integration of advanced software algorithms for image analysis is driving the development of sophisticated solutions.
Key Drivers of Middle-East and Africa Optical Imaging Industry Growth
Technological advancements, particularly in areas like AI-powered image analysis and miniaturized devices, are major growth drivers. Increasing healthcare spending in the region and a growing number of hospitals and clinics are also contributing to market expansion. Government initiatives aimed at improving healthcare infrastructure and access are further stimulating growth.
Challenges in the Middle-East and Africa Optical Imaging Industry Market
High costs associated with advanced imaging systems pose a challenge, limiting accessibility in some regions. Regulatory complexities and varying reimbursement policies across different countries can create barriers to market entry. The market also faces competition from established players and the emergence of new technologies. The shortage of skilled professionals capable of operating and interpreting advanced imaging systems is another significant challenge.
Emerging Opportunities in Middle-East and Africa Optical Imaging Industry
The market presents significant opportunities for players focusing on developing cost-effective and portable optical imaging systems for use in remote or underserved areas. Strategic collaborations between technology providers and healthcare institutions can facilitate market penetration. Growth is further fueled by expansion into new application areas, such as dermatology and neurology, and the integration of AI and ML in optical imaging systems.
Leading Players in the Middle-East and Africa Optical Imaging Industry Sector
- Headwall Photonics Inc
- Canon Inc
- Carl Zeiss Meditec AG
- Heidelberg Engineering Inc
- Leica Microsystems
- Cytoviva Inc
- Topcon Corporation
- Optovue Inc
- Bioptigen Inc
- Abbott Laboratories
- Perkinelmer Inc
- ChemImage Corporation
Key Milestones in Middle-East and Africa Optical Imaging Industry Industry
- November 2021: MedX Health Corp. and Al Zahrawi Medical Supplies LLC signed a Memorandum of Understanding for DermSecure in the UAE.
- October 2021: The Barraquer Clinic opened in Dubai, introducing advanced ophthalmology technology.
Strategic Outlook for Middle-East and Africa Optical Imaging Industry Market
The Middle East and Africa optical imaging market holds significant long-term growth potential driven by technological innovations, increasing healthcare spending, and a rising prevalence of chronic diseases. Strategic partnerships, market expansion into underserved areas, and the development of user-friendly and cost-effective solutions will be crucial for success in this dynamic market. Companies focusing on AI integration and advanced data analytics will gain a competitive edge.
Middle-East and Africa Optical Imaging Industry Segmentation
-
1. Technology
- 1.1. Photoacoustic Tomography
- 1.2. Optical Coherence Tomography
- 1.3. Hyperspectral Imaging
- 1.4. Near-Infrared Spectroscopy
- 1.5. Other Technologies
-
2. Product
- 2.1. Imaging Systems
- 2.2. Illumination Systems
- 2.3. Optical Imaging Software
- 2.4. Cameras
- 2.5. Other Products
-
3. Application Area
- 3.1. Ophthalmology
- 3.2. Oncology
- 3.3. Cardiology
- 3.4. Dermatology
- 3.5. Neurology
- 3.6. Other Application Areas
-
4. Application
- 4.1. Pathological Imaging
- 4.2. Intraoperative Imaging
-
5. End-user Industry
- 5.1. Hospitals and Clinics
- 5.2. Research and Diagnostic Laboratories
- 5.3. Pharmaceutical Industry
- 5.4. Biotechnology Companies
- 5.5. Other End-user Industries
Middle-East and Africa Optical Imaging Industry Segmentation By Geography
-
1. Middle East
- 1.1. Saudi Arabia
- 1.2. United Arab Emirates
- 1.3. Israel
- 1.4. Qatar
- 1.5. Kuwait
- 1.6. Oman
- 1.7. Bahrain
- 1.8. Jordan
- 1.9. Lebanon
Middle-East and Africa Optical Imaging Industry REPORT HIGHLIGHTS
| Aspects | Details |
|---|---|
| Study Period | 2019-2033 |
| Base Year | 2024 |
| Estimated Year | 2025 |
| Forecast Period | 2025-2033 |
| Historical Period | 2019-2024 |
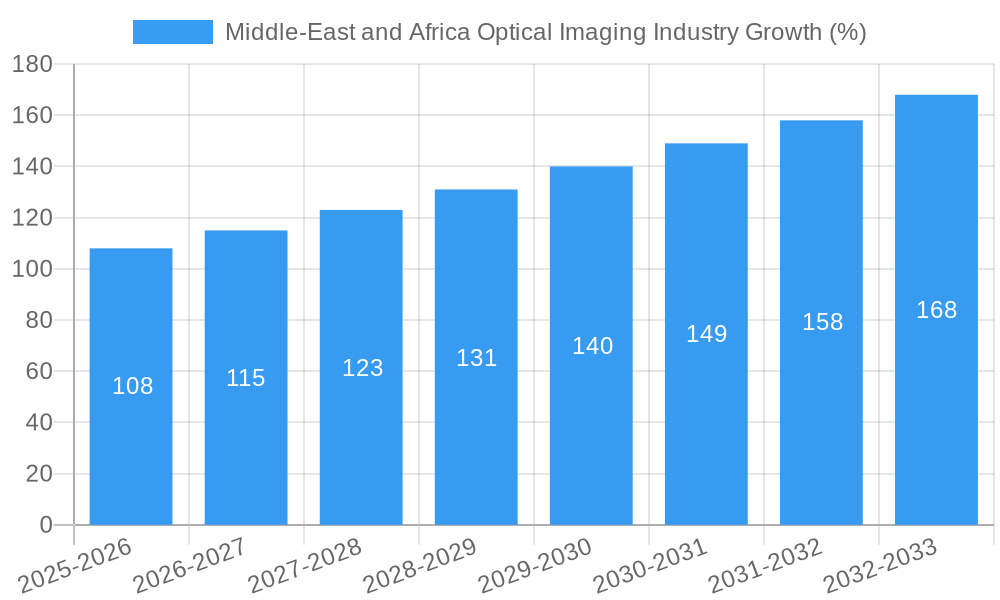
| Growth Rate | CAGR of 7.20% from 2019-2033 |
| Segmentation |
|
Table of Contents
- 1. Introduction
- 1.1. Research Scope
- 1.2. Market Segmentation
- 1.3. Research Methodology
- 1.4. Definitions and Assumptions
- 2. Executive Summary
- 2.1. Introduction
- 3. Market Dynamics
- 3.1. Introduction
- 3.2. Market Drivers
- 3.2.1. Increasing Eye diseases such as dry eyes in MENA region; High Demand from Professional Services in Healthcare
- 3.3. Market Restrains
- 3.3.1. Competition from Other Substitutes
- 3.4. Market Trends
- 3.4.1. Ophthalmology to Show Significant Growth
- 4. Market Factor Analysis
- 4.1. Porters Five Forces
- 4.2. Supply/Value Chain
- 4.3. PESTEL analysis
- 4.4. Market Entropy
- 4.5. Patent/Trademark Analysis
- 5. Middle-East and Africa Optical Imaging Industry Analysis, Insights and Forecast, 2019-2031
- 5.1. Market Analysis, Insights and Forecast - by Technology
- 5.1.1. Photoacoustic Tomography
- 5.1.2. Optical Coherence Tomography
- 5.1.3. Hyperspectral Imaging
- 5.1.4. Near-Infrared Spectroscopy
- 5.1.5. Other Technologies
- 5.2. Market Analysis, Insights and Forecast - by Product
- 5.2.1. Imaging Systems
- 5.2.2. Illumination Systems
- 5.2.3. Optical Imaging Software
- 5.2.4. Cameras
- 5.2.5. Other Products
- 5.3. Market Analysis, Insights and Forecast - by Application Area
- 5.3.1. Ophthalmology
- 5.3.2. Oncology
- 5.3.3. Cardiology
- 5.3.4. Dermatology
- 5.3.5. Neurology
- 5.3.6. Other Application Areas
- 5.4. Market Analysis, Insights and Forecast - by Application
- 5.4.1. Pathological Imaging
- 5.4.2. Intraoperative Imaging
- 5.5. Market Analysis, Insights and Forecast - by End-user Industry
- 5.5.1. Hospitals and Clinics
- 5.5.2. Research and Diagnostic Laboratories
- 5.5.3. Pharmaceutical Industry
- 5.5.4. Biotechnology Companies
- 5.5.5. Other End-user Industries
- 5.6. Market Analysis, Insights and Forecast - by Region
- 5.6.1. Middle East
- 5.1. Market Analysis, Insights and Forecast - by Technology
- 6. South Africa Middle-East and Africa Optical Imaging Industry Analysis, Insights and Forecast, 2019-2031
- 7. Sudan Middle-East and Africa Optical Imaging Industry Analysis, Insights and Forecast, 2019-2031
- 8. Uganda Middle-East and Africa Optical Imaging Industry Analysis, Insights and Forecast, 2019-2031
- 9. Tanzania Middle-East and Africa Optical Imaging Industry Analysis, Insights and Forecast, 2019-2031
- 10. Kenya Middle-East and Africa Optical Imaging Industry Analysis, Insights and Forecast, 2019-2031
- 11. Rest of Africa Middle-East and Africa Optical Imaging Industry Analysis, Insights and Forecast, 2019-2031
- 12. Competitive Analysis
- 12.1. Market Share Analysis 2024
- 12.2. Company Profiles
- 12.2.1 Headwall Photonics Inc
- 12.2.1.1. Overview
- 12.2.1.2. Products
- 12.2.1.3. SWOT Analysis
- 12.2.1.4. Recent Developments
- 12.2.1.5. Financials (Based on Availability)
- 12.2.2 Canon Inc
- 12.2.2.1. Overview
- 12.2.2.2. Products
- 12.2.2.3. SWOT Analysis
- 12.2.2.4. Recent Developments
- 12.2.2.5. Financials (Based on Availability)
- 12.2.3 Carl Zeiss Meditec AG
- 12.2.3.1. Overview
- 12.2.3.2. Products
- 12.2.3.3. SWOT Analysis
- 12.2.3.4. Recent Developments
- 12.2.3.5. Financials (Based on Availability)
- 12.2.4 Heidelberg Engineering Inc
- 12.2.4.1. Overview
- 12.2.4.2. Products
- 12.2.4.3. SWOT Analysis
- 12.2.4.4. Recent Developments
- 12.2.4.5. Financials (Based on Availability)
- 12.2.5 Leica Microsystems
- 12.2.5.1. Overview
- 12.2.5.2. Products
- 12.2.5.3. SWOT Analysis
- 12.2.5.4. Recent Developments
- 12.2.5.5. Financials (Based on Availability)
- 12.2.6 Cytoviva Inc
- 12.2.6.1. Overview
- 12.2.6.2. Products
- 12.2.6.3. SWOT Analysis
- 12.2.6.4. Recent Developments
- 12.2.6.5. Financials (Based on Availability)
- 12.2.7 Topcon Corporation
- 12.2.7.1. Overview
- 12.2.7.2. Products
- 12.2.7.3. SWOT Analysis
- 12.2.7.4. Recent Developments
- 12.2.7.5. Financials (Based on Availability)
- 12.2.8 Optovue Inc
- 12.2.8.1. Overview
- 12.2.8.2. Products
- 12.2.8.3. SWOT Analysis
- 12.2.8.4. Recent Developments
- 12.2.8.5. Financials (Based on Availability)
- 12.2.9 Bioptigen Inc
- 12.2.9.1. Overview
- 12.2.9.2. Products
- 12.2.9.3. SWOT Analysis
- 12.2.9.4. Recent Developments
- 12.2.9.5. Financials (Based on Availability)
- 12.2.10 Abbott Laboratories
- 12.2.10.1. Overview
- 12.2.10.2. Products
- 12.2.10.3. SWOT Analysis
- 12.2.10.4. Recent Developments
- 12.2.10.5. Financials (Based on Availability)
- 12.2.11 Perkinelmer Inc
- 12.2.11.1. Overview
- 12.2.11.2. Products
- 12.2.11.3. SWOT Analysis
- 12.2.11.4. Recent Developments
- 12.2.11.5. Financials (Based on Availability)
- 12.2.12 ChemImage Corporation
- 12.2.12.1. Overview
- 12.2.12.2. Products
- 12.2.12.3. SWOT Analysis
- 12.2.12.4. Recent Developments
- 12.2.12.5. Financials (Based on Availability)
- 12.2.1 Headwall Photonics Inc
List of Figures
- Figure 1: Middle-East and Africa Optical Imaging Industry Revenue Breakdown (Million, %) by Product 2024 & 2032
- Figure 2: Middle-East and Africa Optical Imaging Industry Share (%) by Company 2024
List of Tables
- Table 1: Middle-East and Africa Optical Imaging Industry Revenue Million Forecast, by Region 2019 & 2032
- Table 2: Middle-East and Africa Optical Imaging Industry Volume K Unit Forecast, by Region 2019 & 2032
- Table 3: Middle-East and Africa Optical Imaging Industry Revenue Million Forecast, by Technology 2019 & 2032
- Table 4: Middle-East and Africa Optical Imaging Industry Volume K Unit Forecast, by Technology 2019 & 2032
- Table 5: Middle-East and Africa Optical Imaging Industry Revenue Million Forecast, by Product 2019 & 2032
- Table 6: Middle-East and Africa Optical Imaging Industry Volume K Unit Forecast, by Product 2019 & 2032
- Table 7: Middle-East and Africa Optical Imaging Industry Revenue Million Forecast, by Application Area 2019 & 2032
- Table 8: Middle-East and Africa Optical Imaging Industry Volume K Unit Forecast, by Application Area 2019 & 2032
- Table 9: Middle-East and Africa Optical Imaging Industry Revenue Million Forecast, by Application 2019 & 2032
- Table 10: Middle-East and Africa Optical Imaging Industry Volume K Unit Forecast, by Application 2019 & 2032
- Table 11: Middle-East and Africa Optical Imaging Industry Revenue Million Forecast, by End-user Industry 2019 & 2032
- Table 12: Middle-East and Africa Optical Imaging Industry Volume K Unit Forecast, by End-user Industry 2019 & 2032
- Table 13: Middle-East and Africa Optical Imaging Industry Revenue Million Forecast, by Region 2019 & 2032
- Table 14: Middle-East and Africa Optical Imaging Industry Volume K Unit Forecast, by Region 2019 & 2032
- Table 15: Middle-East and Africa Optical Imaging Industry Revenue Million Forecast, by Country 2019 & 2032
- Table 16: Middle-East and Africa Optical Imaging Industry Volume K Unit Forecast, by Country 2019 & 2032
- Table 17: South Africa Middle-East and Africa Optical Imaging Industry Revenue (Million) Forecast, by Application 2019 & 2032
- Table 18: South Africa Middle-East and Africa Optical Imaging Industry Volume (K Unit) Forecast, by Application 2019 & 2032
- Table 19: Sudan Middle-East and Africa Optical Imaging Industry Revenue (Million) Forecast, by Application 2019 & 2032
- Table 20: Sudan Middle-East and Africa Optical Imaging Industry Volume (K Unit) Forecast, by Application 2019 & 2032
- Table 21: Uganda Middle-East and Africa Optical Imaging Industry Revenue (Million) Forecast, by Application 2019 & 2032
- Table 22: Uganda Middle-East and Africa Optical Imaging Industry Volume (K Unit) Forecast, by Application 2019 & 2032
- Table 23: Tanzania Middle-East and Africa Optical Imaging Industry Revenue (Million) Forecast, by Application 2019 & 2032
- Table 24: Tanzania Middle-East and Africa Optical Imaging Industry Volume (K Unit) Forecast, by Application 2019 & 2032
- Table 25: Kenya Middle-East and Africa Optical Imaging Industry Revenue (Million) Forecast, by Application 2019 & 2032
- Table 26: Kenya Middle-East and Africa Optical Imaging Industry Volume (K Unit) Forecast, by Application 2019 & 2032
- Table 27: Rest of Africa Middle-East and Africa Optical Imaging Industry Revenue (Million) Forecast, by Application 2019 & 2032
- Table 28: Rest of Africa Middle-East and Africa Optical Imaging Industry Volume (K Unit) Forecast, by Application 2019 & 2032
- Table 29: Middle-East and Africa Optical Imaging Industry Revenue Million Forecast, by Technology 2019 & 2032
- Table 30: Middle-East and Africa Optical Imaging Industry Volume K Unit Forecast, by Technology 2019 & 2032
- Table 31: Middle-East and Africa Optical Imaging Industry Revenue Million Forecast, by Product 2019 & 2032
- Table 32: Middle-East and Africa Optical Imaging Industry Volume K Unit Forecast, by Product 2019 & 2032
- Table 33: Middle-East and Africa Optical Imaging Industry Revenue Million Forecast, by Application Area 2019 & 2032
- Table 34: Middle-East and Africa Optical Imaging Industry Volume K Unit Forecast, by Application Area 2019 & 2032
- Table 35: Middle-East and Africa Optical Imaging Industry Revenue Million Forecast, by Application 2019 & 2032
- Table 36: Middle-East and Africa Optical Imaging Industry Volume K Unit Forecast, by Application 2019 & 2032
- Table 37: Middle-East and Africa Optical Imaging Industry Revenue Million Forecast, by End-user Industry 2019 & 2032
- Table 38: Middle-East and Africa Optical Imaging Industry Volume K Unit Forecast, by End-user Industry 2019 & 2032
- Table 39: Middle-East and Africa Optical Imaging Industry Revenue Million Forecast, by Country 2019 & 2032
- Table 40: Middle-East and Africa Optical Imaging Industry Volume K Unit Forecast, by Country 2019 & 2032
- Table 41: Saudi Arabia Middle-East and Africa Optical Imaging Industry Revenue (Million) Forecast, by Application 2019 & 2032
- Table 42: Saudi Arabia Middle-East and Africa Optical Imaging Industry Volume (K Unit) Forecast, by Application 2019 & 2032
- Table 43: United Arab Emirates Middle-East and Africa Optical Imaging Industry Revenue (Million) Forecast, by Application 2019 & 2032
- Table 44: United Arab Emirates Middle-East and Africa Optical Imaging Industry Volume (K Unit) Forecast, by Application 2019 & 2032
- Table 45: Israel Middle-East and Africa Optical Imaging Industry Revenue (Million) Forecast, by Application 2019 & 2032
- Table 46: Israel Middle-East and Africa Optical Imaging Industry Volume (K Unit) Forecast, by Application 2019 & 2032
- Table 47: Qatar Middle-East and Africa Optical Imaging Industry Revenue (Million) Forecast, by Application 2019 & 2032
- Table 48: Qatar Middle-East and Africa Optical Imaging Industry Volume (K Unit) Forecast, by Application 2019 & 2032
- Table 49: Kuwait Middle-East and Africa Optical Imaging Industry Revenue (Million) Forecast, by Application 2019 & 2032
- Table 50: Kuwait Middle-East and Africa Optical Imaging Industry Volume (K Unit) Forecast, by Application 2019 & 2032
- Table 51: Oman Middle-East and Africa Optical Imaging Industry Revenue (Million) Forecast, by Application 2019 & 2032
- Table 52: Oman Middle-East and Africa Optical Imaging Industry Volume (K Unit) Forecast, by Application 2019 & 2032
- Table 53: Bahrain Middle-East and Africa Optical Imaging Industry Revenue (Million) Forecast, by Application 2019 & 2032
- Table 54: Bahrain Middle-East and Africa Optical Imaging Industry Volume (K Unit) Forecast, by Application 2019 & 2032
- Table 55: Jordan Middle-East and Africa Optical Imaging Industry Revenue (Million) Forecast, by Application 2019 & 2032
- Table 56: Jordan Middle-East and Africa Optical Imaging Industry Volume (K Unit) Forecast, by Application 2019 & 2032
- Table 57: Lebanon Middle-East and Africa Optical Imaging Industry Revenue (Million) Forecast, by Application 2019 & 2032
- Table 58: Lebanon Middle-East and Africa Optical Imaging Industry Volume (K Unit) Forecast, by Application 2019 & 2032
Frequently Asked Questions
1. What is the projected Compound Annual Growth Rate (CAGR) of the Middle-East and Africa Optical Imaging Industry?
The projected CAGR is approximately 7.20%.
2. Which companies are prominent players in the Middle-East and Africa Optical Imaging Industry?
Key companies in the market include Headwall Photonics Inc, Canon Inc, Carl Zeiss Meditec AG, Heidelberg Engineering Inc, Leica Microsystems, Cytoviva Inc, Topcon Corporation, Optovue Inc, Bioptigen Inc, Abbott Laboratories, Perkinelmer Inc, ChemImage Corporation.
3. What are the main segments of the Middle-East and Africa Optical Imaging Industry?
The market segments include Technology, Product, Application Area, Application, End-user Industry.
4. Can you provide details about the market size?
The market size is estimated to be USD XX Million as of 2022.
5. What are some drivers contributing to market growth?
Increasing Eye diseases such as dry eyes in MENA region; High Demand from Professional Services in Healthcare.
6. What are the notable trends driving market growth?
Ophthalmology to Show Significant Growth.
7. Are there any restraints impacting market growth?
Competition from Other Substitutes.
8. Can you provide examples of recent developments in the market?
November 2021 - MedX Health Corp. and Al Zahrawi Medical Supplies LLC signed a Memorandum of Understanding between the companies on a two-phase commercialization pilot and distribution agreement for MedX's leading-edge DermSecure Screening Platform at select United Arab Emirates oncology and dermatology clinics beginning this month.
9. What pricing options are available for accessing the report?
Pricing options include single-user, multi-user, and enterprise licenses priced at USD 4750, USD 4950, and USD 6800 respectively.
10. Is the market size provided in terms of value or volume?
The market size is provided in terms of value, measured in Million and volume, measured in K Unit.
11. Are there any specific market keywords associated with the report?
Yes, the market keyword associated with the report is "Middle-East and Africa Optical Imaging Industry," which aids in identifying and referencing the specific market segment covered.
12. How do I determine which pricing option suits my needs best?
The pricing options vary based on user requirements and access needs. Individual users may opt for single-user licenses, while businesses requiring broader access may choose multi-user or enterprise licenses for cost-effective access to the report.
13. Are there any additional resources or data provided in the Middle-East and Africa Optical Imaging Industry report?
While the report offers comprehensive insights, it's advisable to review the specific contents or supplementary materials provided to ascertain if additional resources or data are available.
14. How can I stay updated on further developments or reports in the Middle-East and Africa Optical Imaging Industry?
To stay informed about further developments, trends, and reports in the Middle-East and Africa Optical Imaging Industry, consider subscribing to industry newsletters, following relevant companies and organizations, or regularly checking reputable industry news sources and publications.
Methodology
Step 1 - Identification of Relevant Samples Size from Population Database


Step 2 - Approaches for Defining Global Market Size (Value, Volume* & Price*)

Note*: In applicable scenarios
Step 3 - Data Sources
Primary Research
- Web Analytics
- Survey Reports
- Research Institute
- Latest Research Reports
- Opinion Leaders
Secondary Research
- Annual Reports
- White Paper
- Latest Press Release
- Industry Association
- Paid Database
- Investor Presentations

Step 4 - Data Triangulation
Involves using different sources of information in order to increase the validity of a study
These sources are likely to be stakeholders in a program - participants, other researchers, program staff, other community members, and so on.
Then we put all data in single framework & apply various statistical tools to find out the dynamic on the market.
During the analysis stage, feedback from the stakeholder groups would be compared to determine areas of agreement as well as areas of divergence
