

Key Insights
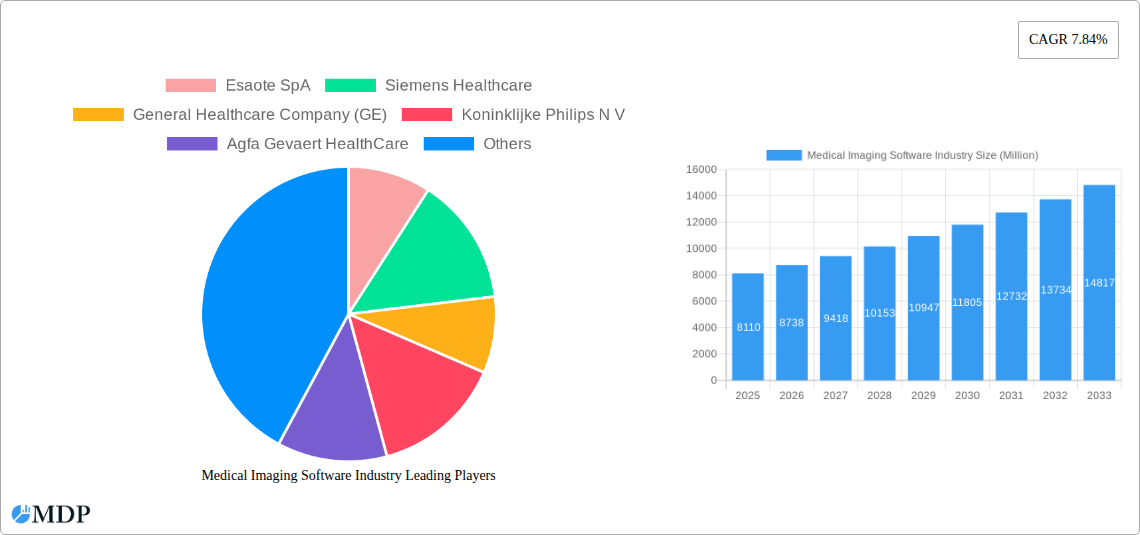
The global medical imaging software market, valued at $8.11 billion in 2025, is projected to experience robust growth, driven by a Compound Annual Growth Rate (CAGR) of 7.84% from 2025 to 2033. This expansion is fueled by several key factors. The increasing prevalence of chronic diseases necessitates more sophisticated diagnostic tools, leading to higher demand for advanced medical imaging software solutions. Technological advancements, such as the development of artificial intelligence (AI)-powered image analysis and improved 3D/4D imaging capabilities, are enhancing diagnostic accuracy and efficiency, further stimulating market growth. Furthermore, the rising adoption of telehealth and remote patient monitoring is creating opportunities for cloud-based medical imaging software, allowing for improved access to care, particularly in remote areas. The market is segmented by imaging type (2D, 3D, 4D) and application (dental, orthopedic, cardiology, obstetrics/gynecology, mammography, urology/nephrology, and others), with 3D and 4D imaging and AI-powered applications experiencing particularly rapid growth due to their enhanced diagnostic capabilities. Major players like Esaote, Siemens, GE Healthcare, Philips, and Agfa are actively investing in R&D and strategic partnerships to maintain their competitive edge.
Regional growth varies, with North America currently holding a significant market share due to advanced healthcare infrastructure and high adoption rates of new technologies. However, Asia-Pacific is expected to witness substantial growth in the coming years, driven by increasing healthcare expenditure and rising awareness of advanced diagnostic techniques. The market also faces challenges, including high implementation costs, data security concerns related to patient information, and the need for regulatory compliance. Nevertheless, the ongoing technological advancements and the increasing demand for efficient and accurate medical diagnostics are expected to outweigh these restraints, ensuring continued growth of the medical imaging software market throughout the forecast period.
Medical Imaging Software Industry Market Report: 2019-2033
This comprehensive report provides a detailed analysis of the Medical Imaging Software market, offering invaluable insights for stakeholders, investors, and industry professionals. With a study period spanning 2019-2033, a base year of 2025, and a forecast period of 2025-2033, this report leverages historical data (2019-2024) to project future market trends and opportunities. The report covers key market segments, leading players like Esaote SpA, Siemens Healthcare, GE Healthcare, and more, and examines crucial industry developments shaping the future of medical imaging. The market is expected to reach xx Million by 2033, exhibiting a CAGR of xx% during the forecast period.
Medical Imaging Software Industry Market Dynamics & Concentration
The medical imaging software market is characterized by a moderately concentrated landscape, with a few major players holding significant market share. However, the market is also dynamic, with ongoing innovation, strategic partnerships, and mergers & acquisitions (M&A) activities shaping the competitive dynamics. The market share of the top 5 players is estimated at xx%, indicating a level of consolidation. However, the emergence of specialized niche players and innovative startups is also contributing to increased competition. Regulatory frameworks, particularly those related to data privacy and security (e.g., HIPAA, GDPR), play a crucial role in shaping market practices. The increasing adoption of cloud-based solutions and the rise of AI-powered diagnostic tools are significant innovation drivers. Substitute products are limited, with the core value proposition of medical imaging software remaining essential for accurate diagnosis and treatment planning. End-user trends favor integrated, user-friendly solutions that streamline workflows and enhance diagnostic capabilities. M&A activity in the sector has been robust in recent years, with xx major deals recorded between 2019 and 2024. This activity reflects the strategic importance of technology acquisitions and the consolidation efforts of established players.
- Market Concentration: Top 5 players hold xx% market share (Estimated 2025).
- M&A Activity: xx major deals recorded between 2019 and 2024.
- Innovation Drivers: AI-powered diagnostics, cloud-based solutions, and improved user interfaces.
- Regulatory Landscape: HIPAA, GDPR, and other relevant regulations significantly impact market operations.
Medical Imaging Software Industry Industry Trends & Analysis
The medical imaging software market is experiencing robust growth, driven by several key factors. The increasing prevalence of chronic diseases, the rising geriatric population, technological advancements leading to improved image quality and diagnostic capabilities, and the expanding adoption of minimally invasive procedures are all contributing to market expansion. The market is witnessing significant technological disruptions, with the integration of artificial intelligence (AI) and machine learning (ML) enhancing diagnostic accuracy and workflow efficiency. Consumer preferences are shifting toward user-friendly, integrated systems that provide seamless data sharing and analysis capabilities. The competitive landscape is characterized by both intense rivalry among established players and the emergence of innovative startups offering specialized solutions. This dynamic competition drives innovation and accelerates the adoption of new technologies.

Leading Markets & Segments in Medical Imaging Software Industry
The North American region currently dominates the medical imaging software market, driven by factors such as high healthcare expenditure, advanced healthcare infrastructure, and a robust regulatory framework encouraging technological adoption. Within the segments, Cardiology Applications currently holds the largest market share, due to the high prevalence of cardiovascular diseases and the significant role imaging plays in diagnosis and treatment.
- Dominant Region: North America
- Dominant Segment (Application): Cardiology Applications
- Key Drivers (North America): High healthcare expenditure, advanced infrastructure, strong regulatory framework.
- Key Drivers (Cardiology Applications): High prevalence of cardiovascular diseases, crucial role of imaging in diagnosis and treatment.
By Imaging Type:
- 2D Imaging remains prevalent due to its established role and cost-effectiveness. However, 3D and 4D Imaging are rapidly gaining traction due to improved diagnostic capabilities and visualization.
- 3D Imaging is rapidly growing due to the need for more detailed and accurate imaging in surgical planning and disease management.
- 4D Imaging is a relatively new segment experiencing growth, promising to provide more dynamic and comprehensive imaging data in the future.
By Application:
- Cardiology applications, followed by orthopedics and mammography, are currently leading applications. Each application area is demonstrating a strong growth trajectory.
Medical Imaging Software Industry Product Developments
Recent product developments focus on enhanced image quality, improved workflow efficiency, and the integration of artificial intelligence for automated analysis and diagnostic support. New systems like Canon Medical's Vantage Fortian MRI system exemplify these trends with innovative workflow solutions, image enhancement, and accelerated scan technologies. The integration of AI and ML capabilities is becoming a key competitive differentiator, enhancing diagnostic accuracy and reducing human error. These advancements cater to the growing demand for faster, more accurate, and cost-effective diagnostic solutions.
Key Drivers of Medical Imaging Software Growth
Several key factors are driving the growth of the medical imaging software market. Technological advancements, such as AI and ML integration, are significantly improving diagnostic accuracy and efficiency. The increasing prevalence of chronic diseases is fueling demand for advanced imaging solutions. Furthermore, favorable government regulations and rising healthcare expenditure are also contributing to market expansion. The increasing adoption of cloud-based solutions is another key growth driver.
Challenges in the Medical Imaging Software Industry Market
The medical imaging software market faces challenges including stringent regulatory hurdles impacting product approvals and data privacy concerns. Supply chain disruptions can affect the availability of essential components, particularly semiconductors. Intense competition among existing players and the emergence of new entrants pose additional challenges. These factors can impact market growth and profitability. The estimated impact on market growth is approximately xx% over the next 5 years.
Emerging Opportunities in Medical Imaging Software Industry
The integration of AI and ML offers significant opportunities for improving diagnostic accuracy and workflow efficiency. Strategic partnerships between software providers and healthcare institutions can lead to broader market adoption and the development of innovative solutions. Expansion into emerging markets, particularly in Asia-Pacific and Latin America, presents further growth opportunities. These trends are poised to reshape the medical imaging software market in the coming years.
Leading Players in the Medical Imaging Software Industry Sector
- Esaote SpA
- Siemens Healthcare
- General Healthcare Company (GE)
- Koninklijke Philips N V
- Agfa Gevaert HealthCare
- Cerner Corporation
- MIM Software Inc
- Canon Medical Systems Corporation
- Fujifilm Holding Company
- Carestream Health Inc
- Change Healthcare
- Novarad Corporation
Key Milestones in Medical Imaging Software Industry
- February 2022: The European Society of Radiology and GE Healthcare renewed their strategic partnership for ECR 2022. This strengthened GE's position in the European market and highlighted the importance of digital and AI solutions.
- July 2022: Canon Medical launched the Vantage Fortian MRI system, showcasing advancements in workflow solutions and scan technologies. This launch expanded Canon Medical’s product portfolio and enhanced its competitive standing.
- July 2022: Calyx and Qynapse partnered to advance AI-based neuroimaging in clinical trials, indicating the growing role of AI in drug development and neurology. This collaboration signified the potential for AI to revolutionize clinical trials.
Strategic Outlook for Medical Imaging Software Industry Market
The future of the medical imaging software market is promising, driven by technological advancements, increasing healthcare spending, and the growing need for efficient and accurate diagnostic tools. Strategic partnerships, acquisitions, and the expansion into new markets will continue to shape the industry. Companies that prioritize innovation, user-friendliness, and data security will be best positioned for success in this rapidly evolving landscape. The market is expected to experience significant growth, fueled by the continuous development and adoption of AI-powered solutions and the expanding applications across various medical specialties.
Medical Imaging Software Industry Segmentation
-
1. Imaging Type
- 1.1. 2D Imaging
- 1.2. 3D Imaging
- 1.3. 4D Imaging
-
2. Application
- 2.1. Dental Applications
- 2.2. Orthopaedic Applications
- 2.3. Cardiology Applications
- 2.4. Obstetrics and Gynaecology Applications
- 2.5. Mammography Applications
- 2.6. Urology and Nephrology Applications
- 2.7. Other Applications
Medical Imaging Software Industry Segmentation By Geography
-
1. North America
- 1.1. United States
- 1.2. Canada
-
2. Europe
- 2.1. Germany
- 2.2. France
- 2.3. United Kingdom
- 2.4. Rest of Europe
-
3. Asia Pacific
- 3.1. China
- 3.2. Japan
- 3.3. India
- 3.4. Rest of Asia Pacific
-
4. Rest of the World
- 4.1. Latin America
- 4.2. Middle East

Medical Imaging Software Industry REPORT HIGHLIGHTS
| Aspects | Details |
|---|---|
| Study Period | 2019-2033 |
| Base Year | 2024 |
| Estimated Year | 2025 |
| Forecast Period | 2025-2033 |
| Historical Period | 2019-2024 |
| Growth Rate | CAGR of 7.84% from 2019-2033 |
| Segmentation |
|
Table of Contents
- 1. Introduction
- 1.1. Research Scope
- 1.2. Market Segmentation
- 1.3. Research Methodology
- 1.4. Definitions and Assumptions
- 2. Executive Summary
- 2.1. Introduction
- 3. Market Dynamics
- 3.1. Introduction
- 3.2. Market Drivers
- 3.2.1. Growing Application of Computer-Aided Diagnostic Methods
- 3.3. Market Restrains
- 3.3.1. Dearth of Skilled Professionals and High Set-up Cost of the Equipment
- 3.4. Market Trends
- 3.4.1. Cardiology Applications Segment Holds Major Market Share
- 4. Market Factor Analysis
- 4.1. Porters Five Forces
- 4.2. Supply/Value Chain
- 4.3. PESTEL analysis
- 4.4. Market Entropy
- 4.5. Patent/Trademark Analysis
- 5. Global Medical Imaging Software Industry Analysis, Insights and Forecast, 2019-2031
- 5.1. Market Analysis, Insights and Forecast - by Imaging Type
- 5.1.1. 2D Imaging
- 5.1.2. 3D Imaging
- 5.1.3. 4D Imaging
- 5.2. Market Analysis, Insights and Forecast - by Application
- 5.2.1. Dental Applications
- 5.2.2. Orthopaedic Applications
- 5.2.3. Cardiology Applications
- 5.2.4. Obstetrics and Gynaecology Applications
- 5.2.5. Mammography Applications
- 5.2.6. Urology and Nephrology Applications
- 5.2.7. Other Applications
- 5.3. Market Analysis, Insights and Forecast - by Region
- 5.3.1. North America
- 5.3.2. Europe
- 5.3.3. Asia Pacific
- 5.3.4. Rest of the World
- 5.1. Market Analysis, Insights and Forecast - by Imaging Type
- 6. North America Medical Imaging Software Industry Analysis, Insights and Forecast, 2019-2031
- 6.1. Market Analysis, Insights and Forecast - by Imaging Type
- 6.1.1. 2D Imaging
- 6.1.2. 3D Imaging
- 6.1.3. 4D Imaging
- 6.2. Market Analysis, Insights and Forecast - by Application
- 6.2.1. Dental Applications
- 6.2.2. Orthopaedic Applications
- 6.2.3. Cardiology Applications
- 6.2.4. Obstetrics and Gynaecology Applications
- 6.2.5. Mammography Applications
- 6.2.6. Urology and Nephrology Applications
- 6.2.7. Other Applications
- 6.1. Market Analysis, Insights and Forecast - by Imaging Type
- 7. Europe Medical Imaging Software Industry Analysis, Insights and Forecast, 2019-2031
- 7.1. Market Analysis, Insights and Forecast - by Imaging Type
- 7.1.1. 2D Imaging
- 7.1.2. 3D Imaging
- 7.1.3. 4D Imaging
- 7.2. Market Analysis, Insights and Forecast - by Application
- 7.2.1. Dental Applications
- 7.2.2. Orthopaedic Applications
- 7.2.3. Cardiology Applications
- 7.2.4. Obstetrics and Gynaecology Applications
- 7.2.5. Mammography Applications
- 7.2.6. Urology and Nephrology Applications
- 7.2.7. Other Applications
- 7.1. Market Analysis, Insights and Forecast - by Imaging Type
- 8. Asia Pacific Medical Imaging Software Industry Analysis, Insights and Forecast, 2019-2031
- 8.1. Market Analysis, Insights and Forecast - by Imaging Type
- 8.1.1. 2D Imaging
- 8.1.2. 3D Imaging
- 8.1.3. 4D Imaging
- 8.2. Market Analysis, Insights and Forecast - by Application
- 8.2.1. Dental Applications
- 8.2.2. Orthopaedic Applications
- 8.2.3. Cardiology Applications
- 8.2.4. Obstetrics and Gynaecology Applications
- 8.2.5. Mammography Applications
- 8.2.6. Urology and Nephrology Applications
- 8.2.7. Other Applications
- 8.1. Market Analysis, Insights and Forecast - by Imaging Type
- 9. Rest of the World Medical Imaging Software Industry Analysis, Insights and Forecast, 2019-2031
- 9.1. Market Analysis, Insights and Forecast - by Imaging Type
- 9.1.1. 2D Imaging
- 9.1.2. 3D Imaging
- 9.1.3. 4D Imaging
- 9.2. Market Analysis, Insights and Forecast - by Application
- 9.2.1. Dental Applications
- 9.2.2. Orthopaedic Applications
- 9.2.3. Cardiology Applications
- 9.2.4. Obstetrics and Gynaecology Applications
- 9.2.5. Mammography Applications
- 9.2.6. Urology and Nephrology Applications
- 9.2.7. Other Applications
- 9.1. Market Analysis, Insights and Forecast - by Imaging Type
- 10. North America Medical Imaging Software Industry Analysis, Insights and Forecast, 2019-2031
- 10.1. Market Analysis, Insights and Forecast - By Country/Sub-region
- 10.1.1 United States
- 10.1.2 Canada
- 10.1.3 Mexico
- 11. Europe Medical Imaging Software Industry Analysis, Insights and Forecast, 2019-2031
- 11.1. Market Analysis, Insights and Forecast - By Country/Sub-region
- 11.1.1 Germany
- 11.1.2 United Kingdom
- 11.1.3 France
- 11.1.4 Spain
- 11.1.5 Italy
- 11.1.6 Spain
- 11.1.7 Belgium
- 11.1.8 Netherland
- 11.1.9 Nordics
- 11.1.10 Rest of Europe
- 12. Asia Pacific Medical Imaging Software Industry Analysis, Insights and Forecast, 2019-2031
- 12.1. Market Analysis, Insights and Forecast - By Country/Sub-region
- 12.1.1 China
- 12.1.2 Japan
- 12.1.3 India
- 12.1.4 South Korea
- 12.1.5 Southeast Asia
- 12.1.6 Australia
- 12.1.7 Indonesia
- 12.1.8 Phillipes
- 12.1.9 Singapore
- 12.1.10 Thailandc
- 12.1.11 Rest of Asia Pacific
- 13. South America Medical Imaging Software Industry Analysis, Insights and Forecast, 2019-2031
- 13.1. Market Analysis, Insights and Forecast - By Country/Sub-region
- 13.1.1 Brazil
- 13.1.2 Argentina
- 13.1.3 Peru
- 13.1.4 Chile
- 13.1.5 Colombia
- 13.1.6 Ecuador
- 13.1.7 Venezuela
- 13.1.8 Rest of South America
- 14. North America Medical Imaging Software Industry Analysis, Insights and Forecast, 2019-2031
- 14.1. Market Analysis, Insights and Forecast - By Country/Sub-region
- 14.1.1 United States
- 14.1.2 Canada
- 14.1.3 Mexico
- 15. MEA Medical Imaging Software Industry Analysis, Insights and Forecast, 2019-2031
- 15.1. Market Analysis, Insights and Forecast - By Country/Sub-region
- 15.1.1 United Arab Emirates
- 15.1.2 Saudi Arabia
- 15.1.3 South Africa
- 15.1.4 Rest of Middle East and Africa
- 16. Competitive Analysis
- 16.1. Global Market Share Analysis 2024
- 16.2. Company Profiles
- 16.2.1 Esaote SpA
- 16.2.1.1. Overview
- 16.2.1.2. Products
- 16.2.1.3. SWOT Analysis
- 16.2.1.4. Recent Developments
- 16.2.1.5. Financials (Based on Availability)
- 16.2.2 Siemens Healthcare
- 16.2.2.1. Overview
- 16.2.2.2. Products
- 16.2.2.3. SWOT Analysis
- 16.2.2.4. Recent Developments
- 16.2.2.5. Financials (Based on Availability)
- 16.2.3 General Healthcare Company (GE)
- 16.2.3.1. Overview
- 16.2.3.2. Products
- 16.2.3.3. SWOT Analysis
- 16.2.3.4. Recent Developments
- 16.2.3.5. Financials (Based on Availability)
- 16.2.4 Koninklijke Philips N V
- 16.2.4.1. Overview
- 16.2.4.2. Products
- 16.2.4.3. SWOT Analysis
- 16.2.4.4. Recent Developments
- 16.2.4.5. Financials (Based on Availability)
- 16.2.5 Agfa Gevaert HealthCare
- 16.2.5.1. Overview
- 16.2.5.2. Products
- 16.2.5.3. SWOT Analysis
- 16.2.5.4. Recent Developments
- 16.2.5.5. Financials (Based on Availability)
- 16.2.6 Cerner Corporation
- 16.2.6.1. Overview
- 16.2.6.2. Products
- 16.2.6.3. SWOT Analysis
- 16.2.6.4. Recent Developments
- 16.2.6.5. Financials (Based on Availability)
- 16.2.7 MIM Software Inc
- 16.2.7.1. Overview
- 16.2.7.2. Products
- 16.2.7.3. SWOT Analysis
- 16.2.7.4. Recent Developments
- 16.2.7.5. Financials (Based on Availability)
- 16.2.8 Canon Medical Systems Corporation
- 16.2.8.1. Overview
- 16.2.8.2. Products
- 16.2.8.3. SWOT Analysis
- 16.2.8.4. Recent Developments
- 16.2.8.5. Financials (Based on Availability)
- 16.2.9 Fujifilm Holding Company
- 16.2.9.1. Overview
- 16.2.9.2. Products
- 16.2.9.3. SWOT Analysis
- 16.2.9.4. Recent Developments
- 16.2.9.5. Financials (Based on Availability)
- 16.2.10 Carestream Health Inc
- 16.2.10.1. Overview
- 16.2.10.2. Products
- 16.2.10.3. SWOT Analysis
- 16.2.10.4. Recent Developments
- 16.2.10.5. Financials (Based on Availability)
- 16.2.11 Change Healthcare
- 16.2.11.1. Overview
- 16.2.11.2. Products
- 16.2.11.3. SWOT Analysis
- 16.2.11.4. Recent Developments
- 16.2.11.5. Financials (Based on Availability)
- 16.2.12 Novarad Corporation
- 16.2.12.1. Overview
- 16.2.12.2. Products
- 16.2.12.3. SWOT Analysis
- 16.2.12.4. Recent Developments
- 16.2.12.5. Financials (Based on Availability)
- 16.2.1 Esaote SpA
List of Figures
- Figure 1: Global Medical Imaging Software Industry Revenue Breakdown (Million, %) by Region 2024 & 2032
- Figure 2: North America Medical Imaging Software Industry Revenue (Million), by Country 2024 & 2032
- Figure 3: North America Medical Imaging Software Industry Revenue Share (%), by Country 2024 & 2032
- Figure 4: Europe Medical Imaging Software Industry Revenue (Million), by Country 2024 & 2032
- Figure 5: Europe Medical Imaging Software Industry Revenue Share (%), by Country 2024 & 2032
- Figure 6: Asia Pacific Medical Imaging Software Industry Revenue (Million), by Country 2024 & 2032
- Figure 7: Asia Pacific Medical Imaging Software Industry Revenue Share (%), by Country 2024 & 2032
- Figure 8: South America Medical Imaging Software Industry Revenue (Million), by Country 2024 & 2032
- Figure 9: South America Medical Imaging Software Industry Revenue Share (%), by Country 2024 & 2032
- Figure 10: North America Medical Imaging Software Industry Revenue (Million), by Country 2024 & 2032
- Figure 11: North America Medical Imaging Software Industry Revenue Share (%), by Country 2024 & 2032
- Figure 12: MEA Medical Imaging Software Industry Revenue (Million), by Country 2024 & 2032
- Figure 13: MEA Medical Imaging Software Industry Revenue Share (%), by Country 2024 & 2032
- Figure 14: North America Medical Imaging Software Industry Revenue (Million), by Imaging Type 2024 & 2032
- Figure 15: North America Medical Imaging Software Industry Revenue Share (%), by Imaging Type 2024 & 2032
- Figure 16: North America Medical Imaging Software Industry Revenue (Million), by Application 2024 & 2032
- Figure 17: North America Medical Imaging Software Industry Revenue Share (%), by Application 2024 & 2032
- Figure 18: North America Medical Imaging Software Industry Revenue (Million), by Country 2024 & 2032
- Figure 19: North America Medical Imaging Software Industry Revenue Share (%), by Country 2024 & 2032
- Figure 20: Europe Medical Imaging Software Industry Revenue (Million), by Imaging Type 2024 & 2032
- Figure 21: Europe Medical Imaging Software Industry Revenue Share (%), by Imaging Type 2024 & 2032
- Figure 22: Europe Medical Imaging Software Industry Revenue (Million), by Application 2024 & 2032
- Figure 23: Europe Medical Imaging Software Industry Revenue Share (%), by Application 2024 & 2032
- Figure 24: Europe Medical Imaging Software Industry Revenue (Million), by Country 2024 & 2032
- Figure 25: Europe Medical Imaging Software Industry Revenue Share (%), by Country 2024 & 2032
- Figure 26: Asia Pacific Medical Imaging Software Industry Revenue (Million), by Imaging Type 2024 & 2032
- Figure 27: Asia Pacific Medical Imaging Software Industry Revenue Share (%), by Imaging Type 2024 & 2032
- Figure 28: Asia Pacific Medical Imaging Software Industry Revenue (Million), by Application 2024 & 2032
- Figure 29: Asia Pacific Medical Imaging Software Industry Revenue Share (%), by Application 2024 & 2032
- Figure 30: Asia Pacific Medical Imaging Software Industry Revenue (Million), by Country 2024 & 2032
- Figure 31: Asia Pacific Medical Imaging Software Industry Revenue Share (%), by Country 2024 & 2032
- Figure 32: Rest of the World Medical Imaging Software Industry Revenue (Million), by Imaging Type 2024 & 2032
- Figure 33: Rest of the World Medical Imaging Software Industry Revenue Share (%), by Imaging Type 2024 & 2032
- Figure 34: Rest of the World Medical Imaging Software Industry Revenue (Million), by Application 2024 & 2032
- Figure 35: Rest of the World Medical Imaging Software Industry Revenue Share (%), by Application 2024 & 2032
- Figure 36: Rest of the World Medical Imaging Software Industry Revenue (Million), by Country 2024 & 2032
- Figure 37: Rest of the World Medical Imaging Software Industry Revenue Share (%), by Country 2024 & 2032
List of Tables
- Table 1: Global Medical Imaging Software Industry Revenue Million Forecast, by Region 2019 & 2032
- Table 2: Global Medical Imaging Software Industry Revenue Million Forecast, by Imaging Type 2019 & 2032
- Table 3: Global Medical Imaging Software Industry Revenue Million Forecast, by Application 2019 & 2032
- Table 4: Global Medical Imaging Software Industry Revenue Million Forecast, by Region 2019 & 2032
- Table 5: Global Medical Imaging Software Industry Revenue Million Forecast, by Country 2019 & 2032
- Table 6: United States Medical Imaging Software Industry Revenue (Million) Forecast, by Application 2019 & 2032
- Table 7: Canada Medical Imaging Software Industry Revenue (Million) Forecast, by Application 2019 & 2032
- Table 8: Mexico Medical Imaging Software Industry Revenue (Million) Forecast, by Application 2019 & 2032
- Table 9: Global Medical Imaging Software Industry Revenue Million Forecast, by Country 2019 & 2032
- Table 10: Germany Medical Imaging Software Industry Revenue (Million) Forecast, by Application 2019 & 2032
- Table 11: United Kingdom Medical Imaging Software Industry Revenue (Million) Forecast, by Application 2019 & 2032
- Table 12: France Medical Imaging Software Industry Revenue (Million) Forecast, by Application 2019 & 2032
- Table 13: Spain Medical Imaging Software Industry Revenue (Million) Forecast, by Application 2019 & 2032
- Table 14: Italy Medical Imaging Software Industry Revenue (Million) Forecast, by Application 2019 & 2032
- Table 15: Spain Medical Imaging Software Industry Revenue (Million) Forecast, by Application 2019 & 2032
- Table 16: Belgium Medical Imaging Software Industry Revenue (Million) Forecast, by Application 2019 & 2032
- Table 17: Netherland Medical Imaging Software Industry Revenue (Million) Forecast, by Application 2019 & 2032
- Table 18: Nordics Medical Imaging Software Industry Revenue (Million) Forecast, by Application 2019 & 2032
- Table 19: Rest of Europe Medical Imaging Software Industry Revenue (Million) Forecast, by Application 2019 & 2032
- Table 20: Global Medical Imaging Software Industry Revenue Million Forecast, by Country 2019 & 2032
- Table 21: China Medical Imaging Software Industry Revenue (Million) Forecast, by Application 2019 & 2032
- Table 22: Japan Medical Imaging Software Industry Revenue (Million) Forecast, by Application 2019 & 2032
- Table 23: India Medical Imaging Software Industry Revenue (Million) Forecast, by Application 2019 & 2032
- Table 24: South Korea Medical Imaging Software Industry Revenue (Million) Forecast, by Application 2019 & 2032
- Table 25: Southeast Asia Medical Imaging Software Industry Revenue (Million) Forecast, by Application 2019 & 2032
- Table 26: Australia Medical Imaging Software Industry Revenue (Million) Forecast, by Application 2019 & 2032
- Table 27: Indonesia Medical Imaging Software Industry Revenue (Million) Forecast, by Application 2019 & 2032
- Table 28: Phillipes Medical Imaging Software Industry Revenue (Million) Forecast, by Application 2019 & 2032
- Table 29: Singapore Medical Imaging Software Industry Revenue (Million) Forecast, by Application 2019 & 2032
- Table 30: Thailandc Medical Imaging Software Industry Revenue (Million) Forecast, by Application 2019 & 2032
- Table 31: Rest of Asia Pacific Medical Imaging Software Industry Revenue (Million) Forecast, by Application 2019 & 2032
- Table 32: Global Medical Imaging Software Industry Revenue Million Forecast, by Country 2019 & 2032
- Table 33: Brazil Medical Imaging Software Industry Revenue (Million) Forecast, by Application 2019 & 2032
- Table 34: Argentina Medical Imaging Software Industry Revenue (Million) Forecast, by Application 2019 & 2032
- Table 35: Peru Medical Imaging Software Industry Revenue (Million) Forecast, by Application 2019 & 2032
- Table 36: Chile Medical Imaging Software Industry Revenue (Million) Forecast, by Application 2019 & 2032
- Table 37: Colombia Medical Imaging Software Industry Revenue (Million) Forecast, by Application 2019 & 2032
- Table 38: Ecuador Medical Imaging Software Industry Revenue (Million) Forecast, by Application 2019 & 2032
- Table 39: Venezuela Medical Imaging Software Industry Revenue (Million) Forecast, by Application 2019 & 2032
- Table 40: Rest of South America Medical Imaging Software Industry Revenue (Million) Forecast, by Application 2019 & 2032
- Table 41: Global Medical Imaging Software Industry Revenue Million Forecast, by Country 2019 & 2032
- Table 42: United States Medical Imaging Software Industry Revenue (Million) Forecast, by Application 2019 & 2032
- Table 43: Canada Medical Imaging Software Industry Revenue (Million) Forecast, by Application 2019 & 2032
- Table 44: Mexico Medical Imaging Software Industry Revenue (Million) Forecast, by Application 2019 & 2032
- Table 45: Global Medical Imaging Software Industry Revenue Million Forecast, by Country 2019 & 2032
- Table 46: United Arab Emirates Medical Imaging Software Industry Revenue (Million) Forecast, by Application 2019 & 2032
- Table 47: Saudi Arabia Medical Imaging Software Industry Revenue (Million) Forecast, by Application 2019 & 2032
- Table 48: South Africa Medical Imaging Software Industry Revenue (Million) Forecast, by Application 2019 & 2032
- Table 49: Rest of Middle East and Africa Medical Imaging Software Industry Revenue (Million) Forecast, by Application 2019 & 2032
- Table 50: Global Medical Imaging Software Industry Revenue Million Forecast, by Imaging Type 2019 & 2032
- Table 51: Global Medical Imaging Software Industry Revenue Million Forecast, by Application 2019 & 2032
- Table 52: Global Medical Imaging Software Industry Revenue Million Forecast, by Country 2019 & 2032
- Table 53: United States Medical Imaging Software Industry Revenue (Million) Forecast, by Application 2019 & 2032
- Table 54: Canada Medical Imaging Software Industry Revenue (Million) Forecast, by Application 2019 & 2032
- Table 55: Global Medical Imaging Software Industry Revenue Million Forecast, by Imaging Type 2019 & 2032
- Table 56: Global Medical Imaging Software Industry Revenue Million Forecast, by Application 2019 & 2032
- Table 57: Global Medical Imaging Software Industry Revenue Million Forecast, by Country 2019 & 2032
- Table 58: Germany Medical Imaging Software Industry Revenue (Million) Forecast, by Application 2019 & 2032
- Table 59: France Medical Imaging Software Industry Revenue (Million) Forecast, by Application 2019 & 2032
- Table 60: United Kingdom Medical Imaging Software Industry Revenue (Million) Forecast, by Application 2019 & 2032
- Table 61: Rest of Europe Medical Imaging Software Industry Revenue (Million) Forecast, by Application 2019 & 2032
- Table 62: Global Medical Imaging Software Industry Revenue Million Forecast, by Imaging Type 2019 & 2032
- Table 63: Global Medical Imaging Software Industry Revenue Million Forecast, by Application 2019 & 2032
- Table 64: Global Medical Imaging Software Industry Revenue Million Forecast, by Country 2019 & 2032
- Table 65: China Medical Imaging Software Industry Revenue (Million) Forecast, by Application 2019 & 2032
- Table 66: Japan Medical Imaging Software Industry Revenue (Million) Forecast, by Application 2019 & 2032
- Table 67: India Medical Imaging Software Industry Revenue (Million) Forecast, by Application 2019 & 2032
- Table 68: Rest of Asia Pacific Medical Imaging Software Industry Revenue (Million) Forecast, by Application 2019 & 2032
- Table 69: Global Medical Imaging Software Industry Revenue Million Forecast, by Imaging Type 2019 & 2032
- Table 70: Global Medical Imaging Software Industry Revenue Million Forecast, by Application 2019 & 2032
- Table 71: Global Medical Imaging Software Industry Revenue Million Forecast, by Country 2019 & 2032
- Table 72: Latin America Medical Imaging Software Industry Revenue (Million) Forecast, by Application 2019 & 2032
- Table 73: Middle East Medical Imaging Software Industry Revenue (Million) Forecast, by Application 2019 & 2032
Frequently Asked Questions
1. What is the projected Compound Annual Growth Rate (CAGR) of the Medical Imaging Software Industry?
The projected CAGR is approximately 7.84%.
2. Which companies are prominent players in the Medical Imaging Software Industry?
Key companies in the market include Esaote SpA, Siemens Healthcare, General Healthcare Company (GE), Koninklijke Philips N V, Agfa Gevaert HealthCare, Cerner Corporation, MIM Software Inc, Canon Medical Systems Corporation, Fujifilm Holding Company, Carestream Health Inc, Change Healthcare, Novarad Corporation.
3. What are the main segments of the Medical Imaging Software Industry?
The market segments include Imaging Type, Application.
4. Can you provide details about the market size?
The market size is estimated to be USD 8.11 Million as of 2022.
5. What are some drivers contributing to market growth?
Growing Application of Computer-Aided Diagnostic Methods.
6. What are the notable trends driving market growth?
Cardiology Applications Segment Holds Major Market Share.
7. Are there any restraints impacting market growth?
Dearth of Skilled Professionals and High Set-up Cost of the Equipment.
8. Can you provide examples of recent developments in the market?
February 2022 - The European Society of Radiology and GE Healthcare have renewed their strategic partnership for the online European Congress of Radiology ECR 2022 on March 2-6, 2022, and onsite ECR 2022 on July 13-17 in Vienna, Austria. GE Healthcare would focus its efforts on three strategic pillars, digital and artificial intelligence, patient experience, and sustainability & resilience.
9. What pricing options are available for accessing the report?
Pricing options include single-user, multi-user, and enterprise licenses priced at USD 4750, USD 5250, and USD 8750 respectively.
10. Is the market size provided in terms of value or volume?
The market size is provided in terms of value, measured in Million.
11. Are there any specific market keywords associated with the report?
Yes, the market keyword associated with the report is "Medical Imaging Software Industry," which aids in identifying and referencing the specific market segment covered.
12. How do I determine which pricing option suits my needs best?
The pricing options vary based on user requirements and access needs. Individual users may opt for single-user licenses, while businesses requiring broader access may choose multi-user or enterprise licenses for cost-effective access to the report.
13. Are there any additional resources or data provided in the Medical Imaging Software Industry report?
While the report offers comprehensive insights, it's advisable to review the specific contents or supplementary materials provided to ascertain if additional resources or data are available.
14. How can I stay updated on further developments or reports in the Medical Imaging Software Industry?
To stay informed about further developments, trends, and reports in the Medical Imaging Software Industry, consider subscribing to industry newsletters, following relevant companies and organizations, or regularly checking reputable industry news sources and publications.
Methodology
Step 1 - Identification of Relevant Samples Size from Population Database


Step 2 - Approaches for Defining Global Market Size (Value, Volume* & Price*)

Note*: In applicable scenarios
Step 3 - Data Sources
Primary Research
- Web Analytics
- Survey Reports
- Research Institute
- Latest Research Reports
- Opinion Leaders
Secondary Research
- Annual Reports
- White Paper
- Latest Press Release
- Industry Association
- Paid Database
- Investor Presentations

Step 4 - Data Triangulation
Involves using different sources of information in order to increase the validity of a study
These sources are likely to be stakeholders in a program - participants, other researchers, program staff, other community members, and so on.
Then we put all data in single framework & apply various statistical tools to find out the dynamic on the market.
During the analysis stage, feedback from the stakeholder groups would be compared to determine areas of agreement as well as areas of divergence
