

Key Insights
The marine display market is projected for substantial expansion, propelled by the increasing adoption of advanced navigation and communication systems across recreational and commercial maritime sectors. Technological innovations, including larger, higher-resolution displays with integrated sonar, radar, and GPS capabilities, are key growth drivers. The widespread implementation of Integrated Bridge Systems (IBS) and Electronic Chart Display and Information Systems (ECDIS) in commercial shipping further solidifies market growth. Additionally, the burgeoning popularity of recreational boating and fishing, coupled with rising disposable incomes globally, is boosting demand for sophisticated marine displays in leisure craft. Leading market participants are committed to continuous innovation, introducing intuitive user interfaces and enhanced functionalities to meet evolving customer demands, fostering a competitive environment that drives product quality and affordability.
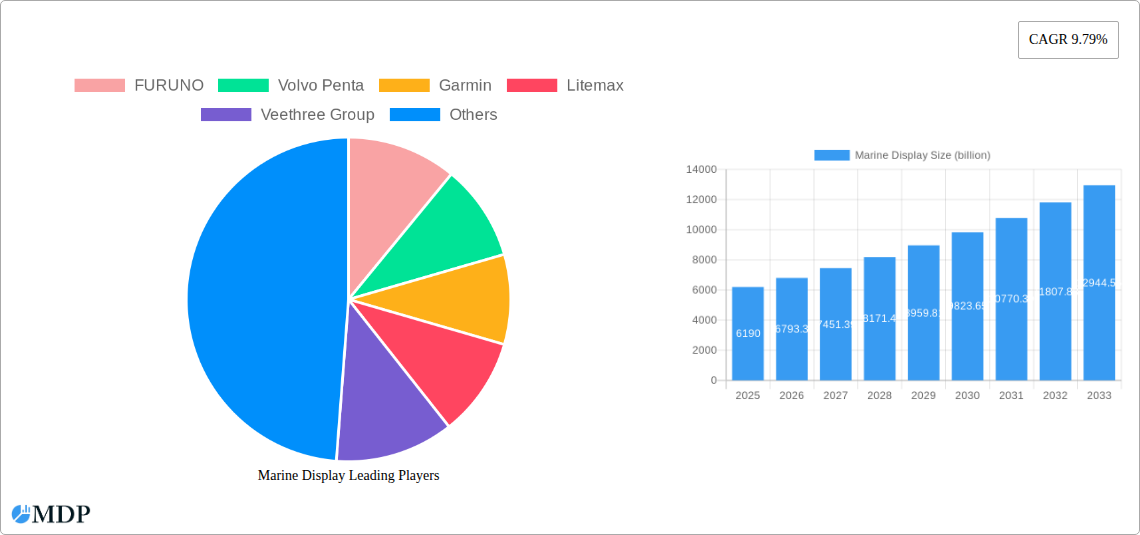
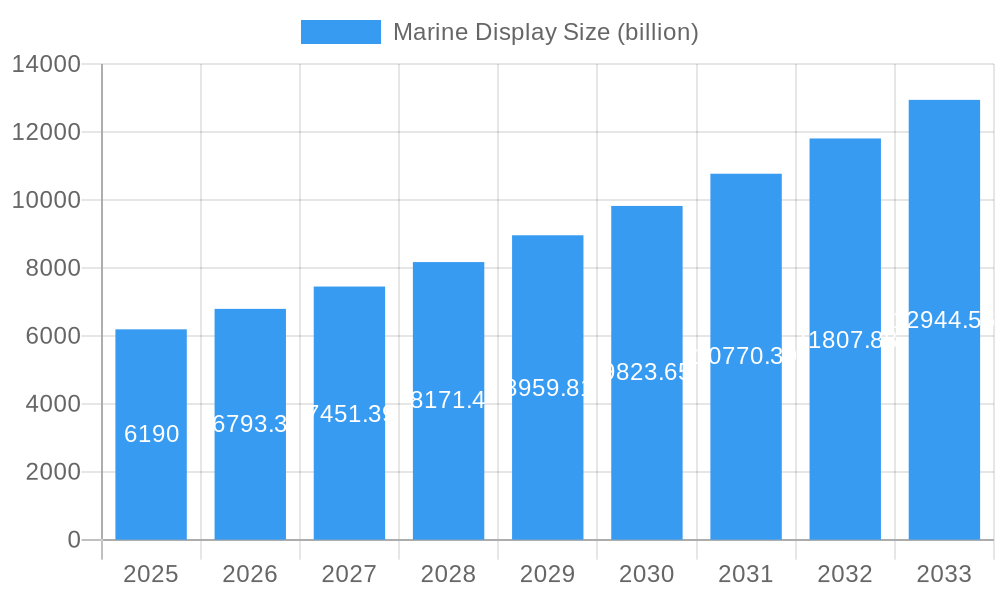
Marine Display Market Size (In Billion)
Market segmentation highlights diverse applications. The recreational segment, serving smaller vessels like yachts and fishing boats, exhibits strong growth potential driven by the increasing appeal of boating as a leisure pursuit. The commercial segment, encompassing large vessels such as cargo ships and cruise liners, is influenced by stringent safety regulations and the requirement for precise navigation. Geographically, North America and Europe demonstrate robust performance due to established boating cultures and technological leadership. However, the Asia-Pacific region is anticipated to experience significant growth, supported by an expanding middle class and increased investment in maritime infrastructure. Despite challenges posed by rising raw material costs and complex supply chains, the overall market outlook is highly favorable, indicating considerable growth prospects for industry stakeholders. We forecast the market to reach $6.19 billion by 2025, with a Compound Annual Growth Rate (CAGR) of 9.79% through 2033.
Marine Display Company Market Share
Marine Display Market Report: 2019-2033 - A Comprehensive Analysis of a Multi-Billion Dollar Industry
Dive into the dynamic world of marine displays with this in-depth market report, projecting a multi-billion dollar market by 2033. This comprehensive study provides an unparalleled analysis of the Marine Display market, covering key aspects from market dynamics and concentration to leading players and future opportunities. Benefit from actionable insights based on rigorous data analysis covering the period 2019-2033, with a focus on 2025.
Marine Display Market Dynamics & Concentration
The global marine display market, valued at $XX billion in 2024, is experiencing robust growth driven by several factors. Market concentration is moderate, with several key players holding significant shares, but also with ample room for smaller players to succeed by innovating and specializing in niches. Innovation in areas such as integrated systems, improved display technologies (e.g., higher resolution, brighter screens), and enhanced connectivity are major drivers. Regulatory frameworks concerning safety and performance standards for marine electronics also influence market dynamics. Product substitutes, primarily older technologies, are gradually being replaced due to the improved capabilities and value proposition of modern displays. End-user trends towards larger screens, multi-function displays, and integrated navigation systems are fuelling market expansion. M&A activity has been moderate, with approximately xx deals recorded between 2019 and 2024, consolidating market share and driving innovation.
- Market Share: Top 5 players hold approximately xx% of the market share in 2024.
- M&A Activity: xx mergers and acquisitions recorded between 2019 and 2024.
- Innovation Drivers: Advancements in display technology, integrated systems, and connectivity.
- Regulatory Influence: Stringent safety and performance standards for marine electronics.
Marine Display Industry Trends & Analysis
The marine display market is experiencing a Compound Annual Growth Rate (CAGR) of xx% during the forecast period (2025-2033). This growth is fueled by several key trends: the increasing demand for advanced navigation and communication systems in commercial and recreational vessels, technological advancements resulting in better performance and functionality, rising adoption of integrated navigation systems, and the increasing preference for larger, higher-resolution displays. Consumer preferences are shifting towards user-friendly interfaces, improved connectivity (e.g., network integration), and enhanced data visualization capabilities. The competitive landscape is characterized by intense competition among established players and the emergence of new entrants, leading to continuous innovation and product diversification. Market penetration of advanced features like sonar integration and augmented reality overlays is also increasing, further boosting market growth.
Leading Markets & Segments in Marine Display
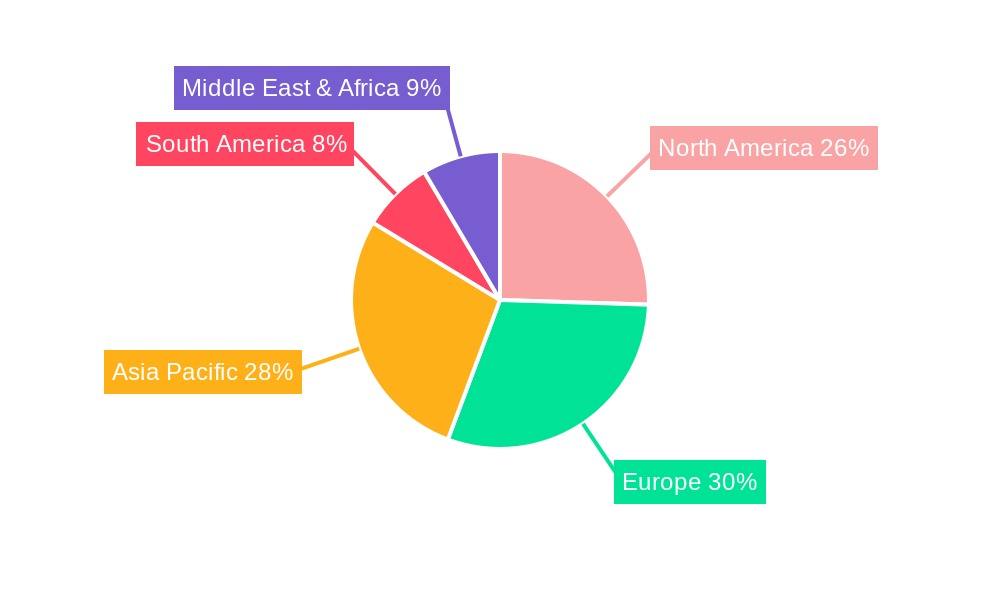
The North American market currently holds the largest share of the global marine display market, driven by factors including a large recreational boating sector, robust economic conditions and a strong preference for advanced marine technology. Europe follows closely as a significant market, with a steady growth trajectory fueled by a mix of commercial and recreational boating activities and government initiatives promoting safety and environmental sustainability.
- Key Drivers in North America: High recreational boating ownership, strong disposable incomes, and technological advancements.
- Key Drivers in Europe: Significant commercial shipping activity, stringent maritime safety regulations, and investments in eco-friendly navigation technologies.
- Dominant Segment: The commercial segment is predicted to witness a higher growth rate than the recreational segment due to increasing demand for advanced navigation and communication systems in commercial vessels and fleet management solutions.
Marine Display Product Developments
Recent advancements in marine display technology have focused on improving screen resolution, brightness, and durability for optimal visibility in various weather conditions. The integration of advanced features like GPS, radar, sonar, and AIS enhances situational awareness and navigational safety. Moreover, the incorporation of touchscreens and intuitive user interfaces increases ease of use and operation. These developments cater to diverse user needs, ensuring a market fit across recreational and commercial marine applications. The growing adoption of networked systems for data sharing and integration is another notable trend, driving further innovation.
Key Drivers of Marine Display Growth
The growth of the marine display market is fueled by technological advancements leading to enhanced features and functionalities. Furthermore, the expanding global economy and rising disposable incomes, particularly in developing economies, are driving increased recreational boating activities and investments in advanced marine technology. Stringent maritime safety regulations are also pushing adoption of advanced display systems.
Challenges in the Marine Display Market
Challenges facing the marine display market include supply chain disruptions affecting component availability and production costs, fierce competition from established players and emerging companies, leading to price pressures, and the complexity of integrating different technologies and data sources within a vessel's network. Additionally, regulatory hurdles and compliance requirements related to safety and environmental standards can impact market expansion. These factors could collectively decrease the overall market growth by an estimated xx% by 2033.
Emerging Opportunities in Marine Display
The long-term growth potential of the marine display market is significant. Emerging opportunities include the integration of artificial intelligence (AI) and machine learning (ML) for advanced decision support, the expansion into new markets with growing recreational boating activities, the development of eco-friendly displays, and strategic partnerships to offer comprehensive solutions encompassing multiple marine electronics. The adoption of augmented reality (AR) and virtual reality (VR) technologies for enhanced navigation and training simulations also presents a substantial opportunity.
Leading Players in the Marine Display Sector
- FURUNO
- Volvo Penta
- Garmin
- Litemax
- Veethree Group
- Nauticomp Inc
- Winmate Inc
- MarineNav Ltd
- Simrad Yachting
- Moxa
- Honda
- Noris
- AbraxSys Corporation
- EIZO Corporation
- Beijer Electronics
- Secu6 Technology Co
- Marine Data Systems Limited
- Veratron
- B&G
- Lowrance
- Raymarine
Key Milestones in Marine Display Industry
- 2020: Introduction of high-resolution displays with improved brightness and contrast.
- 2021: Several key players launched integrated navigation systems incorporating AI-powered features.
- 2022: Significant investments in R&D for AR/VR integration in marine navigation systems.
- 2023: Increased focus on eco-friendly and energy-efficient display technologies.
- 2024: Several mergers and acquisitions within the industry consolidating market share.
Strategic Outlook for Marine Display Market
The future of the marine display market is bright, with strong growth potential driven by ongoing technological advancements, increasing demand for integrated solutions, and expansion into new geographic markets. Strategic partnerships, focused R&D efforts, and a strong emphasis on providing user-friendly and highly functional products will be key to success in this dynamic and competitive landscape. The market is expected to reach $XX billion by 2033, presenting significant opportunities for both established players and new entrants.
Marine Display Segmentation
-
1. Application
- 1.1. Recreational Boats
- 1.2. Merchant Marine
- 1.3. Fishing Vessels
- 1.4. Workboats
- 1.5. Others
-
2. Types
- 2.1. Below 10 Inch
- 2.2. 10-20 Inch
- 2.3. Above 20 Inch
Marine Display Segmentation By Geography
-
1. North America
- 1.1. United States
- 1.2. Canada
- 1.3. Mexico
-
2. South America
- 2.1. Brazil
- 2.2. Argentina
- 2.3. Rest of South America
-
3. Europe
- 3.1. United Kingdom
- 3.2. Germany
- 3.3. France
- 3.4. Italy
- 3.5. Spain
- 3.6. Russia
- 3.7. Benelux
- 3.8. Nordics
- 3.9. Rest of Europe
-
4. Middle East & Africa
- 4.1. Turkey
- 4.2. Israel
- 4.3. GCC
- 4.4. North Africa
- 4.5. South Africa
- 4.6. Rest of Middle East & Africa
-
5. Asia Pacific
- 5.1. China
- 5.2. India
- 5.3. Japan
- 5.4. South Korea
- 5.5. ASEAN
- 5.6. Oceania
- 5.7. Rest of Asia Pacific
Marine Display Regional Market Share
Geographic Coverage of Marine Display
Marine Display REPORT HIGHLIGHTS
| Aspects | Details |
|---|---|
| Study Period | 2020-2034 |
| Base Year | 2025 |
| Estimated Year | 2026 |
| Forecast Period | 2026-2034 |
| Historical Period | 2020-2025 |
| Growth Rate | CAGR of 9.79% from 2020-2034 |
| Segmentation |
|
Table of Contents
- 1. Introduction
- 1.1. Research Scope
- 1.2. Market Segmentation
- 1.3. Research Objective
- 1.4. Definitions and Assumptions
- 2. Executive Summary
- 2.1. Market Snapshot
- 3. Market Dynamics
- 3.1. Market Drivers
- 3.2. Market Restrains
- 3.3. Market Trends
- 3.4. Market Opportunities
- 4. Market Factor Analysis
- 4.1. Porters Five Forces
- 4.1.1. Bargaining Power of Suppliers
- 4.1.2. Bargaining Power of Buyers
- 4.1.3. Threat of New Entrants
- 4.1.4. Threat of Substitutes
- 4.1.5. Competitive Rivalry
- 4.2. PESTEL analysis
- 4.3. BCG Analysis
- 4.3.1. Stars (High Growth, High Market Share)
- 4.3.2. Cash Cows (Low Growth, High Market Share)
- 4.3.3. Question Mark (High Growth, Low Market Share)
- 4.3.4. Dogs (Low Growth, Low Market Share)
- 4.4. Ansoff Matrix Analysis
- 4.5. Supply Chain Analysis
- 4.6. Regulatory Landscape
- 4.7. Current Market Potential and Opportunity Assessment (TAM–SAM–SOM Framework)
- 4.8. MDP Analyst Note
- 4.1. Porters Five Forces
- 5. Market Analysis, Insights and Forecast 2021-2033
- 5.1. Market Analysis, Insights and Forecast - by Application
- 5.1.1. Recreational Boats
- 5.1.2. Merchant Marine
- 5.1.3. Fishing Vessels
- 5.1.4. Workboats
- 5.1.5. Others
- 5.2. Market Analysis, Insights and Forecast - by Types
- 5.2.1. Below 10 Inch
- 5.2.2. 10-20 Inch
- 5.2.3. Above 20 Inch
- 5.3. Market Analysis, Insights and Forecast - by Region
- 5.3.1. North America
- 5.3.2. South America
- 5.3.3. Europe
- 5.3.4. Middle East & Africa
- 5.3.5. Asia Pacific
- 5.1. Market Analysis, Insights and Forecast - by Application
- 6. Global Marine Display Analysis, Insights and Forecast, 2021-2033
- 6.1. Market Analysis, Insights and Forecast - by Application
- 6.1.1. Recreational Boats
- 6.1.2. Merchant Marine
- 6.1.3. Fishing Vessels
- 6.1.4. Workboats
- 6.1.5. Others
- 6.2. Market Analysis, Insights and Forecast - by Types
- 6.2.1. Below 10 Inch
- 6.2.2. 10-20 Inch
- 6.2.3. Above 20 Inch
- 6.1. Market Analysis, Insights and Forecast - by Application
- 7. North America Marine Display Analysis, Insights and Forecast, 2020-2032
- 7.1. Market Analysis, Insights and Forecast - by Application
- 7.1.1. Recreational Boats
- 7.1.2. Merchant Marine
- 7.1.3. Fishing Vessels
- 7.1.4. Workboats
- 7.1.5. Others
- 7.2. Market Analysis, Insights and Forecast - by Types
- 7.2.1. Below 10 Inch
- 7.2.2. 10-20 Inch
- 7.2.3. Above 20 Inch
- 7.1. Market Analysis, Insights and Forecast - by Application
- 8. South America Marine Display Analysis, Insights and Forecast, 2020-2032
- 8.1. Market Analysis, Insights and Forecast - by Application
- 8.1.1. Recreational Boats
- 8.1.2. Merchant Marine
- 8.1.3. Fishing Vessels
- 8.1.4. Workboats
- 8.1.5. Others
- 8.2. Market Analysis, Insights and Forecast - by Types
- 8.2.1. Below 10 Inch
- 8.2.2. 10-20 Inch
- 8.2.3. Above 20 Inch
- 8.1. Market Analysis, Insights and Forecast - by Application
- 9. Europe Marine Display Analysis, Insights and Forecast, 2020-2032
- 9.1. Market Analysis, Insights and Forecast - by Application
- 9.1.1. Recreational Boats
- 9.1.2. Merchant Marine
- 9.1.3. Fishing Vessels
- 9.1.4. Workboats
- 9.1.5. Others
- 9.2. Market Analysis, Insights and Forecast - by Types
- 9.2.1. Below 10 Inch
- 9.2.2. 10-20 Inch
- 9.2.3. Above 20 Inch
- 9.1. Market Analysis, Insights and Forecast - by Application
- 10. Middle East & Africa Marine Display Analysis, Insights and Forecast, 2020-2032
- 10.1. Market Analysis, Insights and Forecast - by Application
- 10.1.1. Recreational Boats
- 10.1.2. Merchant Marine
- 10.1.3. Fishing Vessels
- 10.1.4. Workboats
- 10.1.5. Others
- 10.2. Market Analysis, Insights and Forecast - by Types
- 10.2.1. Below 10 Inch
- 10.2.2. 10-20 Inch
- 10.2.3. Above 20 Inch
- 10.1. Market Analysis, Insights and Forecast - by Application
- 11. Asia Pacific Marine Display Analysis, Insights and Forecast, 2020-2032
- 11.1. Market Analysis, Insights and Forecast - by Application
- 11.1.1. Recreational Boats
- 11.1.2. Merchant Marine
- 11.1.3. Fishing Vessels
- 11.1.4. Workboats
- 11.1.5. Others
- 11.2. Market Analysis, Insights and Forecast - by Types
- 11.2.1. Below 10 Inch
- 11.2.2. 10-20 Inch
- 11.2.3. Above 20 Inch
- 11.1. Market Analysis, Insights and Forecast - by Application
- 12. Competitive Analysis
- 12.1. Company Profiles
- 12.1.1 FURUNO
- 12.1.1.1. Company Overview
- 12.1.1.2. Products
- 12.1.1.3. Company Financials
- 12.1.1.4. SWOT Analysis
- 12.1.2 Volvo Penta
- 12.1.2.1. Company Overview
- 12.1.2.2. Products
- 12.1.2.3. Company Financials
- 12.1.2.4. SWOT Analysis
- 12.1.3 Garmin
- 12.1.3.1. Company Overview
- 12.1.3.2. Products
- 12.1.3.3. Company Financials
- 12.1.3.4. SWOT Analysis
- 12.1.4 Litemax
- 12.1.4.1. Company Overview
- 12.1.4.2. Products
- 12.1.4.3. Company Financials
- 12.1.4.4. SWOT Analysis
- 12.1.5 Veethree Group
- 12.1.5.1. Company Overview
- 12.1.5.2. Products
- 12.1.5.3. Company Financials
- 12.1.5.4. SWOT Analysis
- 12.1.6 Nauticomp Inc
- 12.1.6.1. Company Overview
- 12.1.6.2. Products
- 12.1.6.3. Company Financials
- 12.1.6.4. SWOT Analysis
- 12.1.7 Winmate Inc
- 12.1.7.1. Company Overview
- 12.1.7.2. Products
- 12.1.7.3. Company Financials
- 12.1.7.4. SWOT Analysis
- 12.1.8 MarineNav Ltd
- 12.1.8.1. Company Overview
- 12.1.8.2. Products
- 12.1.8.3. Company Financials
- 12.1.8.4. SWOT Analysis
- 12.1.9 Simrad Yachting
- 12.1.9.1. Company Overview
- 12.1.9.2. Products
- 12.1.9.3. Company Financials
- 12.1.9.4. SWOT Analysis
- 12.1.10 Moxa
- 12.1.10.1. Company Overview
- 12.1.10.2. Products
- 12.1.10.3. Company Financials
- 12.1.10.4. SWOT Analysis
- 12.1.11 Honda
- 12.1.11.1. Company Overview
- 12.1.11.2. Products
- 12.1.11.3. Company Financials
- 12.1.11.4. SWOT Analysis
- 12.1.12 Noris
- 12.1.12.1. Company Overview
- 12.1.12.2. Products
- 12.1.12.3. Company Financials
- 12.1.12.4. SWOT Analysis
- 12.1.13 AbraxSys Corporation
- 12.1.13.1. Company Overview
- 12.1.13.2. Products
- 12.1.13.3. Company Financials
- 12.1.13.4. SWOT Analysis
- 12.1.14 EIZO Corporation
- 12.1.14.1. Company Overview
- 12.1.14.2. Products
- 12.1.14.3. Company Financials
- 12.1.14.4. SWOT Analysis
- 12.1.15 Beijer Electronics
- 12.1.15.1. Company Overview
- 12.1.15.2. Products
- 12.1.15.3. Company Financials
- 12.1.15.4. SWOT Analysis
- 12.1.16 Secu6 Technology Co
- 12.1.16.1. Company Overview
- 12.1.16.2. Products
- 12.1.16.3. Company Financials
- 12.1.16.4. SWOT Analysis
- 12.1.17 Marine Data Systems Limited
- 12.1.17.1. Company Overview
- 12.1.17.2. Products
- 12.1.17.3. Company Financials
- 12.1.17.4. SWOT Analysis
- 12.1.18 Veratron
- 12.1.18.1. Company Overview
- 12.1.18.2. Products
- 12.1.18.3. Company Financials
- 12.1.18.4. SWOT Analysis
- 12.1.19 B and G
- 12.1.19.1. Company Overview
- 12.1.19.2. Products
- 12.1.19.3. Company Financials
- 12.1.19.4. SWOT Analysis
- 12.1.20 Lowrance
- 12.1.20.1. Company Overview
- 12.1.20.2. Products
- 12.1.20.3. Company Financials
- 12.1.20.4. SWOT Analysis
- 12.1.21 Raymarine
- 12.1.21.1. Company Overview
- 12.1.21.2. Products
- 12.1.21.3. Company Financials
- 12.1.21.4. SWOT Analysis
- 12.1.1 FURUNO
- 12.2. Market Entropy
- 12.2.1 Company's Key Areas Served
- 12.2.2 Recent Developments
- 12.3. Company Market Share Analysis 2025
- 12.3.1 Top 5 Companies Market Share Analysis
- 12.3.2 Top 3 Companies Market Share Analysis
- 12.4. List of Potential Customers
- 13. Research Methodology
List of Figures
- Figure 1: Global Marine Display Revenue Breakdown (billion, %) by Region 2025 & 2033
- Figure 2: Global Marine Display Volume Breakdown (K, %) by Region 2025 & 2033
- Figure 3: North America Marine Display Revenue (billion), by Application 2025 & 2033
- Figure 4: North America Marine Display Volume (K), by Application 2025 & 2033
- Figure 5: North America Marine Display Revenue Share (%), by Application 2025 & 2033
- Figure 6: North America Marine Display Volume Share (%), by Application 2025 & 2033
- Figure 7: North America Marine Display Revenue (billion), by Types 2025 & 2033
- Figure 8: North America Marine Display Volume (K), by Types 2025 & 2033
- Figure 9: North America Marine Display Revenue Share (%), by Types 2025 & 2033
- Figure 10: North America Marine Display Volume Share (%), by Types 2025 & 2033
- Figure 11: North America Marine Display Revenue (billion), by Country 2025 & 2033
- Figure 12: North America Marine Display Volume (K), by Country 2025 & 2033
- Figure 13: North America Marine Display Revenue Share (%), by Country 2025 & 2033
- Figure 14: North America Marine Display Volume Share (%), by Country 2025 & 2033
- Figure 15: South America Marine Display Revenue (billion), by Application 2025 & 2033
- Figure 16: South America Marine Display Volume (K), by Application 2025 & 2033
- Figure 17: South America Marine Display Revenue Share (%), by Application 2025 & 2033
- Figure 18: South America Marine Display Volume Share (%), by Application 2025 & 2033
- Figure 19: South America Marine Display Revenue (billion), by Types 2025 & 2033
- Figure 20: South America Marine Display Volume (K), by Types 2025 & 2033
- Figure 21: South America Marine Display Revenue Share (%), by Types 2025 & 2033
- Figure 22: South America Marine Display Volume Share (%), by Types 2025 & 2033
- Figure 23: South America Marine Display Revenue (billion), by Country 2025 & 2033
- Figure 24: South America Marine Display Volume (K), by Country 2025 & 2033
- Figure 25: South America Marine Display Revenue Share (%), by Country 2025 & 2033
- Figure 26: South America Marine Display Volume Share (%), by Country 2025 & 2033
- Figure 27: Europe Marine Display Revenue (billion), by Application 2025 & 2033
- Figure 28: Europe Marine Display Volume (K), by Application 2025 & 2033
- Figure 29: Europe Marine Display Revenue Share (%), by Application 2025 & 2033
- Figure 30: Europe Marine Display Volume Share (%), by Application 2025 & 2033
- Figure 31: Europe Marine Display Revenue (billion), by Types 2025 & 2033
- Figure 32: Europe Marine Display Volume (K), by Types 2025 & 2033
- Figure 33: Europe Marine Display Revenue Share (%), by Types 2025 & 2033
- Figure 34: Europe Marine Display Volume Share (%), by Types 2025 & 2033
- Figure 35: Europe Marine Display Revenue (billion), by Country 2025 & 2033
- Figure 36: Europe Marine Display Volume (K), by Country 2025 & 2033
- Figure 37: Europe Marine Display Revenue Share (%), by Country 2025 & 2033
- Figure 38: Europe Marine Display Volume Share (%), by Country 2025 & 2033
- Figure 39: Middle East & Africa Marine Display Revenue (billion), by Application 2025 & 2033
- Figure 40: Middle East & Africa Marine Display Volume (K), by Application 2025 & 2033
- Figure 41: Middle East & Africa Marine Display Revenue Share (%), by Application 2025 & 2033
- Figure 42: Middle East & Africa Marine Display Volume Share (%), by Application 2025 & 2033
- Figure 43: Middle East & Africa Marine Display Revenue (billion), by Types 2025 & 2033
- Figure 44: Middle East & Africa Marine Display Volume (K), by Types 2025 & 2033
- Figure 45: Middle East & Africa Marine Display Revenue Share (%), by Types 2025 & 2033
- Figure 46: Middle East & Africa Marine Display Volume Share (%), by Types 2025 & 2033
- Figure 47: Middle East & Africa Marine Display Revenue (billion), by Country 2025 & 2033
- Figure 48: Middle East & Africa Marine Display Volume (K), by Country 2025 & 2033
- Figure 49: Middle East & Africa Marine Display Revenue Share (%), by Country 2025 & 2033
- Figure 50: Middle East & Africa Marine Display Volume Share (%), by Country 2025 & 2033
- Figure 51: Asia Pacific Marine Display Revenue (billion), by Application 2025 & 2033
- Figure 52: Asia Pacific Marine Display Volume (K), by Application 2025 & 2033
- Figure 53: Asia Pacific Marine Display Revenue Share (%), by Application 2025 & 2033
- Figure 54: Asia Pacific Marine Display Volume Share (%), by Application 2025 & 2033
- Figure 55: Asia Pacific Marine Display Revenue (billion), by Types 2025 & 2033
- Figure 56: Asia Pacific Marine Display Volume (K), by Types 2025 & 2033
- Figure 57: Asia Pacific Marine Display Revenue Share (%), by Types 2025 & 2033
- Figure 58: Asia Pacific Marine Display Volume Share (%), by Types 2025 & 2033
- Figure 59: Asia Pacific Marine Display Revenue (billion), by Country 2025 & 2033
- Figure 60: Asia Pacific Marine Display Volume (K), by Country 2025 & 2033
- Figure 61: Asia Pacific Marine Display Revenue Share (%), by Country 2025 & 2033
- Figure 62: Asia Pacific Marine Display Volume Share (%), by Country 2025 & 2033
List of Tables
- Table 1: Global Marine Display Revenue billion Forecast, by Application 2020 & 2033
- Table 2: Global Marine Display Volume K Forecast, by Application 2020 & 2033
- Table 3: Global Marine Display Revenue billion Forecast, by Types 2020 & 2033
- Table 4: Global Marine Display Volume K Forecast, by Types 2020 & 2033
- Table 5: Global Marine Display Revenue billion Forecast, by Region 2020 & 2033
- Table 6: Global Marine Display Volume K Forecast, by Region 2020 & 2033
- Table 7: Global Marine Display Revenue billion Forecast, by Application 2020 & 2033
- Table 8: Global Marine Display Volume K Forecast, by Application 2020 & 2033
- Table 9: Global Marine Display Revenue billion Forecast, by Types 2020 & 2033
- Table 10: Global Marine Display Volume K Forecast, by Types 2020 & 2033
- Table 11: Global Marine Display Revenue billion Forecast, by Country 2020 & 2033
- Table 12: Global Marine Display Volume K Forecast, by Country 2020 & 2033
- Table 13: United States Marine Display Revenue (billion) Forecast, by Application 2020 & 2033
- Table 14: United States Marine Display Volume (K) Forecast, by Application 2020 & 2033
- Table 15: Canada Marine Display Revenue (billion) Forecast, by Application 2020 & 2033
- Table 16: Canada Marine Display Volume (K) Forecast, by Application 2020 & 2033
- Table 17: Mexico Marine Display Revenue (billion) Forecast, by Application 2020 & 2033
- Table 18: Mexico Marine Display Volume (K) Forecast, by Application 2020 & 2033
- Table 19: Global Marine Display Revenue billion Forecast, by Application 2020 & 2033
- Table 20: Global Marine Display Volume K Forecast, by Application 2020 & 2033
- Table 21: Global Marine Display Revenue billion Forecast, by Types 2020 & 2033
- Table 22: Global Marine Display Volume K Forecast, by Types 2020 & 2033
- Table 23: Global Marine Display Revenue billion Forecast, by Country 2020 & 2033
- Table 24: Global Marine Display Volume K Forecast, by Country 2020 & 2033
- Table 25: Brazil Marine Display Revenue (billion) Forecast, by Application 2020 & 2033
- Table 26: Brazil Marine Display Volume (K) Forecast, by Application 2020 & 2033
- Table 27: Argentina Marine Display Revenue (billion) Forecast, by Application 2020 & 2033
- Table 28: Argentina Marine Display Volume (K) Forecast, by Application 2020 & 2033
- Table 29: Rest of South America Marine Display Revenue (billion) Forecast, by Application 2020 & 2033
- Table 30: Rest of South America Marine Display Volume (K) Forecast, by Application 2020 & 2033
- Table 31: Global Marine Display Revenue billion Forecast, by Application 2020 & 2033
- Table 32: Global Marine Display Volume K Forecast, by Application 2020 & 2033
- Table 33: Global Marine Display Revenue billion Forecast, by Types 2020 & 2033
- Table 34: Global Marine Display Volume K Forecast, by Types 2020 & 2033
- Table 35: Global Marine Display Revenue billion Forecast, by Country 2020 & 2033
- Table 36: Global Marine Display Volume K Forecast, by Country 2020 & 2033
- Table 37: United Kingdom Marine Display Revenue (billion) Forecast, by Application 2020 & 2033
- Table 38: United Kingdom Marine Display Volume (K) Forecast, by Application 2020 & 2033
- Table 39: Germany Marine Display Revenue (billion) Forecast, by Application 2020 & 2033
- Table 40: Germany Marine Display Volume (K) Forecast, by Application 2020 & 2033
- Table 41: France Marine Display Revenue (billion) Forecast, by Application 2020 & 2033
- Table 42: France Marine Display Volume (K) Forecast, by Application 2020 & 2033
- Table 43: Italy Marine Display Revenue (billion) Forecast, by Application 2020 & 2033
- Table 44: Italy Marine Display Volume (K) Forecast, by Application 2020 & 2033
- Table 45: Spain Marine Display Revenue (billion) Forecast, by Application 2020 & 2033
- Table 46: Spain Marine Display Volume (K) Forecast, by Application 2020 & 2033
- Table 47: Russia Marine Display Revenue (billion) Forecast, by Application 2020 & 2033
- Table 48: Russia Marine Display Volume (K) Forecast, by Application 2020 & 2033
- Table 49: Benelux Marine Display Revenue (billion) Forecast, by Application 2020 & 2033
- Table 50: Benelux Marine Display Volume (K) Forecast, by Application 2020 & 2033
- Table 51: Nordics Marine Display Revenue (billion) Forecast, by Application 2020 & 2033
- Table 52: Nordics Marine Display Volume (K) Forecast, by Application 2020 & 2033
- Table 53: Rest of Europe Marine Display Revenue (billion) Forecast, by Application 2020 & 2033
- Table 54: Rest of Europe Marine Display Volume (K) Forecast, by Application 2020 & 2033
- Table 55: Global Marine Display Revenue billion Forecast, by Application 2020 & 2033
- Table 56: Global Marine Display Volume K Forecast, by Application 2020 & 2033
- Table 57: Global Marine Display Revenue billion Forecast, by Types 2020 & 2033
- Table 58: Global Marine Display Volume K Forecast, by Types 2020 & 2033
- Table 59: Global Marine Display Revenue billion Forecast, by Country 2020 & 2033
- Table 60: Global Marine Display Volume K Forecast, by Country 2020 & 2033
- Table 61: Turkey Marine Display Revenue (billion) Forecast, by Application 2020 & 2033
- Table 62: Turkey Marine Display Volume (K) Forecast, by Application 2020 & 2033
- Table 63: Israel Marine Display Revenue (billion) Forecast, by Application 2020 & 2033
- Table 64: Israel Marine Display Volume (K) Forecast, by Application 2020 & 2033
- Table 65: GCC Marine Display Revenue (billion) Forecast, by Application 2020 & 2033
- Table 66: GCC Marine Display Volume (K) Forecast, by Application 2020 & 2033
- Table 67: North Africa Marine Display Revenue (billion) Forecast, by Application 2020 & 2033
- Table 68: North Africa Marine Display Volume (K) Forecast, by Application 2020 & 2033
- Table 69: South Africa Marine Display Revenue (billion) Forecast, by Application 2020 & 2033
- Table 70: South Africa Marine Display Volume (K) Forecast, by Application 2020 & 2033
- Table 71: Rest of Middle East & Africa Marine Display Revenue (billion) Forecast, by Application 2020 & 2033
- Table 72: Rest of Middle East & Africa Marine Display Volume (K) Forecast, by Application 2020 & 2033
- Table 73: Global Marine Display Revenue billion Forecast, by Application 2020 & 2033
- Table 74: Global Marine Display Volume K Forecast, by Application 2020 & 2033
- Table 75: Global Marine Display Revenue billion Forecast, by Types 2020 & 2033
- Table 76: Global Marine Display Volume K Forecast, by Types 2020 & 2033
- Table 77: Global Marine Display Revenue billion Forecast, by Country 2020 & 2033
- Table 78: Global Marine Display Volume K Forecast, by Country 2020 & 2033
- Table 79: China Marine Display Revenue (billion) Forecast, by Application 2020 & 2033
- Table 80: China Marine Display Volume (K) Forecast, by Application 2020 & 2033
- Table 81: India Marine Display Revenue (billion) Forecast, by Application 2020 & 2033
- Table 82: India Marine Display Volume (K) Forecast, by Application 2020 & 2033
- Table 83: Japan Marine Display Revenue (billion) Forecast, by Application 2020 & 2033
- Table 84: Japan Marine Display Volume (K) Forecast, by Application 2020 & 2033
- Table 85: South Korea Marine Display Revenue (billion) Forecast, by Application 2020 & 2033
- Table 86: South Korea Marine Display Volume (K) Forecast, by Application 2020 & 2033
- Table 87: ASEAN Marine Display Revenue (billion) Forecast, by Application 2020 & 2033
- Table 88: ASEAN Marine Display Volume (K) Forecast, by Application 2020 & 2033
- Table 89: Oceania Marine Display Revenue (billion) Forecast, by Application 2020 & 2033
- Table 90: Oceania Marine Display Volume (K) Forecast, by Application 2020 & 2033
- Table 91: Rest of Asia Pacific Marine Display Revenue (billion) Forecast, by Application 2020 & 2033
- Table 92: Rest of Asia Pacific Marine Display Volume (K) Forecast, by Application 2020 & 2033
Frequently Asked Questions
1. What is the projected Compound Annual Growth Rate (CAGR) of the Marine Display?
The projected CAGR is approximately 9.79%.
2. Which companies are prominent players in the Marine Display?
Key companies in the market include FURUNO, Volvo Penta, Garmin, Litemax, Veethree Group, Nauticomp Inc, Winmate Inc, MarineNav Ltd, Simrad Yachting, Moxa, Honda, Noris, AbraxSys Corporation, EIZO Corporation, Beijer Electronics, Secu6 Technology Co, Marine Data Systems Limited, Veratron, B and G, Lowrance, Raymarine.
3. What are the main segments of the Marine Display?
The market segments include Application, Types.
4. Can you provide details about the market size?
The market size is estimated to be USD 6.19 billion as of 2022.
5. What are some drivers contributing to market growth?
N/A
6. What are the notable trends driving market growth?
N/A
7. Are there any restraints impacting market growth?
N/A
8. Can you provide examples of recent developments in the market?
N/A
9. What pricing options are available for accessing the report?
Pricing options include single-user, multi-user, and enterprise licenses priced at USD 3350.00, USD 5025.00, and USD 6700.00 respectively.
10. Is the market size provided in terms of value or volume?
The market size is provided in terms of value, measured in billion and volume, measured in K.
11. Are there any specific market keywords associated with the report?
Yes, the market keyword associated with the report is "Marine Display," which aids in identifying and referencing the specific market segment covered.
12. How do I determine which pricing option suits my needs best?
The pricing options vary based on user requirements and access needs. Individual users may opt for single-user licenses, while businesses requiring broader access may choose multi-user or enterprise licenses for cost-effective access to the report.
13. Are there any additional resources or data provided in the Marine Display report?
While the report offers comprehensive insights, it's advisable to review the specific contents or supplementary materials provided to ascertain if additional resources or data are available.
14. How can I stay updated on further developments or reports in the Marine Display?
To stay informed about further developments, trends, and reports in the Marine Display, consider subscribing to industry newsletters, following relevant companies and organizations, or regularly checking reputable industry news sources and publications.
Methodology
Step 1 - Identification of Relevant Samples Size from Population Database


Step 2 - Approaches for Defining Global Market Size (Value, Volume* & Price*)

Note*: In applicable scenarios
Step 3 - Data Sources
Primary Research
- Web Analytics
- Survey Reports
- Research Institute
- Latest Research Reports
- Opinion Leaders
Secondary Research
- Annual Reports
- White Paper
- Latest Press Release
- Industry Association
- Paid Database
- Investor Presentations

Step 4 - Data Triangulation
Involves using different sources of information in order to increase the validity of a study
These sources are likely to be stakeholders in a program - participants, other researchers, program staff, other community members, and so on.
Then we put all data in single framework & apply various statistical tools to find out the dynamic on the market.
During the analysis stage, feedback from the stakeholder groups would be compared to determine areas of agreement as well as areas of divergence