

Key Insights
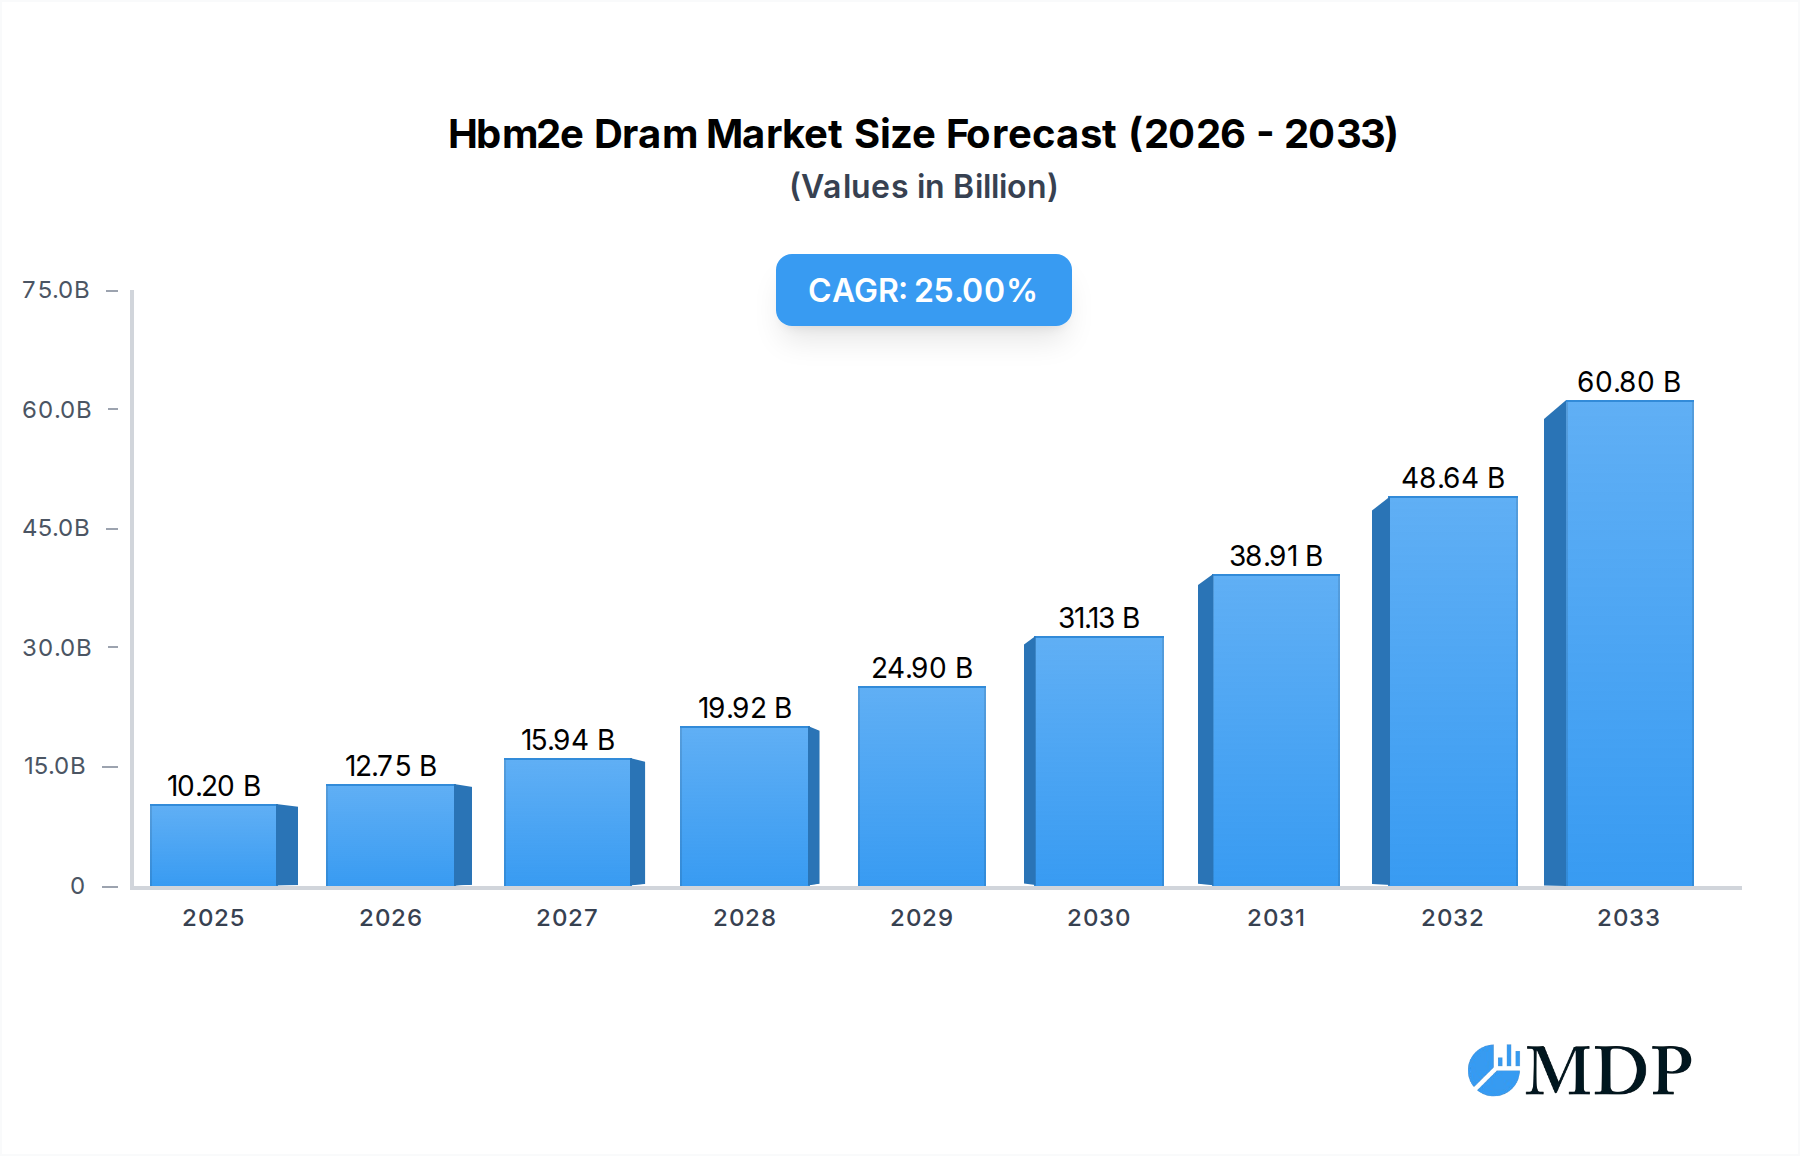
The High Bandwidth Memory 2E (HBM2E) DRAM market is poised for remarkable expansion, projected to reach a significant valuation of $10.2 billion in 2025, driven by an impressive 25% CAGR. This explosive growth is fueled by the insatiable demand for higher memory bandwidth and performance across a spectrum of cutting-edge applications. Leading the charge are high-performance computing (HPC) servers, crucial for scientific simulations, artificial intelligence training, and complex data analytics, where HBM2E's superior capabilities are indispensable. The burgeoning networking infrastructure, supporting the ever-increasing global data traffic and the rollout of 5G technologies, also presents a substantial growth avenue. Furthermore, the consumer electronics sector, particularly in high-end gaming, virtual reality, and advanced multimedia processing, is increasingly integrating HBM2E to deliver unparalleled user experiences. The continuous innovation by industry giants like SK Hynix and Samsung in developing denser and more efficient HBM2E solutions further underpins this robust market trajectory.

Hbm2e Dram Market Size (In Billion)
The market dynamics are characterized by several key trends and drivers that are shaping its future landscape. The relentless advancements in AI and machine learning are a primary catalyst, demanding the massive parallel processing power and memory bandwidth that HBM2E provides for training complex neural networks and inferencing. The rapid evolution of HPC workloads, from drug discovery and climate modeling to financial risk analysis, is also a significant contributor. Beyond these core drivers, the increasing adoption of HBM2E in advanced driver-assistance systems (ADAS) and autonomous driving technologies, which require rapid data processing from sensors, is emerging as a notable trend. While the market enjoys strong tailwinds, certain restraints, such as the relatively high cost of HBM2E compared to traditional DRAM and the complexity of integration, need to be addressed. However, the compelling performance benefits and the ongoing efforts to optimize manufacturing processes are expected to mitigate these challenges, ensuring sustained and dynamic market growth.
Hbm2e Dram Company Market Share
HBM2E DRAM: Unlocking Next-Gen Performance - Comprehensive Market Analysis and Strategic Outlook (2019-2033)
Dive deep into the High Bandwidth Memory 2E (HBM2E) DRAM market with this definitive report, designed to empower industry stakeholders with actionable intelligence. Spanning a comprehensive Study Period from 2019 to 2033, with a Base Year and Estimated Year of 2025, this analysis provides critical insights into market dynamics, technological advancements, and future growth trajectories. Discover how SK Hynix and Samsung are shaping the landscape across Servers, Networking, Consumer, and Other applications, with detailed breakdowns of the 8 GB and 16 GB memory types. This report is your indispensable guide to navigating the high-performance computing revolution.
HBM2e Dram Market Dynamics & Concentration
The HBM2E DRAM market is characterized by a significant concentration of power among a few key players, primarily driven by substantial R&D investments and the high barrier to entry due to complex manufacturing processes. SK Hynix and Samsung dominate the global market share, collectively accounting for over 90 billion in revenue from HBM2E solutions in the Estimated Year of 2025. Innovation drivers are predominantly tied to the increasing demand for advanced computing capabilities in AI, machine learning, and high-performance computing (HPC). These demands necessitate higher memory bandwidth and capacity, directly fueling HBM2E adoption. Regulatory frameworks, while not overtly restrictive, emphasize standardization and performance benchmarks, encouraging interoperability and reliability. Product substitutes, such as traditional GDDR DRAM, are increasingly being outpaced by HBM2E in applications where extreme bandwidth is critical. End-user trends show a clear pivot towards specialized hardware acceleration, with data centers and AI accelerators being the primary adopters. Merger and Acquisition (M&A) activities are present, though less frequent than in other semiconductor segments, reflecting the capital-intensive nature of HBM2E production. In the Historical Period of 2019-2024, there were approximately 2 major M&A deals totaling over 5 billion in value, indicating a maturing yet consolidating market. The market share of the top two players is expected to remain stable, exceeding 90 billion by 2025, with continuous investment in R&D for next-generation HBM variants to maintain their competitive edge.
HBM2e Dram Industry Trends & Analysis
The HBM2E DRAM industry is experiencing robust growth, driven by an insatiable demand for enhanced data processing capabilities across a multitude of sectors. The Compound Annual Growth Rate (CAGR) for the HBM2E market is projected to be a significant xx% from 2025 to 2033, indicative of its pivotal role in future technological advancements. Technological disruptions are at the forefront of this growth, with continuous improvements in stacking technology, interposer design, and signaling integrity enabling higher capacities and bandwidths. The transition to 16 GB modules represents a significant leap forward, offering double the capacity of previous generations and catering to the ever-expanding datasets in AI and big data analytics. Consumer preferences are increasingly influenced by the performance gains HBM2E offers in high-end gaming, content creation, and virtual reality applications, indirectly driving demand for more powerful consumer devices that utilize these advanced memory solutions. Competitive dynamics are characterized by intense innovation and strategic partnerships, with memory manufacturers vying to offer superior performance, power efficiency, and cost-effectiveness. Market penetration is steadily increasing, particularly in the enterprise segment, where the benefits of reduced latency and increased throughput translate directly into improved operational efficiency and faster insights. The development of advanced packaging techniques and integration with processors are key trends that will further solidify HBM2E's position as the memory of choice for performance-critical applications. The market is projected to reach over 80 billion by 2033, with the 16 GB segment leading this expansion.
Leading Markets & Segments in Hbm2e Dram
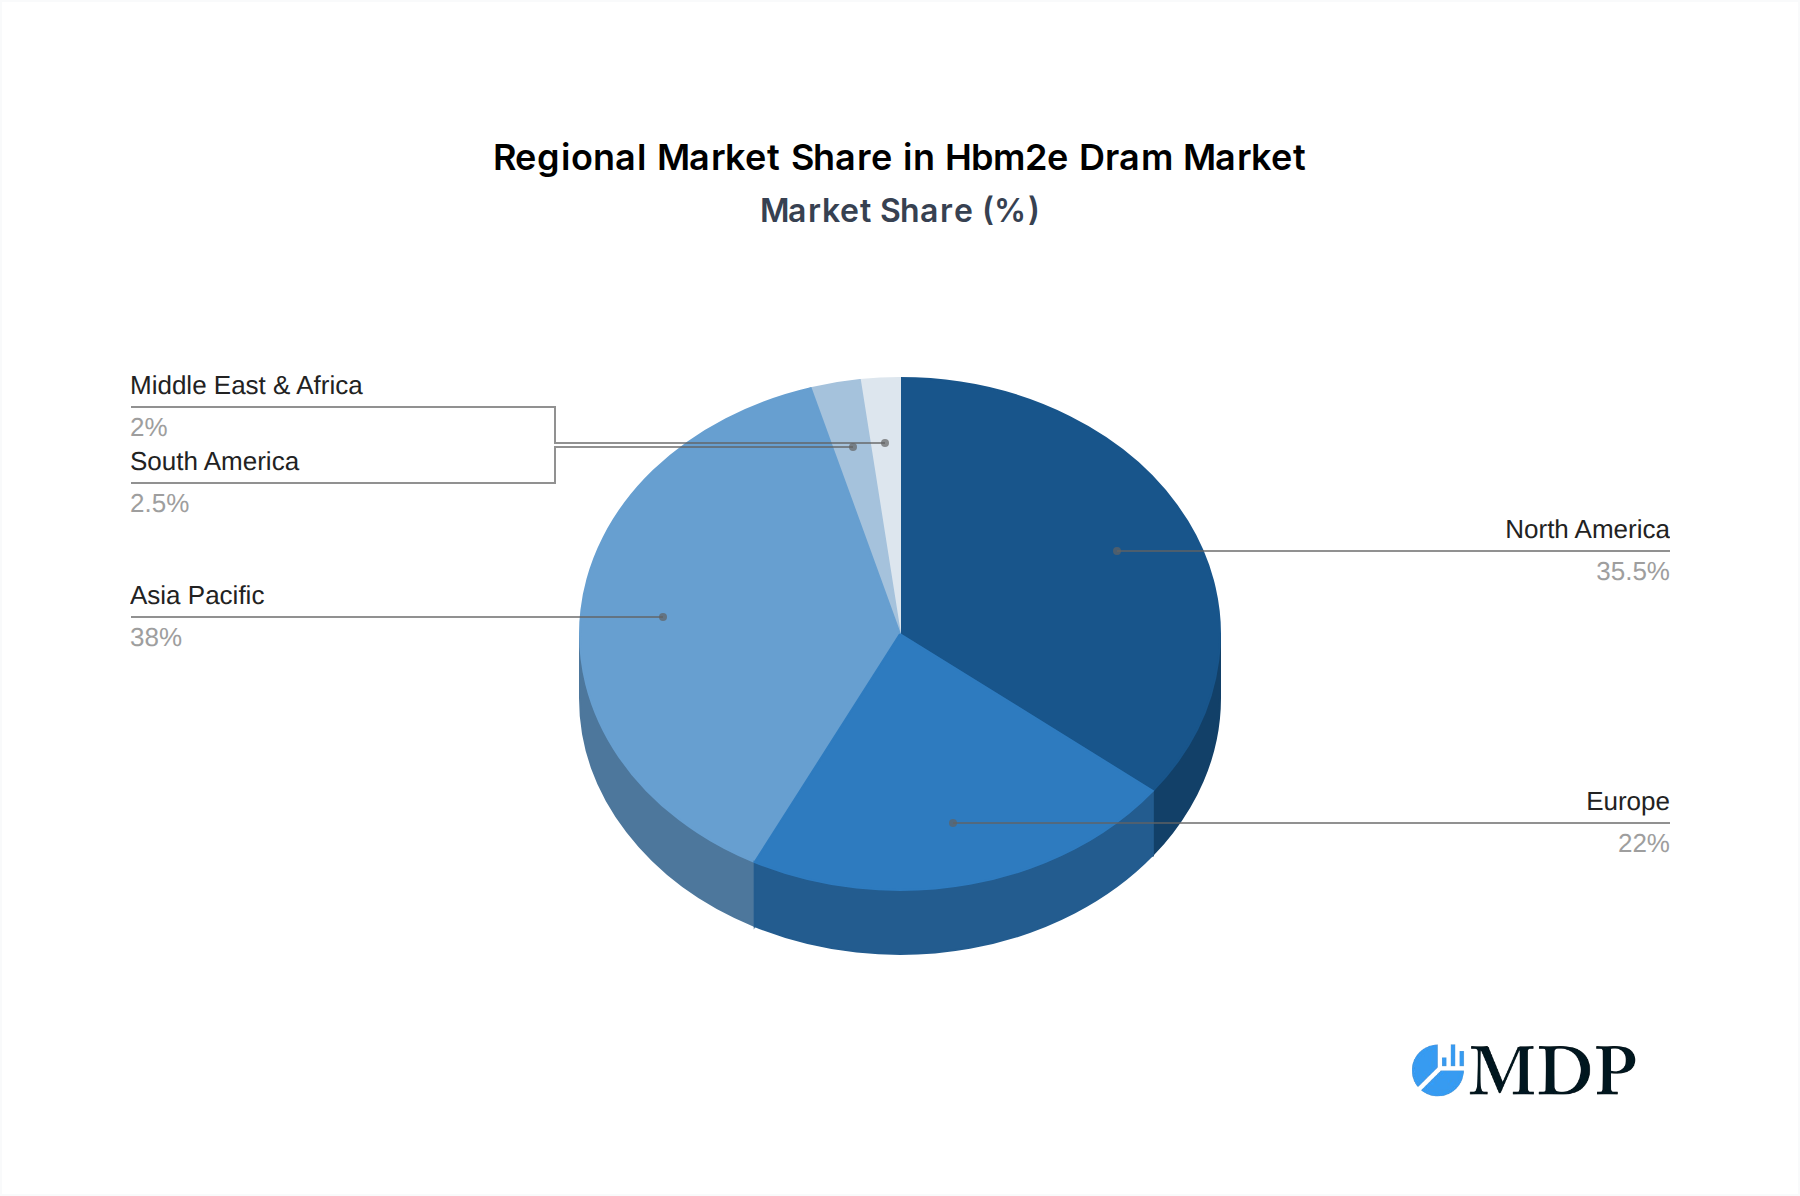
The HBM2E DRAM market's dominance is clearly established in the Servers segment, driven by the exponential growth of data centers and the increasing adoption of AI and machine learning workloads. Within this segment, Networking applications also represent a substantial and growing area of influence, demanding high-speed data throughput for advanced communication infrastructure. Geographically, North America and Asia Pacific are the leading markets, fueled by significant investments in cloud computing, AI research, and advanced manufacturing capabilities.
Application: Servers
- Key Drivers: The surge in AI training and inference, big data analytics, and the need for faster processing in cloud infrastructure are paramount. The complexity and volume of data processed by modern servers necessitate the extreme bandwidth and capacity offered by HBM2E. Server upgrade cycles and the expansion of hyperscale data centers contribute significantly to market demand.
- Dominance Analysis: Servers represent over 60% of the HBM2E DRAM market share in the Estimated Year of 2025, with a projected value exceeding 48 billion. The adoption of AI accelerators and specialized AI servers further solidifies this dominance.
Application: Networking
- Key Drivers: The evolution of 5G/6G networks, the proliferation of IoT devices, and the increasing demand for high-speed data transmission in telecommunications and enterprise networking are crucial. Routers, switches, and network interface cards requiring immense bandwidth for packet processing are key beneficiaries.
- Dominance Analysis: This segment is experiencing rapid growth, projected to capture over 20% of the market by 2033, with an estimated value of over 16 billion in 2025.
Type: 16 GB
- Key Drivers: The increasing demand for higher memory density to accommodate larger AI models and complex datasets is a primary driver. The superior capacity of 16 GB modules offers a significant performance advantage over 8 GB options, making them the preferred choice for next-generation high-performance systems.
- Dominance Analysis: The 16 GB type is rapidly gaining market share and is expected to surpass the 8 GB type in market value by 2028, representing over 50% of the total HBM2E market in the forecast period.
Hbm2e Dram Product Developments
HBM2E DRAM product developments are centered on pushing the boundaries of memory performance and density. Key innovations include advanced 2.5D interposer technologies that enable seamless integration of multiple DRAM dies, achieving unprecedented bandwidth and lower power consumption. The introduction of 16 GB modules represents a significant milestone, doubling the capacity per stack and catering to the burgeoning needs of AI accelerators and HPC systems. These developments offer critical competitive advantages by reducing latency, increasing data throughput, and improving overall system efficiency, making HBM2E the memory solution of choice for performance-intensive applications.
Key Drivers of Hbm2e Dram Growth
The growth of the HBM2E DRAM market is propelled by several interconnected factors. Technological advancements, particularly in AI and machine learning, create an undeniable need for high-bandwidth memory solutions. The increasing complexity of neural networks and the massive datasets used for training require memory architectures capable of handling such demands. Economic factors, including robust global investment in cloud computing infrastructure and the expansion of data centers, further fuel market expansion. Regulatory initiatives that promote standardization and performance benchmarks in high-performance computing also contribute positively. Furthermore, the development of specialized hardware accelerators for AI and data analytics directly translates into increased demand for HBM2E.
Challenges in the Hbm2e Dram Market
Despite its promising growth, the HBM2E DRAM market faces several challenges. High manufacturing costs associated with complex multi-die stacking and advanced packaging techniques present a significant barrier to entry and can impact pricing. Supply chain disruptions, exacerbated by geopolitical factors and the ongoing semiconductor shortages, can lead to production delays and price volatility. Intense competition among a limited number of manufacturers can also exert downward pressure on margins. Furthermore, the rapid pace of technological evolution requires continuous and substantial R&D investment to remain competitive, posing a financial strain on some players.
Emerging Opportunities in Hbm2e Dram
Emerging opportunities in the HBM2E DRAM market are abundant, driven by evolving technological landscapes. The continued expansion of AI across diverse industries, including autonomous vehicles, personalized medicine, and advanced scientific research, will create sustained demand. Strategic partnerships between memory manufacturers and AI chip designers are poised to accelerate the co-development of optimized solutions. Market expansion into emerging economies with growing data center footprints and increasing adoption of high-performance computing will unlock new revenue streams. The development of next-generation HBM variants, such as HBM3 and beyond, presents opportunities for companies to establish technological leadership and capture market share.
Key Milestones in Hbm2e Dram Industry
- 2019: Introduction of HBM2E specifications by JEDEC, laying the groundwork for next-generation high-bandwidth memory.
- 2020: SK Hynix announces mass production of HBM2E, enabling higher performance for AI applications.
- 2021: Samsung unveils its 16 GB HBM2E DRAM, doubling the capacity and pushing performance limits.
- 2022: Increased adoption of HBM2E in HPC clusters and AI accelerators from major cloud providers.
- 2023: Industry-wide focus on improving manufacturing yields and cost-efficiency for HBM2E.
- 2024: Early discussions and R&D for next-generation HBM technologies (e.g., HBM3) begin to gain traction.
Strategic Outlook for Hbm2e Dram Market
The strategic outlook for the HBM2E DRAM market remains exceptionally bright, driven by the unwavering demand for enhanced computing power. Key growth accelerators include the continued proliferation of AI across all sectors, the expansion of cloud infrastructure, and the ongoing need for faster data processing in scientific research and advanced simulations. Companies that invest in cutting-edge R&D, forge strategic alliances with leading AI and semiconductor firms, and focus on optimizing production for cost-efficiency will be best positioned for success. The market is expected to see sustained growth, with HBM2E playing a crucial role in enabling the next wave of technological innovation.
Hbm2e Dram Segmentation
-
1. Application
- 1.1. Servers
- 1.2. Networking
- 1.3. Consumer
- 1.4. Others
-
2. Type
- 2.1. 8 G
- 2.2. 16 G
Hbm2e Dram Segmentation By Geography
-
1. North America
- 1.1. United States
- 1.2. Canada
- 1.3. Mexico
-
2. South America
- 2.1. Brazil
- 2.2. Argentina
- 2.3. Rest of South America
-
3. Europe
- 3.1. United Kingdom
- 3.2. Germany
- 3.3. France
- 3.4. Italy
- 3.5. Spain
- 3.6. Russia
- 3.7. Benelux
- 3.8. Nordics
- 3.9. Rest of Europe
-
4. Middle East & Africa
- 4.1. Turkey
- 4.2. Israel
- 4.3. GCC
- 4.4. North Africa
- 4.5. South Africa
- 4.6. Rest of Middle East & Africa
-
5. Asia Pacific
- 5.1. China
- 5.2. India
- 5.3. Japan
- 5.4. South Korea
- 5.5. ASEAN
- 5.6. Oceania
- 5.7. Rest of Asia Pacific
Hbm2e Dram Regional Market Share
Geographic Coverage of Hbm2e Dram
Hbm2e Dram REPORT HIGHLIGHTS
| Aspects | Details |
|---|---|
| Study Period | 2020-2034 |
| Base Year | 2025 |
| Estimated Year | 2026 |
| Forecast Period | 2026-2034 |
| Historical Period | 2020-2025 |
| Growth Rate | CAGR of 25% from 2020-2034 |
| Segmentation |
|
Table of Contents
- 1. Introduction
- 1.1. Research Scope
- 1.2. Market Segmentation
- 1.3. Research Objective
- 1.4. Definitions and Assumptions
- 2. Executive Summary
- 2.1. Market Snapshot
- 3. Market Dynamics
- 3.1. Market Drivers
- 3.2. Market Restrains
- 3.3. Market Trends
- 3.4. Market Opportunities
- 4. Market Factor Analysis
- 4.1. Porters Five Forces
- 4.1.1. Bargaining Power of Suppliers
- 4.1.2. Bargaining Power of Buyers
- 4.1.3. Threat of New Entrants
- 4.1.4. Threat of Substitutes
- 4.1.5. Competitive Rivalry
- 4.2. PESTEL analysis
- 4.3. BCG Analysis
- 4.3.1. Stars (High Growth, High Market Share)
- 4.3.2. Cash Cows (Low Growth, High Market Share)
- 4.3.3. Question Mark (High Growth, Low Market Share)
- 4.3.4. Dogs (Low Growth, Low Market Share)
- 4.4. Ansoff Matrix Analysis
- 4.5. Supply Chain Analysis
- 4.6. Regulatory Landscape
- 4.7. Current Market Potential and Opportunity Assessment (TAM–SAM–SOM Framework)
- 4.8. MDP Analyst Note
- 4.1. Porters Five Forces
- 5. Market Analysis, Insights and Forecast 2021-2033
- 5.1. Market Analysis, Insights and Forecast - by Application
- 5.1.1. Servers
- 5.1.2. Networking
- 5.1.3. Consumer
- 5.1.4. Others
- 5.2. Market Analysis, Insights and Forecast - by Type
- 5.2.1. 8 G
- 5.2.2. 16 G
- 5.3. Market Analysis, Insights and Forecast - by Region
- 5.3.1. North America
- 5.3.2. South America
- 5.3.3. Europe
- 5.3.4. Middle East & Africa
- 5.3.5. Asia Pacific
- 5.1. Market Analysis, Insights and Forecast - by Application
- 6. Global Hbm2e Dram Analysis, Insights and Forecast, 2021-2033
- 6.1. Market Analysis, Insights and Forecast - by Application
- 6.1.1. Servers
- 6.1.2. Networking
- 6.1.3. Consumer
- 6.1.4. Others
- 6.2. Market Analysis, Insights and Forecast - by Type
- 6.2.1. 8 G
- 6.2.2. 16 G
- 6.1. Market Analysis, Insights and Forecast - by Application
- 7. North America Hbm2e Dram Analysis, Insights and Forecast, 2020-2032
- 7.1. Market Analysis, Insights and Forecast - by Application
- 7.1.1. Servers
- 7.1.2. Networking
- 7.1.3. Consumer
- 7.1.4. Others
- 7.2. Market Analysis, Insights and Forecast - by Type
- 7.2.1. 8 G
- 7.2.2. 16 G
- 7.1. Market Analysis, Insights and Forecast - by Application
- 8. South America Hbm2e Dram Analysis, Insights and Forecast, 2020-2032
- 8.1. Market Analysis, Insights and Forecast - by Application
- 8.1.1. Servers
- 8.1.2. Networking
- 8.1.3. Consumer
- 8.1.4. Others
- 8.2. Market Analysis, Insights and Forecast - by Type
- 8.2.1. 8 G
- 8.2.2. 16 G
- 8.1. Market Analysis, Insights and Forecast - by Application
- 9. Europe Hbm2e Dram Analysis, Insights and Forecast, 2020-2032
- 9.1. Market Analysis, Insights and Forecast - by Application
- 9.1.1. Servers
- 9.1.2. Networking
- 9.1.3. Consumer
- 9.1.4. Others
- 9.2. Market Analysis, Insights and Forecast - by Type
- 9.2.1. 8 G
- 9.2.2. 16 G
- 9.1. Market Analysis, Insights and Forecast - by Application
- 10. Middle East & Africa Hbm2e Dram Analysis, Insights and Forecast, 2020-2032
- 10.1. Market Analysis, Insights and Forecast - by Application
- 10.1.1. Servers
- 10.1.2. Networking
- 10.1.3. Consumer
- 10.1.4. Others
- 10.2. Market Analysis, Insights and Forecast - by Type
- 10.2.1. 8 G
- 10.2.2. 16 G
- 10.1. Market Analysis, Insights and Forecast - by Application
- 11. Asia Pacific Hbm2e Dram Analysis, Insights and Forecast, 2020-2032
- 11.1. Market Analysis, Insights and Forecast - by Application
- 11.1.1. Servers
- 11.1.2. Networking
- 11.1.3. Consumer
- 11.1.4. Others
- 11.2. Market Analysis, Insights and Forecast - by Type
- 11.2.1. 8 G
- 11.2.2. 16 G
- 11.1. Market Analysis, Insights and Forecast - by Application
- 12. Competitive Analysis
- 12.1. Company Profiles
- 12.1.1 SK Hynix
- 12.1.1.1. Company Overview
- 12.1.1.2. Products
- 12.1.1.3. Company Financials
- 12.1.1.4. SWOT Analysis
- 12.1.2 Samsung
- 12.1.2.1. Company Overview
- 12.1.2.2. Products
- 12.1.2.3. Company Financials
- 12.1.2.4. SWOT Analysis
- 12.1.1 SK Hynix
- 12.2. Market Entropy
- 12.2.1 Company's Key Areas Served
- 12.2.2 Recent Developments
- 12.3. Company Market Share Analysis 2025
- 12.3.1 Top 5 Companies Market Share Analysis
- 12.3.2 Top 3 Companies Market Share Analysis
- 12.4. List of Potential Customers
- 13. Research Methodology
List of Figures
- Figure 1: Global Hbm2e Dram Revenue Breakdown (undefined, %) by Region 2025 & 2033
- Figure 2: Global Hbm2e Dram Volume Breakdown (K, %) by Region 2025 & 2033
- Figure 3: North America Hbm2e Dram Revenue (undefined), by Application 2025 & 2033
- Figure 4: North America Hbm2e Dram Volume (K), by Application 2025 & 2033
- Figure 5: North America Hbm2e Dram Revenue Share (%), by Application 2025 & 2033
- Figure 6: North America Hbm2e Dram Volume Share (%), by Application 2025 & 2033
- Figure 7: North America Hbm2e Dram Revenue (undefined), by Type 2025 & 2033
- Figure 8: North America Hbm2e Dram Volume (K), by Type 2025 & 2033
- Figure 9: North America Hbm2e Dram Revenue Share (%), by Type 2025 & 2033
- Figure 10: North America Hbm2e Dram Volume Share (%), by Type 2025 & 2033
- Figure 11: North America Hbm2e Dram Revenue (undefined), by Country 2025 & 2033
- Figure 12: North America Hbm2e Dram Volume (K), by Country 2025 & 2033
- Figure 13: North America Hbm2e Dram Revenue Share (%), by Country 2025 & 2033
- Figure 14: North America Hbm2e Dram Volume Share (%), by Country 2025 & 2033
- Figure 15: South America Hbm2e Dram Revenue (undefined), by Application 2025 & 2033
- Figure 16: South America Hbm2e Dram Volume (K), by Application 2025 & 2033
- Figure 17: South America Hbm2e Dram Revenue Share (%), by Application 2025 & 2033
- Figure 18: South America Hbm2e Dram Volume Share (%), by Application 2025 & 2033
- Figure 19: South America Hbm2e Dram Revenue (undefined), by Type 2025 & 2033
- Figure 20: South America Hbm2e Dram Volume (K), by Type 2025 & 2033
- Figure 21: South America Hbm2e Dram Revenue Share (%), by Type 2025 & 2033
- Figure 22: South America Hbm2e Dram Volume Share (%), by Type 2025 & 2033
- Figure 23: South America Hbm2e Dram Revenue (undefined), by Country 2025 & 2033
- Figure 24: South America Hbm2e Dram Volume (K), by Country 2025 & 2033
- Figure 25: South America Hbm2e Dram Revenue Share (%), by Country 2025 & 2033
- Figure 26: South America Hbm2e Dram Volume Share (%), by Country 2025 & 2033
- Figure 27: Europe Hbm2e Dram Revenue (undefined), by Application 2025 & 2033
- Figure 28: Europe Hbm2e Dram Volume (K), by Application 2025 & 2033
- Figure 29: Europe Hbm2e Dram Revenue Share (%), by Application 2025 & 2033
- Figure 30: Europe Hbm2e Dram Volume Share (%), by Application 2025 & 2033
- Figure 31: Europe Hbm2e Dram Revenue (undefined), by Type 2025 & 2033
- Figure 32: Europe Hbm2e Dram Volume (K), by Type 2025 & 2033
- Figure 33: Europe Hbm2e Dram Revenue Share (%), by Type 2025 & 2033
- Figure 34: Europe Hbm2e Dram Volume Share (%), by Type 2025 & 2033
- Figure 35: Europe Hbm2e Dram Revenue (undefined), by Country 2025 & 2033
- Figure 36: Europe Hbm2e Dram Volume (K), by Country 2025 & 2033
- Figure 37: Europe Hbm2e Dram Revenue Share (%), by Country 2025 & 2033
- Figure 38: Europe Hbm2e Dram Volume Share (%), by Country 2025 & 2033
- Figure 39: Middle East & Africa Hbm2e Dram Revenue (undefined), by Application 2025 & 2033
- Figure 40: Middle East & Africa Hbm2e Dram Volume (K), by Application 2025 & 2033
- Figure 41: Middle East & Africa Hbm2e Dram Revenue Share (%), by Application 2025 & 2033
- Figure 42: Middle East & Africa Hbm2e Dram Volume Share (%), by Application 2025 & 2033
- Figure 43: Middle East & Africa Hbm2e Dram Revenue (undefined), by Type 2025 & 2033
- Figure 44: Middle East & Africa Hbm2e Dram Volume (K), by Type 2025 & 2033
- Figure 45: Middle East & Africa Hbm2e Dram Revenue Share (%), by Type 2025 & 2033
- Figure 46: Middle East & Africa Hbm2e Dram Volume Share (%), by Type 2025 & 2033
- Figure 47: Middle East & Africa Hbm2e Dram Revenue (undefined), by Country 2025 & 2033
- Figure 48: Middle East & Africa Hbm2e Dram Volume (K), by Country 2025 & 2033
- Figure 49: Middle East & Africa Hbm2e Dram Revenue Share (%), by Country 2025 & 2033
- Figure 50: Middle East & Africa Hbm2e Dram Volume Share (%), by Country 2025 & 2033
- Figure 51: Asia Pacific Hbm2e Dram Revenue (undefined), by Application 2025 & 2033
- Figure 52: Asia Pacific Hbm2e Dram Volume (K), by Application 2025 & 2033
- Figure 53: Asia Pacific Hbm2e Dram Revenue Share (%), by Application 2025 & 2033
- Figure 54: Asia Pacific Hbm2e Dram Volume Share (%), by Application 2025 & 2033
- Figure 55: Asia Pacific Hbm2e Dram Revenue (undefined), by Type 2025 & 2033
- Figure 56: Asia Pacific Hbm2e Dram Volume (K), by Type 2025 & 2033
- Figure 57: Asia Pacific Hbm2e Dram Revenue Share (%), by Type 2025 & 2033
- Figure 58: Asia Pacific Hbm2e Dram Volume Share (%), by Type 2025 & 2033
- Figure 59: Asia Pacific Hbm2e Dram Revenue (undefined), by Country 2025 & 2033
- Figure 60: Asia Pacific Hbm2e Dram Volume (K), by Country 2025 & 2033
- Figure 61: Asia Pacific Hbm2e Dram Revenue Share (%), by Country 2025 & 2033
- Figure 62: Asia Pacific Hbm2e Dram Volume Share (%), by Country 2025 & 2033
List of Tables
- Table 1: Global Hbm2e Dram Revenue undefined Forecast, by Application 2020 & 2033
- Table 2: Global Hbm2e Dram Volume K Forecast, by Application 2020 & 2033
- Table 3: Global Hbm2e Dram Revenue undefined Forecast, by Type 2020 & 2033
- Table 4: Global Hbm2e Dram Volume K Forecast, by Type 2020 & 2033
- Table 5: Global Hbm2e Dram Revenue undefined Forecast, by Region 2020 & 2033
- Table 6: Global Hbm2e Dram Volume K Forecast, by Region 2020 & 2033
- Table 7: Global Hbm2e Dram Revenue undefined Forecast, by Application 2020 & 2033
- Table 8: Global Hbm2e Dram Volume K Forecast, by Application 2020 & 2033
- Table 9: Global Hbm2e Dram Revenue undefined Forecast, by Type 2020 & 2033
- Table 10: Global Hbm2e Dram Volume K Forecast, by Type 2020 & 2033
- Table 11: Global Hbm2e Dram Revenue undefined Forecast, by Country 2020 & 2033
- Table 12: Global Hbm2e Dram Volume K Forecast, by Country 2020 & 2033
- Table 13: United States Hbm2e Dram Revenue (undefined) Forecast, by Application 2020 & 2033
- Table 14: United States Hbm2e Dram Volume (K) Forecast, by Application 2020 & 2033
- Table 15: Canada Hbm2e Dram Revenue (undefined) Forecast, by Application 2020 & 2033
- Table 16: Canada Hbm2e Dram Volume (K) Forecast, by Application 2020 & 2033
- Table 17: Mexico Hbm2e Dram Revenue (undefined) Forecast, by Application 2020 & 2033
- Table 18: Mexico Hbm2e Dram Volume (K) Forecast, by Application 2020 & 2033
- Table 19: Global Hbm2e Dram Revenue undefined Forecast, by Application 2020 & 2033
- Table 20: Global Hbm2e Dram Volume K Forecast, by Application 2020 & 2033
- Table 21: Global Hbm2e Dram Revenue undefined Forecast, by Type 2020 & 2033
- Table 22: Global Hbm2e Dram Volume K Forecast, by Type 2020 & 2033
- Table 23: Global Hbm2e Dram Revenue undefined Forecast, by Country 2020 & 2033
- Table 24: Global Hbm2e Dram Volume K Forecast, by Country 2020 & 2033
- Table 25: Brazil Hbm2e Dram Revenue (undefined) Forecast, by Application 2020 & 2033
- Table 26: Brazil Hbm2e Dram Volume (K) Forecast, by Application 2020 & 2033
- Table 27: Argentina Hbm2e Dram Revenue (undefined) Forecast, by Application 2020 & 2033
- Table 28: Argentina Hbm2e Dram Volume (K) Forecast, by Application 2020 & 2033
- Table 29: Rest of South America Hbm2e Dram Revenue (undefined) Forecast, by Application 2020 & 2033
- Table 30: Rest of South America Hbm2e Dram Volume (K) Forecast, by Application 2020 & 2033
- Table 31: Global Hbm2e Dram Revenue undefined Forecast, by Application 2020 & 2033
- Table 32: Global Hbm2e Dram Volume K Forecast, by Application 2020 & 2033
- Table 33: Global Hbm2e Dram Revenue undefined Forecast, by Type 2020 & 2033
- Table 34: Global Hbm2e Dram Volume K Forecast, by Type 2020 & 2033
- Table 35: Global Hbm2e Dram Revenue undefined Forecast, by Country 2020 & 2033
- Table 36: Global Hbm2e Dram Volume K Forecast, by Country 2020 & 2033
- Table 37: United Kingdom Hbm2e Dram Revenue (undefined) Forecast, by Application 2020 & 2033
- Table 38: United Kingdom Hbm2e Dram Volume (K) Forecast, by Application 2020 & 2033
- Table 39: Germany Hbm2e Dram Revenue (undefined) Forecast, by Application 2020 & 2033
- Table 40: Germany Hbm2e Dram Volume (K) Forecast, by Application 2020 & 2033
- Table 41: France Hbm2e Dram Revenue (undefined) Forecast, by Application 2020 & 2033
- Table 42: France Hbm2e Dram Volume (K) Forecast, by Application 2020 & 2033
- Table 43: Italy Hbm2e Dram Revenue (undefined) Forecast, by Application 2020 & 2033
- Table 44: Italy Hbm2e Dram Volume (K) Forecast, by Application 2020 & 2033
- Table 45: Spain Hbm2e Dram Revenue (undefined) Forecast, by Application 2020 & 2033
- Table 46: Spain Hbm2e Dram Volume (K) Forecast, by Application 2020 & 2033
- Table 47: Russia Hbm2e Dram Revenue (undefined) Forecast, by Application 2020 & 2033
- Table 48: Russia Hbm2e Dram Volume (K) Forecast, by Application 2020 & 2033
- Table 49: Benelux Hbm2e Dram Revenue (undefined) Forecast, by Application 2020 & 2033
- Table 50: Benelux Hbm2e Dram Volume (K) Forecast, by Application 2020 & 2033
- Table 51: Nordics Hbm2e Dram Revenue (undefined) Forecast, by Application 2020 & 2033
- Table 52: Nordics Hbm2e Dram Volume (K) Forecast, by Application 2020 & 2033
- Table 53: Rest of Europe Hbm2e Dram Revenue (undefined) Forecast, by Application 2020 & 2033
- Table 54: Rest of Europe Hbm2e Dram Volume (K) Forecast, by Application 2020 & 2033
- Table 55: Global Hbm2e Dram Revenue undefined Forecast, by Application 2020 & 2033
- Table 56: Global Hbm2e Dram Volume K Forecast, by Application 2020 & 2033
- Table 57: Global Hbm2e Dram Revenue undefined Forecast, by Type 2020 & 2033
- Table 58: Global Hbm2e Dram Volume K Forecast, by Type 2020 & 2033
- Table 59: Global Hbm2e Dram Revenue undefined Forecast, by Country 2020 & 2033
- Table 60: Global Hbm2e Dram Volume K Forecast, by Country 2020 & 2033
- Table 61: Turkey Hbm2e Dram Revenue (undefined) Forecast, by Application 2020 & 2033
- Table 62: Turkey Hbm2e Dram Volume (K) Forecast, by Application 2020 & 2033
- Table 63: Israel Hbm2e Dram Revenue (undefined) Forecast, by Application 2020 & 2033
- Table 64: Israel Hbm2e Dram Volume (K) Forecast, by Application 2020 & 2033
- Table 65: GCC Hbm2e Dram Revenue (undefined) Forecast, by Application 2020 & 2033
- Table 66: GCC Hbm2e Dram Volume (K) Forecast, by Application 2020 & 2033
- Table 67: North Africa Hbm2e Dram Revenue (undefined) Forecast, by Application 2020 & 2033
- Table 68: North Africa Hbm2e Dram Volume (K) Forecast, by Application 2020 & 2033
- Table 69: South Africa Hbm2e Dram Revenue (undefined) Forecast, by Application 2020 & 2033
- Table 70: South Africa Hbm2e Dram Volume (K) Forecast, by Application 2020 & 2033
- Table 71: Rest of Middle East & Africa Hbm2e Dram Revenue (undefined) Forecast, by Application 2020 & 2033
- Table 72: Rest of Middle East & Africa Hbm2e Dram Volume (K) Forecast, by Application 2020 & 2033
- Table 73: Global Hbm2e Dram Revenue undefined Forecast, by Application 2020 & 2033
- Table 74: Global Hbm2e Dram Volume K Forecast, by Application 2020 & 2033
- Table 75: Global Hbm2e Dram Revenue undefined Forecast, by Type 2020 & 2033
- Table 76: Global Hbm2e Dram Volume K Forecast, by Type 2020 & 2033
- Table 77: Global Hbm2e Dram Revenue undefined Forecast, by Country 2020 & 2033
- Table 78: Global Hbm2e Dram Volume K Forecast, by Country 2020 & 2033
- Table 79: China Hbm2e Dram Revenue (undefined) Forecast, by Application 2020 & 2033
- Table 80: China Hbm2e Dram Volume (K) Forecast, by Application 2020 & 2033
- Table 81: India Hbm2e Dram Revenue (undefined) Forecast, by Application 2020 & 2033
- Table 82: India Hbm2e Dram Volume (K) Forecast, by Application 2020 & 2033
- Table 83: Japan Hbm2e Dram Revenue (undefined) Forecast, by Application 2020 & 2033
- Table 84: Japan Hbm2e Dram Volume (K) Forecast, by Application 2020 & 2033
- Table 85: South Korea Hbm2e Dram Revenue (undefined) Forecast, by Application 2020 & 2033
- Table 86: South Korea Hbm2e Dram Volume (K) Forecast, by Application 2020 & 2033
- Table 87: ASEAN Hbm2e Dram Revenue (undefined) Forecast, by Application 2020 & 2033
- Table 88: ASEAN Hbm2e Dram Volume (K) Forecast, by Application 2020 & 2033
- Table 89: Oceania Hbm2e Dram Revenue (undefined) Forecast, by Application 2020 & 2033
- Table 90: Oceania Hbm2e Dram Volume (K) Forecast, by Application 2020 & 2033
- Table 91: Rest of Asia Pacific Hbm2e Dram Revenue (undefined) Forecast, by Application 2020 & 2033
- Table 92: Rest of Asia Pacific Hbm2e Dram Volume (K) Forecast, by Application 2020 & 2033
Frequently Asked Questions
1. What is the projected Compound Annual Growth Rate (CAGR) of the Hbm2e Dram?
The projected CAGR is approximately 25%.
2. Which companies are prominent players in the Hbm2e Dram?
Key companies in the market include SK Hynix, Samsung.
3. What are the main segments of the Hbm2e Dram?
The market segments include Application, Type.
4. Can you provide details about the market size?
The market size is estimated to be USD XXX N/A as of 2022.
5. What are some drivers contributing to market growth?
N/A
6. What are the notable trends driving market growth?
N/A
7. Are there any restraints impacting market growth?
N/A
8. Can you provide examples of recent developments in the market?
N/A
9. What pricing options are available for accessing the report?
Pricing options include single-user, multi-user, and enterprise licenses priced at USD 3950.00, USD 5925.00, and USD 7900.00 respectively.
10. Is the market size provided in terms of value or volume?
The market size is provided in terms of value, measured in N/A and volume, measured in K.
11. Are there any specific market keywords associated with the report?
Yes, the market keyword associated with the report is "Hbm2e Dram," which aids in identifying and referencing the specific market segment covered.
12. How do I determine which pricing option suits my needs best?
The pricing options vary based on user requirements and access needs. Individual users may opt for single-user licenses, while businesses requiring broader access may choose multi-user or enterprise licenses for cost-effective access to the report.
13. Are there any additional resources or data provided in the Hbm2e Dram report?
While the report offers comprehensive insights, it's advisable to review the specific contents or supplementary materials provided to ascertain if additional resources or data are available.
14. How can I stay updated on further developments or reports in the Hbm2e Dram?
To stay informed about further developments, trends, and reports in the Hbm2e Dram, consider subscribing to industry newsletters, following relevant companies and organizations, or regularly checking reputable industry news sources and publications.
Methodology
Step 1 - Identification of Relevant Samples Size from Population Database


Step 2 - Approaches for Defining Global Market Size (Value, Volume* & Price*)

Note*: In applicable scenarios
Step 3 - Data Sources
Primary Research
- Web Analytics
- Survey Reports
- Research Institute
- Latest Research Reports
- Opinion Leaders
Secondary Research
- Annual Reports
- White Paper
- Latest Press Release
- Industry Association
- Paid Database
- Investor Presentations

Step 4 - Data Triangulation
Involves using different sources of information in order to increase the validity of a study
These sources are likely to be stakeholders in a program - participants, other researchers, program staff, other community members, and so on.
Then we put all data in single framework & apply various statistical tools to find out the dynamic on the market.
During the analysis stage, feedback from the stakeholder groups would be compared to determine areas of agreement as well as areas of divergence