

Key Insights
The global market for Graphene and 2D Materials is poised for substantial expansion, projected to reach approximately USD 1.22 billion in 2025. This growth is fueled by a remarkable Compound Annual Growth Rate (CAGR) of 24% anticipated between 2025 and 2033. The increasing adoption of graphene in advanced applications across diverse industries is a primary driver. In the Paints and Coatings sector, graphene enhances durability, corrosion resistance, and thermal conductivity, leading to superior product performance. The Energy Storage segment is witnessing significant demand for graphene in batteries and supercapacitors due to its exceptional electrical conductivity and surface area, promising faster charging times and higher energy densities. Furthermore, the Electronics and Semiconductors industry leverages graphene's unique electronic properties for next-generation devices, while the Photovoltaics sector is exploring its potential to improve solar cell efficiency. The Healthcare industry is benefiting from graphene's biocompatibility and antimicrobial properties for drug delivery systems and biosensors.
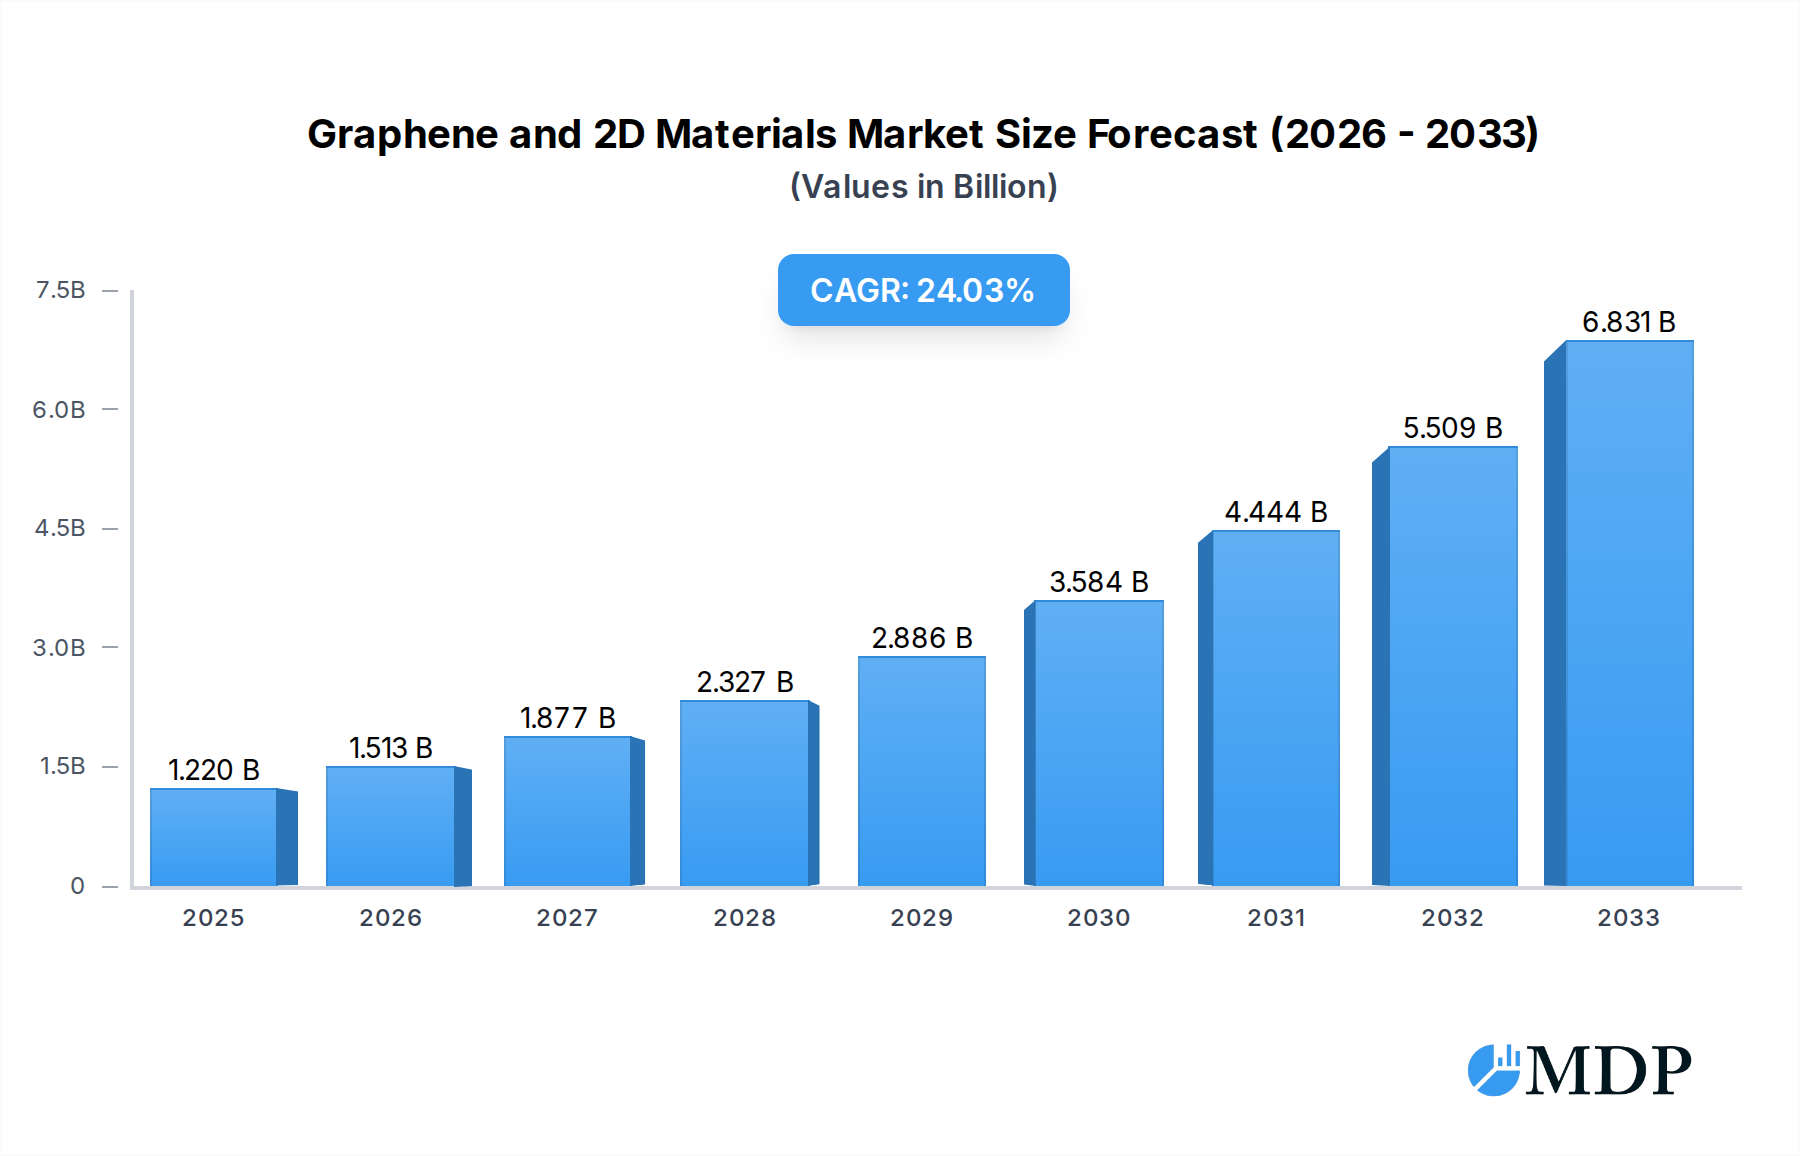
Graphene and 2D Materials Market Size (In Billion)
Emerging trends like the development of novel graphene production techniques and the exploration of its use in flexible electronics, advanced composites, and wearable technology are further propelling market growth. The demand for graphene as an intermediate product, ready for integration into various manufacturing processes, is also rising. However, challenges such as the high cost of production and standardization issues continue to influence market dynamics. Despite these restraints, the inherent versatility and superior properties of graphene and other 2D materials are creating significant opportunities. Key players are investing heavily in research and development to overcome these hurdles and unlock the full potential of these advanced materials, particularly in regions like Asia Pacific, which is emerging as a manufacturing powerhouse.

Graphene and 2D Materials Company Market Share
Graphene and 2D Materials Market: Unlocking Billion-Dollar Opportunities (2019-2033)
Report Description:
Dive deep into the revolutionary Graphene and 2D Materials market, a sector poised for explosive growth, projected to reach billions by 2033. This comprehensive report analyzes the intricate market dynamics, cutting-edge industry trends, and strategic landscape of this transformative technology. Explore the vast applications spanning Paints and Coatings, Energy Storage, Electronics and Semiconductors, Photovoltaics, Healthcare, and the Textile Industry, while understanding the nuances of Graphene Material, Intermediate Product, and Embedded Graphene types. With a Study Period from 2019–2033, Base Year and Estimated Year of 2025, and a robust Forecast Period of 2025–2033, this report provides unparalleled insights for industry stakeholders, investors, and researchers.
Uncover the strategies of key players including Anaphite, CamGraPhic, Directa Plus, First Graphene, Global Graphene Group, Graphjet Technology, Grapheal, Graphex Group, Haydale Graphene, Graphmatech, Huvis, Lyten, NanoXplore, Paragraf, SafeLi LLC, Saint Jean Carbon, Versarien, Talga Resources, and gain an understanding of their market share and M&A activities. This report is your definitive guide to navigating the future of advanced materials, identifying billion-dollar opportunities, and staying ahead in this dynamic and innovation-driven market.
Graphene and 2D Materials Market Dynamics & Concentration
The global graphene and 2D materials market is characterized by a moderate to high level of concentration, with a few key innovators and manufacturers holding significant market share, estimated at over sixty percent. Innovation drivers are primarily fueled by advancements in synthesis techniques, leading to higher quality and more cost-effective production of graphene and other 2D materials like hexagonal boron nitride (h-BN) and transition metal dichalcogenides (TMDs). Regulatory frameworks, while still evolving, are increasingly focusing on standardization and safety protocols, influencing product development and market entry. Product substitutes, such as advanced composites and carbon nanotubes, present a competitive landscape, but the unique properties of graphene, including its exceptional electrical conductivity and mechanical strength, continue to give it a distinct advantage in many high-performance applications. End-user trends are increasingly demanding materials with enhanced properties for applications in energy storage, electronics, and aerospace, driving demand for tailored graphene solutions. Mergers and acquisitions (M&A) activity, with an estimated XX deals in the historical period (2019-2024), indicates a trend towards consolidation as larger players seek to expand their portfolios and technological capabilities. The market is witnessing strategic acquisitions aimed at securing intellectual property and expanding production capacity to meet anticipated future demand.
Graphene and 2D Materials Industry Trends & Analysis
The graphene and 2D materials industry is experiencing a period of rapid growth, driven by an escalating demand for advanced materials with superior performance characteristics across a multitude of sectors. The compound annual growth rate (CAGR) for this market is projected to be around XX% between 2025 and 2033. Technological disruptions are at the forefront, with continuous breakthroughs in graphene synthesis, such as chemical vapor deposition (CVD) and exfoliation techniques, leading to improved purity, scalability, and cost-effectiveness. These advancements are crucial for lowering the barrier to widespread adoption. Consumer preferences are shifting towards more sustainable and high-performance products, especially in areas like electric vehicles (EVs) and portable electronics, where enhanced battery life and faster charging are paramount. Graphene's exceptional properties make it an ideal candidate for these applications. The competitive dynamics are intense, with both established materials giants and agile startups vying for market dominance. Companies are investing heavily in research and development to create novel applications and enhance existing ones, focusing on differentiating their offerings through intellectual property and unique material formulations. Market penetration is steadily increasing, moving from niche, high-value applications to broader industrial uses. The integration of graphene into existing manufacturing processes is a key focus, enabling the creation of composites, coatings, and functional inks that offer significant performance upgrades. Furthermore, the development of graphene-based sensors and actuators is opening new frontiers in the Internet of Things (IoT) and smart device markets. The drive towards miniaturization and higher energy density in electronic devices is a significant market penetration catalyst, where graphene's conductivity and thermal management capabilities are indispensable. The increasing awareness of environmental sustainability is also pushing the adoption of graphene in eco-friendly coatings and advanced materials, further solidifying its growth trajectory. The evolution of production methods, moving from laboratory-scale to industrial-scale, is crucial for achieving economies of scale and making graphene accessible for widespread commercialization.
Leading Markets & Segments in Graphene and 2D Materials
The dominant region for graphene and 2D materials is currently Asia Pacific, driven by robust manufacturing capabilities, significant government investment in advanced materials research, and a rapidly growing demand from key end-user industries like electronics and automotive. Within this region, China stands out as a leading country, actively promoting graphene research and commercialization through favorable economic policies and substantial infrastructure development.
- Application Dominance:
- Energy Storage: This segment is a primary growth engine, fueled by the escalating demand for high-performance batteries in electric vehicles, portable electronics, and grid-scale energy storage solutions. Graphene's ability to enhance conductivity and capacity in lithium-ion batteries, and its potential for supercapacitors, makes it a critical material for the future of energy. Economic policies supporting renewable energy adoption directly contribute to this segment's growth.
- Electronics and Semiconductors: The unique electrical and thermal properties of graphene are revolutionizing the electronics sector. Its application in faster processors, flexible displays, and advanced sensors is a significant market driver. Government initiatives promoting technological innovation and the growth of the semiconductor industry are key factors.
- Paints and Coatings: The inclusion of graphene in paints and coatings offers enhanced durability, corrosion resistance, and conductivity, leading to applications in anti-corrosion coatings, conductive inks, and smart paints. Infrastructure development and construction projects are major contributors to this segment.
- Type Dominance:
- Graphene Material: This foundational type, encompassing pristine graphene, graphene oxide, and reduced graphene oxide, is seeing the highest market penetration as it serves as the primary input for most applications. The availability of scalable and cost-effective production methods is crucial for its dominance.
- Intermediate Product: This category, including graphene-enhanced masterbatches and inks, is gaining traction as it simplifies the integration of graphene into existing manufacturing processes, making it more accessible for various industries.
- Embedded Graphene: This emerging type, where graphene is directly integrated into the structure of materials, is witnessing strong growth in specialized applications requiring superior mechanical strength and electrical conductivity.
Graphene and 2D Materials Product Developments
Product developments in the graphene and 2D materials sector are rapidly expanding the application frontier. Innovations focus on producing higher quality graphene with tailored properties, such as specific surface areas and defect levels, for niche applications. This includes the development of graphene-based conductive inks for printed electronics, advanced composites for lightweight and high-strength applications in aerospace and automotive industries, and graphene-enhanced materials for improved thermal management in electronics. Furthermore, significant progress is being made in graphene for biomedical applications, including drug delivery systems and biosensors, leveraging its biocompatibility and unique surface chemistry. Competitive advantages are derived from proprietary synthesis methods, advanced functionalization techniques, and patented application-specific formulations that deliver superior performance compared to conventional materials.
Key Drivers of Graphene and 2D Materials Growth
The growth of the graphene and 2D materials market is propelled by several key drivers. Technological advancements in synthesis methods are continuously improving the quality and reducing the cost of graphene production, making it more commercially viable. Economic factors, such as the increasing global demand for lightweight, high-strength, and conductive materials in industries like automotive and aerospace, play a significant role. Regulatory support through government initiatives and funding for advanced materials research and development in regions like Asia Pacific and Europe is also a crucial catalyst. For instance, investments in clean energy technologies are directly boosting the demand for graphene in energy storage solutions.
Challenges in the Graphene and 2D Materials Market
Despite its immense potential, the graphene and 2D materials market faces several challenges. Scalability of production remains a hurdle; while laboratory-scale production is advanced, achieving consistent, high-volume, and cost-effective industrial production for certain types of graphene is still developing. Standardization and quality control are critical issues, as inconsistent material properties can hinder adoption in sensitive applications. High manufacturing costs compared to conventional materials can also be a barrier to widespread adoption, particularly in price-sensitive markets. Furthermore, regulatory uncertainties surrounding the long-term health and environmental impacts of nanomaterials can create hesitation for some end-users. The competitive pressure from alternative advanced materials also necessitates continuous innovation and cost reduction.
Emerging Opportunities in Graphene and 2D Materials
Emerging opportunities in the graphene and 2D materials market are abundant, driven by relentless innovation and strategic market expansion. Technological breakthroughs in producing larger, defect-free graphene flakes and developing novel functionalized graphene derivatives are opening doors to entirely new applications. Strategic partnerships between material manufacturers and end-user industries are crucial for accelerating the commercialization of graphene-based products, particularly in sectors like advanced electronics and smart textiles. Market expansion strategies are focusing on developing graphene solutions for sustainable technologies, such as advanced water filtration systems and biodegradable composites, aligning with global environmental goals. The growth of the quantum computing sector also presents a significant long-term opportunity for materials with unique electronic properties.
Leading Players in the Graphene and 2D Materials Sector
- Anaphite
- CamGraPhic
- Directa Plus
- First Graphene
- Global Graphene Group
- Graphjet Technology
- Grapheal
- Graphex Group
- Haydale Graphene
- Graphmatech
- Huvis
- Lyten
- NanoXplore
- Paragraf
- SafeLi LLC
- Saint Jean Carbon
- Versarien
- Talga Resources
Key Milestones in Graphene and 2D Materials Industry
- 2019: Launch of graphene-enhanced anti-corrosion coatings by several companies, demonstrating early commercialization in industrial applications.
- 2020: Significant advancements in chemical vapor deposition (CVD) graphene production, enabling larger-scale, higher-quality material for electronics.
- 2021: Introduction of graphene-based supercapacitors with significantly improved energy density and charging speeds, impacting the energy storage market.
- 2022: Increased venture capital funding and M&A activity, signaling growing investor confidence and market consolidation.
- 2023: Development of novel graphene applications in the healthcare sector, including advanced drug delivery systems and biosensors.
- 2024: Emergence of graphene as a key component in next-generation battery technologies for electric vehicles, promising longer range and faster charging.
Strategic Outlook for Graphene and 2D Materials Market
The strategic outlook for the graphene and 2D materials market is exceptionally positive, with growth accelerators stemming from continuous technological innovation and increasing industry adoption. The focus will remain on scaling up cost-effective production, enhancing material consistency, and developing application-specific solutions. Key strategic opportunities lie in collaborating with major players in the energy storage, electronics, and aerospace sectors to integrate graphene into their product development pipelines. The drive towards sustainability and circular economy principles will also favor graphene-based materials with improved environmental footprints. Furthermore, exploring the potential of other 2D materials in conjunction with graphene will unlock synergistic benefits and expand the overall market reach.
Graphene and 2D Materials Segmentation
-
1. Application
- 1.1. Paints and Coatings
- 1.2. Energy Storage
- 1.3. Electronics and Semiconductors
- 1.4. Photovoltaics
- 1.5. Healthcare
- 1.6. Textile Industry
-
2. Types
- 2.1. Graphene Material
- 2.2. Intermediate Product
- 2.3. Embedded Graphene
Graphene and 2D Materials Segmentation By Geography
-
1. North America
- 1.1. United States
- 1.2. Canada
- 1.3. Mexico
-
2. South America
- 2.1. Brazil
- 2.2. Argentina
- 2.3. Rest of South America
-
3. Europe
- 3.1. United Kingdom
- 3.2. Germany
- 3.3. France
- 3.4. Italy
- 3.5. Spain
- 3.6. Russia
- 3.7. Benelux
- 3.8. Nordics
- 3.9. Rest of Europe
-
4. Middle East & Africa
- 4.1. Turkey
- 4.2. Israel
- 4.3. GCC
- 4.4. North Africa
- 4.5. South Africa
- 4.6. Rest of Middle East & Africa
-
5. Asia Pacific
- 5.1. China
- 5.2. India
- 5.3. Japan
- 5.4. South Korea
- 5.5. ASEAN
- 5.6. Oceania
- 5.7. Rest of Asia Pacific
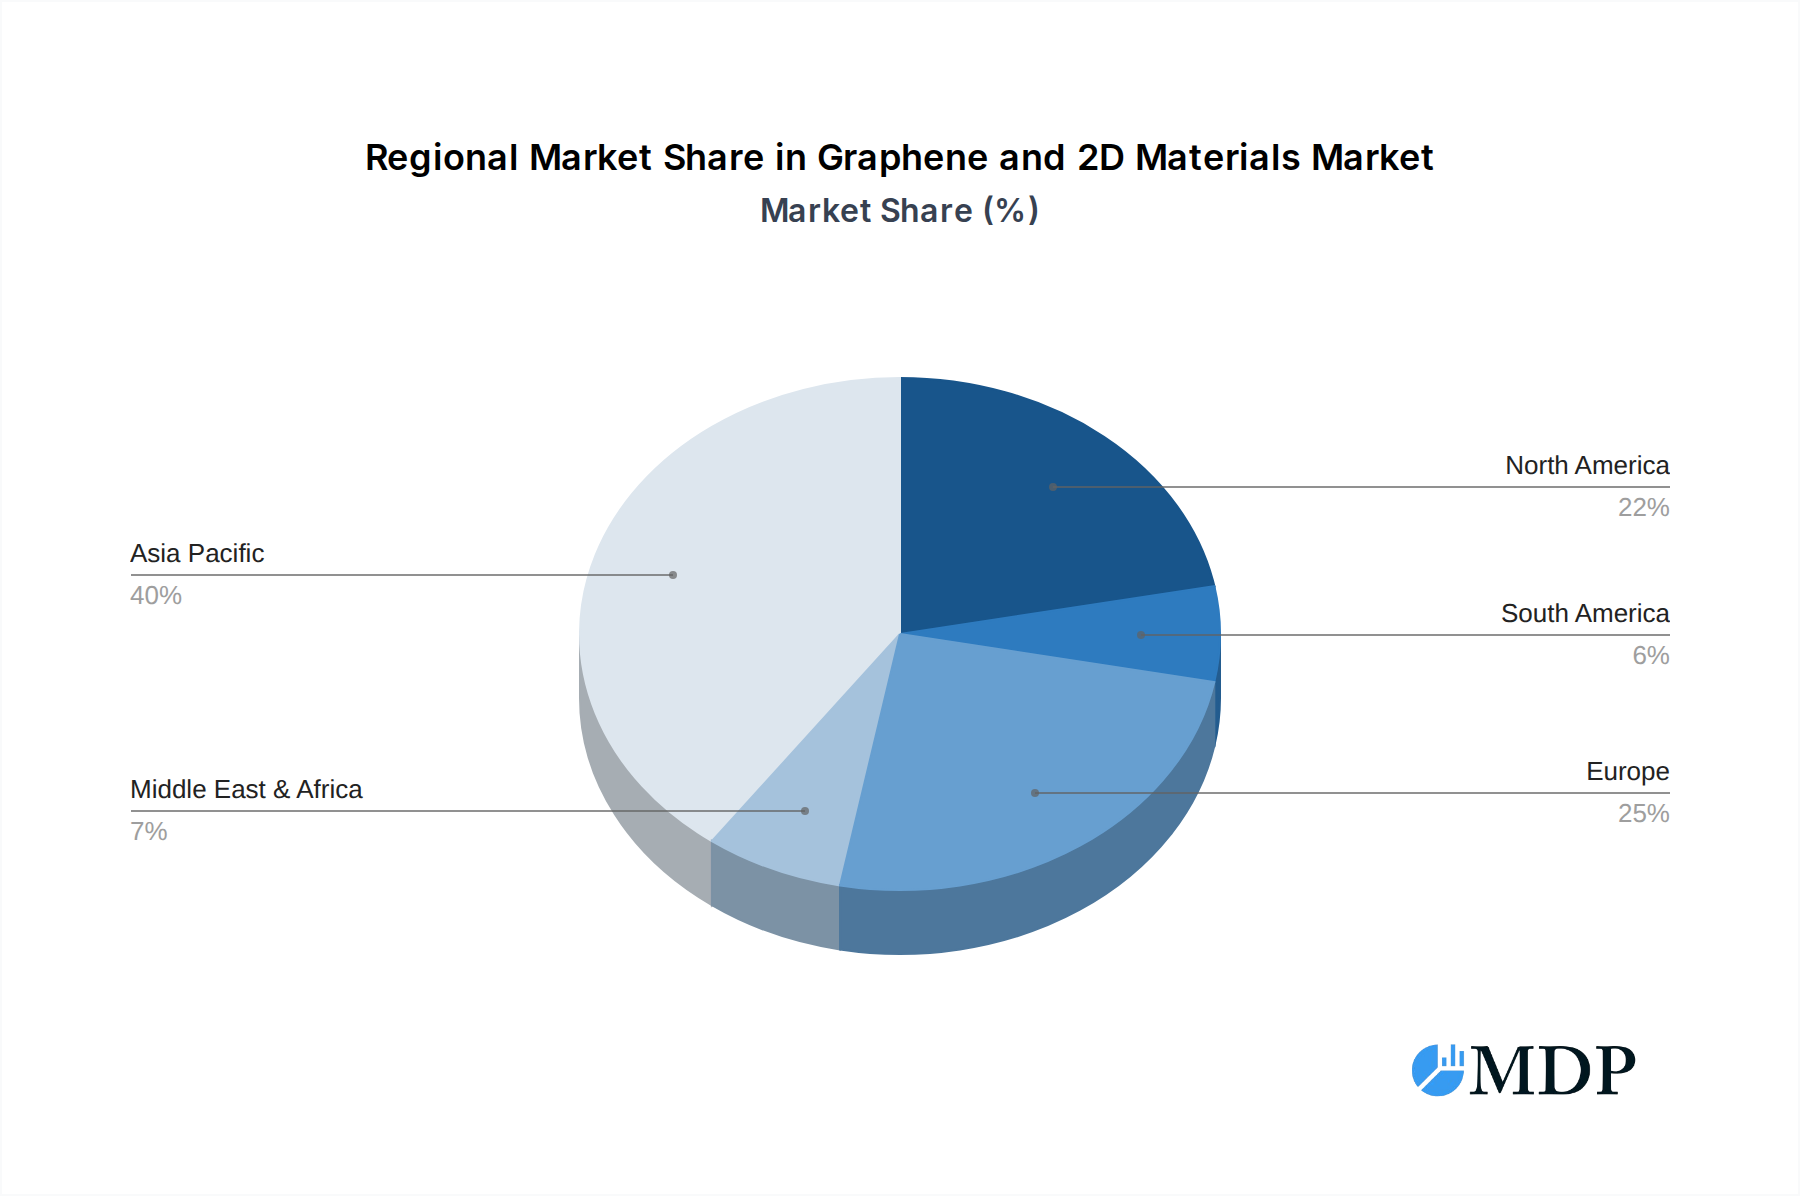
Graphene and 2D Materials Regional Market Share
Geographic Coverage of Graphene and 2D Materials
Graphene and 2D Materials REPORT HIGHLIGHTS
| Aspects | Details |
|---|---|
| Study Period | 2020-2034 |
| Base Year | 2025 |
| Estimated Year | 2026 |
| Forecast Period | 2026-2034 |
| Historical Period | 2020-2025 |
| Growth Rate | CAGR of 24% from 2020-2034 |
| Segmentation |
|
Table of Contents
- 1. Introduction
- 1.1. Research Scope
- 1.2. Market Segmentation
- 1.3. Research Methodology
- 1.4. Definitions and Assumptions
- 2. Executive Summary
- 2.1. Introduction
- 3. Market Dynamics
- 3.1. Introduction
- 3.2. Market Drivers
- 3.3. Market Restrains
- 3.4. Market Trends
- 4. Market Factor Analysis
- 4.1. Porters Five Forces
- 4.2. Supply/Value Chain
- 4.3. PESTEL analysis
- 4.4. Market Entropy
- 4.5. Patent/Trademark Analysis
- 5. Global Graphene and 2D Materials Analysis, Insights and Forecast, 2020-2032
- 5.1. Market Analysis, Insights and Forecast - by Application
- 5.1.1. Paints and Coatings
- 5.1.2. Energy Storage
- 5.1.3. Electronics and Semiconductors
- 5.1.4. Photovoltaics
- 5.1.5. Healthcare
- 5.1.6. Textile Industry
- 5.2. Market Analysis, Insights and Forecast - by Types
- 5.2.1. Graphene Material
- 5.2.2. Intermediate Product
- 5.2.3. Embedded Graphene
- 5.3. Market Analysis, Insights and Forecast - by Region
- 5.3.1. North America
- 5.3.2. South America
- 5.3.3. Europe
- 5.3.4. Middle East & Africa
- 5.3.5. Asia Pacific
- 5.1. Market Analysis, Insights and Forecast - by Application
- 6. North America Graphene and 2D Materials Analysis, Insights and Forecast, 2020-2032
- 6.1. Market Analysis, Insights and Forecast - by Application
- 6.1.1. Paints and Coatings
- 6.1.2. Energy Storage
- 6.1.3. Electronics and Semiconductors
- 6.1.4. Photovoltaics
- 6.1.5. Healthcare
- 6.1.6. Textile Industry
- 6.2. Market Analysis, Insights and Forecast - by Types
- 6.2.1. Graphene Material
- 6.2.2. Intermediate Product
- 6.2.3. Embedded Graphene
- 6.1. Market Analysis, Insights and Forecast - by Application
- 7. South America Graphene and 2D Materials Analysis, Insights and Forecast, 2020-2032
- 7.1. Market Analysis, Insights and Forecast - by Application
- 7.1.1. Paints and Coatings
- 7.1.2. Energy Storage
- 7.1.3. Electronics and Semiconductors
- 7.1.4. Photovoltaics
- 7.1.5. Healthcare
- 7.1.6. Textile Industry
- 7.2. Market Analysis, Insights and Forecast - by Types
- 7.2.1. Graphene Material
- 7.2.2. Intermediate Product
- 7.2.3. Embedded Graphene
- 7.1. Market Analysis, Insights and Forecast - by Application
- 8. Europe Graphene and 2D Materials Analysis, Insights and Forecast, 2020-2032
- 8.1. Market Analysis, Insights and Forecast - by Application
- 8.1.1. Paints and Coatings
- 8.1.2. Energy Storage
- 8.1.3. Electronics and Semiconductors
- 8.1.4. Photovoltaics
- 8.1.5. Healthcare
- 8.1.6. Textile Industry
- 8.2. Market Analysis, Insights and Forecast - by Types
- 8.2.1. Graphene Material
- 8.2.2. Intermediate Product
- 8.2.3. Embedded Graphene
- 8.1. Market Analysis, Insights and Forecast - by Application
- 9. Middle East & Africa Graphene and 2D Materials Analysis, Insights and Forecast, 2020-2032
- 9.1. Market Analysis, Insights and Forecast - by Application
- 9.1.1. Paints and Coatings
- 9.1.2. Energy Storage
- 9.1.3. Electronics and Semiconductors
- 9.1.4. Photovoltaics
- 9.1.5. Healthcare
- 9.1.6. Textile Industry
- 9.2. Market Analysis, Insights and Forecast - by Types
- 9.2.1. Graphene Material
- 9.2.2. Intermediate Product
- 9.2.3. Embedded Graphene
- 9.1. Market Analysis, Insights and Forecast - by Application
- 10. Asia Pacific Graphene and 2D Materials Analysis, Insights and Forecast, 2020-2032
- 10.1. Market Analysis, Insights and Forecast - by Application
- 10.1.1. Paints and Coatings
- 10.1.2. Energy Storage
- 10.1.3. Electronics and Semiconductors
- 10.1.4. Photovoltaics
- 10.1.5. Healthcare
- 10.1.6. Textile Industry
- 10.2. Market Analysis, Insights and Forecast - by Types
- 10.2.1. Graphene Material
- 10.2.2. Intermediate Product
- 10.2.3. Embedded Graphene
- 10.1. Market Analysis, Insights and Forecast - by Application
- 11. Competitive Analysis
- 11.1. Global Market Share Analysis 2025
- 11.2. Company Profiles
- 11.2.1 Anaphite
- 11.2.1.1. Overview
- 11.2.1.2. Products
- 11.2.1.3. SWOT Analysis
- 11.2.1.4. Recent Developments
- 11.2.1.5. Financials (Based on Availability)
- 11.2.2 CamGraPhic
- 11.2.2.1. Overview
- 11.2.2.2. Products
- 11.2.2.3. SWOT Analysis
- 11.2.2.4. Recent Developments
- 11.2.2.5. Financials (Based on Availability)
- 11.2.3 Directa Plus
- 11.2.3.1. Overview
- 11.2.3.2. Products
- 11.2.3.3. SWOT Analysis
- 11.2.3.4. Recent Developments
- 11.2.3.5. Financials (Based on Availability)
- 11.2.4 First Graphene
- 11.2.4.1. Overview
- 11.2.4.2. Products
- 11.2.4.3. SWOT Analysis
- 11.2.4.4. Recent Developments
- 11.2.4.5. Financials (Based on Availability)
- 11.2.5 Global Graphene Group
- 11.2.5.1. Overview
- 11.2.5.2. Products
- 11.2.5.3. SWOT Analysis
- 11.2.5.4. Recent Developments
- 11.2.5.5. Financials (Based on Availability)
- 11.2.6 Graphjet Technology
- 11.2.6.1. Overview
- 11.2.6.2. Products
- 11.2.6.3. SWOT Analysis
- 11.2.6.4. Recent Developments
- 11.2.6.5. Financials (Based on Availability)
- 11.2.7 Grapheal
- 11.2.7.1. Overview
- 11.2.7.2. Products
- 11.2.7.3. SWOT Analysis
- 11.2.7.4. Recent Developments
- 11.2.7.5. Financials (Based on Availability)
- 11.2.8 Graphex Group
- 11.2.8.1. Overview
- 11.2.8.2. Products
- 11.2.8.3. SWOT Analysis
- 11.2.8.4. Recent Developments
- 11.2.8.5. Financials (Based on Availability)
- 11.2.9 Haydale Graphene
- 11.2.9.1. Overview
- 11.2.9.2. Products
- 11.2.9.3. SWOT Analysis
- 11.2.9.4. Recent Developments
- 11.2.9.5. Financials (Based on Availability)
- 11.2.10 Graphmatech
- 11.2.10.1. Overview
- 11.2.10.2. Products
- 11.2.10.3. SWOT Analysis
- 11.2.10.4. Recent Developments
- 11.2.10.5. Financials (Based on Availability)
- 11.2.11 Huvis
- 11.2.11.1. Overview
- 11.2.11.2. Products
- 11.2.11.3. SWOT Analysis
- 11.2.11.4. Recent Developments
- 11.2.11.5. Financials (Based on Availability)
- 11.2.12 Lyten
- 11.2.12.1. Overview
- 11.2.12.2. Products
- 11.2.12.3. SWOT Analysis
- 11.2.12.4. Recent Developments
- 11.2.12.5. Financials (Based on Availability)
- 11.2.13 NanoXplore
- 11.2.13.1. Overview
- 11.2.13.2. Products
- 11.2.13.3. SWOT Analysis
- 11.2.13.4. Recent Developments
- 11.2.13.5. Financials (Based on Availability)
- 11.2.14 Paragraf
- 11.2.14.1. Overview
- 11.2.14.2. Products
- 11.2.14.3. SWOT Analysis
- 11.2.14.4. Recent Developments
- 11.2.14.5. Financials (Based on Availability)
- 11.2.15 SafeLi LLC
- 11.2.15.1. Overview
- 11.2.15.2. Products
- 11.2.15.3. SWOT Analysis
- 11.2.15.4. Recent Developments
- 11.2.15.5. Financials (Based on Availability)
- 11.2.16 Saint Jean Carbon
- 11.2.16.1. Overview
- 11.2.16.2. Products
- 11.2.16.3. SWOT Analysis
- 11.2.16.4. Recent Developments
- 11.2.16.5. Financials (Based on Availability)
- 11.2.17 Versarien
- 11.2.17.1. Overview
- 11.2.17.2. Products
- 11.2.17.3. SWOT Analysis
- 11.2.17.4. Recent Developments
- 11.2.17.5. Financials (Based on Availability)
- 11.2.18 Talga Resources
- 11.2.18.1. Overview
- 11.2.18.2. Products
- 11.2.18.3. SWOT Analysis
- 11.2.18.4. Recent Developments
- 11.2.18.5. Financials (Based on Availability)
- 11.2.1 Anaphite
List of Figures
- Figure 1: Global Graphene and 2D Materials Revenue Breakdown (undefined, %) by Region 2025 & 2033
- Figure 2: North America Graphene and 2D Materials Revenue (undefined), by Application 2025 & 2033
- Figure 3: North America Graphene and 2D Materials Revenue Share (%), by Application 2025 & 2033
- Figure 4: North America Graphene and 2D Materials Revenue (undefined), by Types 2025 & 2033
- Figure 5: North America Graphene and 2D Materials Revenue Share (%), by Types 2025 & 2033
- Figure 6: North America Graphene and 2D Materials Revenue (undefined), by Country 2025 & 2033
- Figure 7: North America Graphene and 2D Materials Revenue Share (%), by Country 2025 & 2033
- Figure 8: South America Graphene and 2D Materials Revenue (undefined), by Application 2025 & 2033
- Figure 9: South America Graphene and 2D Materials Revenue Share (%), by Application 2025 & 2033
- Figure 10: South America Graphene and 2D Materials Revenue (undefined), by Types 2025 & 2033
- Figure 11: South America Graphene and 2D Materials Revenue Share (%), by Types 2025 & 2033
- Figure 12: South America Graphene and 2D Materials Revenue (undefined), by Country 2025 & 2033
- Figure 13: South America Graphene and 2D Materials Revenue Share (%), by Country 2025 & 2033
- Figure 14: Europe Graphene and 2D Materials Revenue (undefined), by Application 2025 & 2033
- Figure 15: Europe Graphene and 2D Materials Revenue Share (%), by Application 2025 & 2033
- Figure 16: Europe Graphene and 2D Materials Revenue (undefined), by Types 2025 & 2033
- Figure 17: Europe Graphene and 2D Materials Revenue Share (%), by Types 2025 & 2033
- Figure 18: Europe Graphene and 2D Materials Revenue (undefined), by Country 2025 & 2033
- Figure 19: Europe Graphene and 2D Materials Revenue Share (%), by Country 2025 & 2033
- Figure 20: Middle East & Africa Graphene and 2D Materials Revenue (undefined), by Application 2025 & 2033
- Figure 21: Middle East & Africa Graphene and 2D Materials Revenue Share (%), by Application 2025 & 2033
- Figure 22: Middle East & Africa Graphene and 2D Materials Revenue (undefined), by Types 2025 & 2033
- Figure 23: Middle East & Africa Graphene and 2D Materials Revenue Share (%), by Types 2025 & 2033
- Figure 24: Middle East & Africa Graphene and 2D Materials Revenue (undefined), by Country 2025 & 2033
- Figure 25: Middle East & Africa Graphene and 2D Materials Revenue Share (%), by Country 2025 & 2033
- Figure 26: Asia Pacific Graphene and 2D Materials Revenue (undefined), by Application 2025 & 2033
- Figure 27: Asia Pacific Graphene and 2D Materials Revenue Share (%), by Application 2025 & 2033
- Figure 28: Asia Pacific Graphene and 2D Materials Revenue (undefined), by Types 2025 & 2033
- Figure 29: Asia Pacific Graphene and 2D Materials Revenue Share (%), by Types 2025 & 2033
- Figure 30: Asia Pacific Graphene and 2D Materials Revenue (undefined), by Country 2025 & 2033
- Figure 31: Asia Pacific Graphene and 2D Materials Revenue Share (%), by Country 2025 & 2033
List of Tables
- Table 1: Global Graphene and 2D Materials Revenue undefined Forecast, by Application 2020 & 2033
- Table 2: Global Graphene and 2D Materials Revenue undefined Forecast, by Types 2020 & 2033
- Table 3: Global Graphene and 2D Materials Revenue undefined Forecast, by Region 2020 & 2033
- Table 4: Global Graphene and 2D Materials Revenue undefined Forecast, by Application 2020 & 2033
- Table 5: Global Graphene and 2D Materials Revenue undefined Forecast, by Types 2020 & 2033
- Table 6: Global Graphene and 2D Materials Revenue undefined Forecast, by Country 2020 & 2033
- Table 7: United States Graphene and 2D Materials Revenue (undefined) Forecast, by Application 2020 & 2033
- Table 8: Canada Graphene and 2D Materials Revenue (undefined) Forecast, by Application 2020 & 2033
- Table 9: Mexico Graphene and 2D Materials Revenue (undefined) Forecast, by Application 2020 & 2033
- Table 10: Global Graphene and 2D Materials Revenue undefined Forecast, by Application 2020 & 2033
- Table 11: Global Graphene and 2D Materials Revenue undefined Forecast, by Types 2020 & 2033
- Table 12: Global Graphene and 2D Materials Revenue undefined Forecast, by Country 2020 & 2033
- Table 13: Brazil Graphene and 2D Materials Revenue (undefined) Forecast, by Application 2020 & 2033
- Table 14: Argentina Graphene and 2D Materials Revenue (undefined) Forecast, by Application 2020 & 2033
- Table 15: Rest of South America Graphene and 2D Materials Revenue (undefined) Forecast, by Application 2020 & 2033
- Table 16: Global Graphene and 2D Materials Revenue undefined Forecast, by Application 2020 & 2033
- Table 17: Global Graphene and 2D Materials Revenue undefined Forecast, by Types 2020 & 2033
- Table 18: Global Graphene and 2D Materials Revenue undefined Forecast, by Country 2020 & 2033
- Table 19: United Kingdom Graphene and 2D Materials Revenue (undefined) Forecast, by Application 2020 & 2033
- Table 20: Germany Graphene and 2D Materials Revenue (undefined) Forecast, by Application 2020 & 2033
- Table 21: France Graphene and 2D Materials Revenue (undefined) Forecast, by Application 2020 & 2033
- Table 22: Italy Graphene and 2D Materials Revenue (undefined) Forecast, by Application 2020 & 2033
- Table 23: Spain Graphene and 2D Materials Revenue (undefined) Forecast, by Application 2020 & 2033
- Table 24: Russia Graphene and 2D Materials Revenue (undefined) Forecast, by Application 2020 & 2033
- Table 25: Benelux Graphene and 2D Materials Revenue (undefined) Forecast, by Application 2020 & 2033
- Table 26: Nordics Graphene and 2D Materials Revenue (undefined) Forecast, by Application 2020 & 2033
- Table 27: Rest of Europe Graphene and 2D Materials Revenue (undefined) Forecast, by Application 2020 & 2033
- Table 28: Global Graphene and 2D Materials Revenue undefined Forecast, by Application 2020 & 2033
- Table 29: Global Graphene and 2D Materials Revenue undefined Forecast, by Types 2020 & 2033
- Table 30: Global Graphene and 2D Materials Revenue undefined Forecast, by Country 2020 & 2033
- Table 31: Turkey Graphene and 2D Materials Revenue (undefined) Forecast, by Application 2020 & 2033
- Table 32: Israel Graphene and 2D Materials Revenue (undefined) Forecast, by Application 2020 & 2033
- Table 33: GCC Graphene and 2D Materials Revenue (undefined) Forecast, by Application 2020 & 2033
- Table 34: North Africa Graphene and 2D Materials Revenue (undefined) Forecast, by Application 2020 & 2033
- Table 35: South Africa Graphene and 2D Materials Revenue (undefined) Forecast, by Application 2020 & 2033
- Table 36: Rest of Middle East & Africa Graphene and 2D Materials Revenue (undefined) Forecast, by Application 2020 & 2033
- Table 37: Global Graphene and 2D Materials Revenue undefined Forecast, by Application 2020 & 2033
- Table 38: Global Graphene and 2D Materials Revenue undefined Forecast, by Types 2020 & 2033
- Table 39: Global Graphene and 2D Materials Revenue undefined Forecast, by Country 2020 & 2033
- Table 40: China Graphene and 2D Materials Revenue (undefined) Forecast, by Application 2020 & 2033
- Table 41: India Graphene and 2D Materials Revenue (undefined) Forecast, by Application 2020 & 2033
- Table 42: Japan Graphene and 2D Materials Revenue (undefined) Forecast, by Application 2020 & 2033
- Table 43: South Korea Graphene and 2D Materials Revenue (undefined) Forecast, by Application 2020 & 2033
- Table 44: ASEAN Graphene and 2D Materials Revenue (undefined) Forecast, by Application 2020 & 2033
- Table 45: Oceania Graphene and 2D Materials Revenue (undefined) Forecast, by Application 2020 & 2033
- Table 46: Rest of Asia Pacific Graphene and 2D Materials Revenue (undefined) Forecast, by Application 2020 & 2033
Frequently Asked Questions
1. What is the projected Compound Annual Growth Rate (CAGR) of the Graphene and 2D Materials?
The projected CAGR is approximately 24%.
2. Which companies are prominent players in the Graphene and 2D Materials?
Key companies in the market include Anaphite, CamGraPhic, Directa Plus, First Graphene, Global Graphene Group, Graphjet Technology, Grapheal, Graphex Group, Haydale Graphene, Graphmatech, Huvis, Lyten, NanoXplore, Paragraf, SafeLi LLC, Saint Jean Carbon, Versarien, Talga Resources.
3. What are the main segments of the Graphene and 2D Materials?
The market segments include Application, Types.
4. Can you provide details about the market size?
The market size is estimated to be USD XXX N/A as of 2022.
5. What are some drivers contributing to market growth?
N/A
6. What are the notable trends driving market growth?
N/A
7. Are there any restraints impacting market growth?
N/A
8. Can you provide examples of recent developments in the market?
N/A
9. What pricing options are available for accessing the report?
Pricing options include single-user, multi-user, and enterprise licenses priced at USD 2900.00, USD 4350.00, and USD 5800.00 respectively.
10. Is the market size provided in terms of value or volume?
The market size is provided in terms of value, measured in N/A.
11. Are there any specific market keywords associated with the report?
Yes, the market keyword associated with the report is "Graphene and 2D Materials," which aids in identifying and referencing the specific market segment covered.
12. How do I determine which pricing option suits my needs best?
The pricing options vary based on user requirements and access needs. Individual users may opt for single-user licenses, while businesses requiring broader access may choose multi-user or enterprise licenses for cost-effective access to the report.
13. Are there any additional resources or data provided in the Graphene and 2D Materials report?
While the report offers comprehensive insights, it's advisable to review the specific contents or supplementary materials provided to ascertain if additional resources or data are available.
14. How can I stay updated on further developments or reports in the Graphene and 2D Materials?
To stay informed about further developments, trends, and reports in the Graphene and 2D Materials, consider subscribing to industry newsletters, following relevant companies and organizations, or regularly checking reputable industry news sources and publications.
Methodology
Step 1 - Identification of Relevant Samples Size from Population Database


Step 2 - Approaches for Defining Global Market Size (Value, Volume* & Price*)

Note*: In applicable scenarios
Step 3 - Data Sources
Primary Research
- Web Analytics
- Survey Reports
- Research Institute
- Latest Research Reports
- Opinion Leaders
Secondary Research
- Annual Reports
- White Paper
- Latest Press Release
- Industry Association
- Paid Database
- Investor Presentations

Step 4 - Data Triangulation
Involves using different sources of information in order to increase the validity of a study
These sources are likely to be stakeholders in a program - participants, other researchers, program staff, other community members, and so on.
Then we put all data in single framework & apply various statistical tools to find out the dynamic on the market.
During the analysis stage, feedback from the stakeholder groups would be compared to determine areas of agreement as well as areas of divergence