

Key Insights
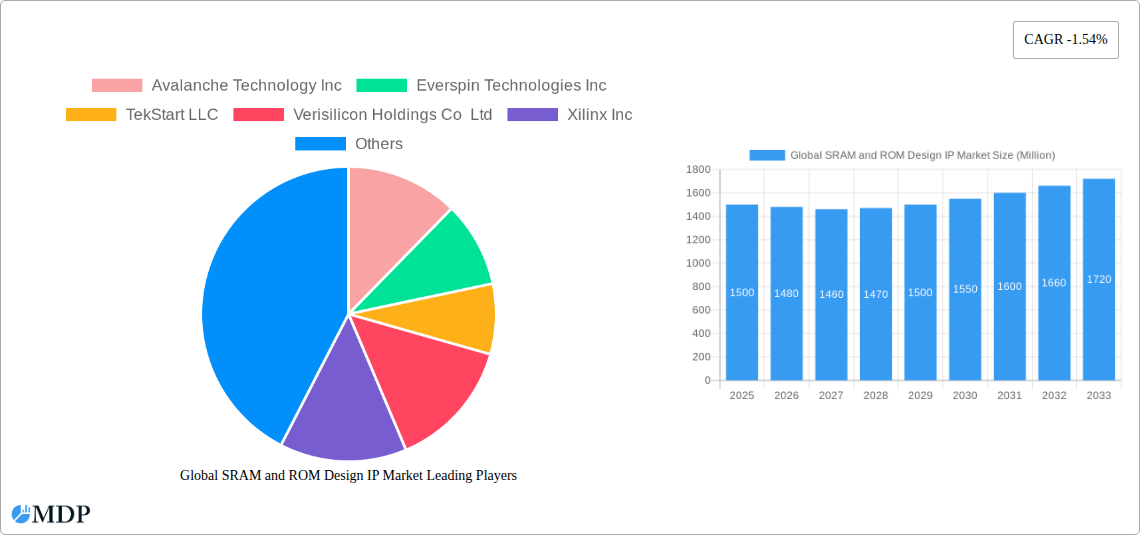
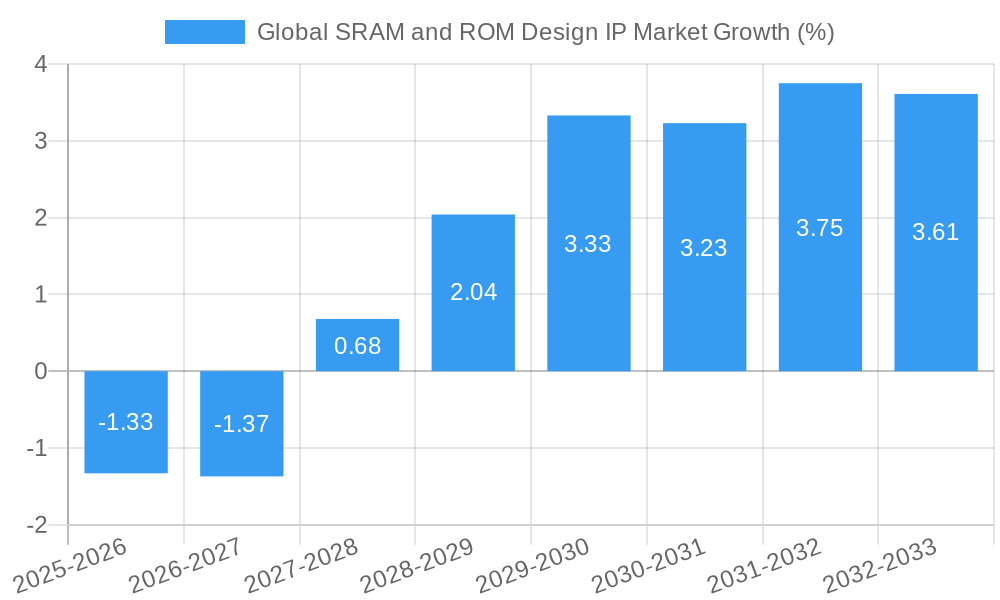
The Global SRAM and ROM Design IP Market, while exhibiting a slightly negative CAGR of -1.54% between 2019 and 2024, is projected to experience a period of stabilization and potential growth in the coming years. This slight contraction may be attributed to factors such as market saturation in certain segments, intense competition among established players, and cyclical fluctuations within the semiconductor industry. However, several powerful drivers are poised to positively impact market growth. The increasing demand for high-performance computing, driven by advancements in artificial intelligence (AI), machine learning (ML), and the Internet of Things (IoT), is a significant catalyst. The automotive industry's adoption of advanced driver-assistance systems (ADAS) and autonomous driving technologies necessitates high-bandwidth, low-latency memory solutions, further stimulating demand. Furthermore, the expansion of the healthcare sector's use of embedded systems in medical devices and the rising adoption of industrial automation and robotics are creating lucrative opportunities for SRAM and ROM Design IP providers. The market segmentation, encompassing CPUs, GPUs, NNPs, and other components across various applications (consumer electronics, automotive, healthcare, automation, and robotics), demonstrates its versatility and adaptability to diverse technological advancements. This segmentation offers significant growth potential through tailored solutions addressing specific performance requirements of each application.
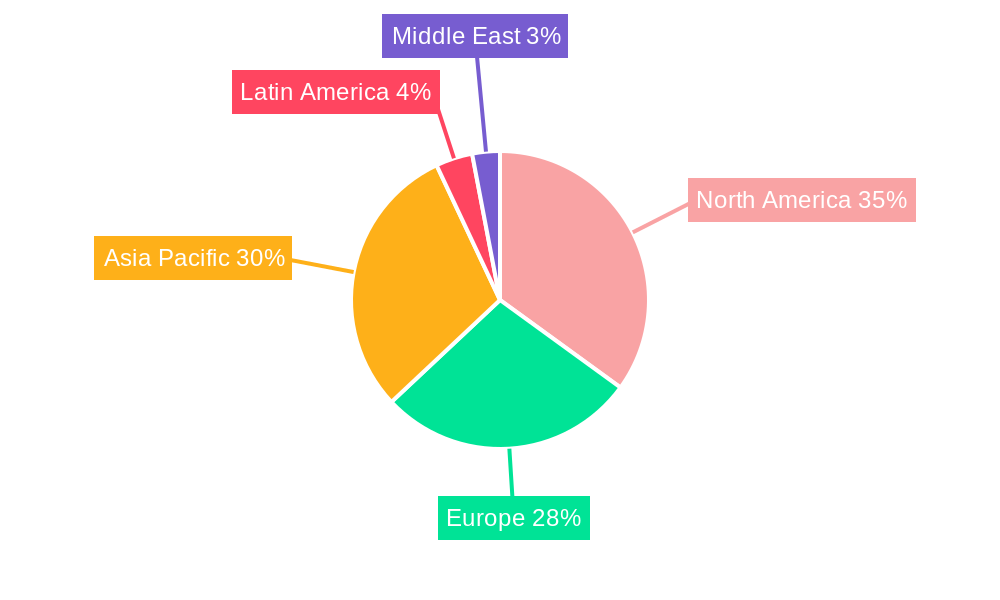
The competitive landscape is characterized by a mix of established players and emerging companies, each vying for market share. Key players are investing heavily in R&D to develop innovative IP solutions addressing the evolving needs of their customers. The geographical distribution of the market is likely to see continued growth in the Asia-Pacific region, driven by its burgeoning electronics manufacturing industry and rapid technological adoption. North America and Europe are expected to maintain their significant market share, contributing substantially to the overall market value. While the -1.54% CAGR from 2019-2024 indicates a period of modest contraction, the confluence of technological advancements and expanding application areas suggests a stabilization and subsequent growth trajectory for the SRAM and ROM Design IP market in the forecast period (2025-2033). The market is likely to witness increased consolidation and strategic partnerships as companies strive to maintain competitiveness and capitalize on emerging opportunities.
Global SRAM and ROM Design IP Market: A Comprehensive Report (2019-2033)
This in-depth report provides a comprehensive analysis of the global SRAM and ROM Design IP market, offering valuable insights for stakeholders across the semiconductor and electronics industries. Covering the period from 2019 to 2033, with a focus on 2025, this report unveils market dynamics, industry trends, leading players, and future growth opportunities. The study meticulously segments the market by component (CPU, GPU, NNP, Other) and application (Consumer Electronics, Automotive, Healthcare, Automation and Robotics, Other), providing granular data and analysis for informed decision-making.
Global SRAM and ROM Design IP Market Market Dynamics & Concentration
This section delves into the competitive landscape of the SRAM and ROM Design IP market, analyzing market concentration, innovation drivers, regulatory frameworks, product substitutes, end-user trends, and merger & acquisition (M&A) activities. The market is characterized by a moderately concentrated structure, with a few major players holding significant market share. The combined market share of the top 5 players in 2025 is estimated at 55%. This concentration is driven by high barriers to entry, including substantial R&D investment and intellectual property protection.
Innovation Drivers: Continuous advancements in semiconductor technology, including the development of low-power, high-performance SRAM and ROM designs, fuel market growth. The increasing demand for high-bandwidth memory solutions in applications like AI and machine learning also contributes significantly.
Regulatory Frameworks: Government regulations regarding data security and intellectual property rights impact market dynamics. The increasing focus on data privacy across various geographies is shaping the demand for secure memory solutions.
Product Substitutes: While SRAM and ROM remain dominant, emerging memory technologies like MRAM and ReRAM pose a potential threat, albeit a limited one in the near future. The substitution rate is currently projected at approximately 2% annually, with expectations that this rate will increase over the coming years.
End-User Trends: The rising adoption of connected devices and the growth of data-intensive applications across diverse sectors (automotive, healthcare, consumer electronics) are key drivers of market demand.
M&A Activities: The industry has witnessed a moderate level of M&A activity in recent years. Approximately xx M&A deals related to SRAM and ROM IP were recorded between 2019 and 2024. These activities reflect strategic efforts to consolidate market share and expand technological capabilities.
Global SRAM and ROM Design IP Market Industry Trends & Analysis
This section analyzes the market's growth trajectory, technological disruptions, consumer preferences, and competitive dynamics. The global SRAM and ROM Design IP market is experiencing robust growth, driven by the increasing demand for high-performance computing and the proliferation of smart devices. The CAGR for the forecast period (2025-2033) is estimated at xx%. Market penetration in key application segments such as consumer electronics and automotive is steadily rising, fueled by technological advancements.
The industry is witnessing significant technological disruptions, including the development of advanced memory architectures, such as 3D-stacked memory and embedded memory solutions. Consumer preferences are shifting towards energy-efficient, high-capacity memory solutions, prompting manufacturers to innovate accordingly. The competitive landscape is characterized by intense competition among established players and emerging companies. Key competitive strategies include product differentiation, strategic partnerships, and acquisitions.
Leading Markets & Segments in Global SRAM and ROM Design IP Market
North America holds the dominant position in the global SRAM and ROM Design IP market in 2025, accounting for approximately xx% of the total market revenue. This dominance is primarily driven by the presence of major semiconductor companies, a strong R&D ecosystem, and high demand from various end-user industries.
By Component:
- CPU: This segment commands the largest market share due to the widespread use of CPUs in diverse electronic devices.
- GPU: The growing adoption of GPUs in gaming, high-performance computing, and AI applications drives growth in this segment.
- NNP: The rapid expansion of AI and machine learning applications is fueling the demand for NNPs and the associated memory requirements.
- Other Components: This segment includes various other memory components, contributing to the overall market size.
By Application:
- Consumer Electronics: This segment is the largest, driven by the high volume of smartphones, tablets, and other consumer devices.
- Automotive: The increasing adoption of advanced driver-assistance systems (ADAS) and autonomous driving technologies fuels strong demand for high-performance memory solutions.
- Healthcare: Growth in medical imaging, wearable devices, and other healthcare applications is driving the adoption of SRAM and ROM IP.
- Automation and Robotics: The increasing use of robotics and automation in manufacturing and other industries increases the demand.
- Other Applications: This includes industrial control systems, networking equipment, and other applications.
Key Drivers for Dominant Regions/Segments:
- North America: Strong R&D investments, robust semiconductor industry, and high adoption of advanced technologies.
- Consumer Electronics: High volume production and increasing demand for feature-rich devices.
- Automotive: Rapid growth of ADAS and autonomous vehicles.
Global SRAM and ROM Design IP Market Product Developments
Recent product innovations have focused on enhancing memory density, reducing power consumption, and improving performance. Manufacturers are developing advanced memory architectures, such as 3D-stacked memory and embedded memory solutions, to meet the growing demand for high-bandwidth memory. These innovations offer several competitive advantages, including increased speed, reduced latency, and improved power efficiency. The market is witnessing a shift towards specialized memory solutions tailored to specific applications.
Key Drivers of Global SRAM and ROM Design IP Market Growth
Several key factors are propelling the growth of the SRAM and ROM Design IP market:
Technological advancements: The continuous development of advanced memory technologies, such as low-power, high-density designs, is driving market expansion. For example, the introduction of new node process technologies is enabling higher density and lower power consumption.
Economic growth: The global economic growth, particularly in emerging markets, is increasing demand for electronic devices and driving the adoption of advanced memory solutions.
Favorable regulatory environment: Government initiatives and investments in semiconductor technology are creating a favorable environment for market growth.
Challenges in the Global SRAM and ROM Design IP Market Market
The SRAM and ROM Design IP market faces several challenges:
Intense competition: The market is highly competitive, with several established and emerging players vying for market share. This competition pressures pricing and profit margins.
Supply chain disruptions: Global supply chain issues can impact the availability of raw materials and components, affecting production and market supply.
Technological shifts: Rapid technological advancements can render existing products obsolete, necessitating constant innovation and investment.
Emerging Opportunities in Global SRAM and ROM Design IP Market
The long-term growth prospects for the SRAM and ROM Design IP market are positive, driven by several emerging opportunities:
The Internet of Things (IoT) explosion is generating huge demand for low-power, high-density memory solutions. The rise of artificial intelligence and machine learning requires high-bandwidth memory, presenting significant opportunities for specialized memory solutions. Furthermore, strategic partnerships and collaborations across the value chain are fostering innovation and market expansion.
Leading Players in the Global SRAM and ROM Design IP Market Sector
- Avalanche Technology Inc
- Everspin Technologies Inc
- TekStart LLC
- Verisilicon Holdings Co Ltd
- Xilinx Inc
- Dolphin Design SAS
- Arm Holdings
- Dolphin Technology Inc
- Surecore Ltd
- Renesas Electronics Corporation
- Synopsys Inc
- TDK Corporation
- eMemory Technology Inc
- Mentor Graphics Corporation
Key Milestones in Global SRAM and ROM Design IP Market Industry
- 2020: Introduction of xx nm SRAM technology by Synopsys.
- 2021: Acquisition of xx company by Arm Holdings.
- 2022: Launch of a new low-power ROM solution by Renesas Electronics Corporation.
- 2023: Partnership between Xilinx and xx company to develop advanced memory solutions.
- 2024: Release of a new high-density SRAM IP core by Verisilicon.
Strategic Outlook for Global SRAM and ROM Design IP Market Market
The future of the SRAM and ROM Design IP market is bright, driven by the increasing demand for high-performance computing, AI, and IoT applications. Strategic partnerships, investments in R&D, and the development of innovative memory technologies will be key to success in this dynamic market. Companies that can successfully adapt to the evolving technological landscape and meet the diverse needs of end-users are poised for significant growth.
Global SRAM and ROM Design IP Market Segmentation
-
1. Type
- 1.1. High-density SRAM
- 1.2. Low-power SRAM
- 1.3. ROM
-
2. Application
- 2.1. Consumer Electronics
- 2.2. Automotive
- 2.3. Industrial
- 2.4. Enterprise/Data Center
-
3. Geography
- 3.1. North America
- 3.2. Asia-Pacific
- 3.3. Europe
- 3.4. Other Regions
Global SRAM and ROM Design IP Market Segmentation By Geography
-
1. North America
- 1.1. United States
- 1.2. Canada
- 1.3. Mexico
-
2. South America
- 2.1. Brazil
- 2.2. Argentina
- 2.3. Rest of South America
-
3. Europe
- 3.1. United Kingdom
- 3.2. Germany
- 3.3. France
- 3.4. Italy
- 3.5. Spain
- 3.6. Russia
- 3.7. Benelux
- 3.8. Nordics
- 3.9. Rest of Europe
-
4. Middle East & Africa
- 4.1. Turkey
- 4.2. Israel
- 4.3. GCC
- 4.4. North Africa
- 4.5. South Africa
- 4.6. Rest of Middle East & Africa
-
5. Asia Pacific
- 5.1. China
- 5.2. India
- 5.3. Japan
- 5.4. South Korea
- 5.5. ASEAN
- 5.6. Oceania
- 5.7. Rest of Asia Pacific
Global SRAM and ROM Design IP Market REPORT HIGHLIGHTS
| Aspects | Details |
|---|---|
| Study Period | 2019-2033 |
| Base Year | 2024 |
| Estimated Year | 2025 |
| Forecast Period | 2025-2033 |
| Historical Period | 2019-2024 |
| Growth Rate | CAGR of -1.54% from 2019-2033 |
| Segmentation |
|
Table of Contents
- 1. Introduction
- 1.1. Research Scope
- 1.2. Market Segmentation
- 1.3. Research Methodology
- 1.4. Definitions and Assumptions
- 2. Executive Summary
- 2.1. Introduction
- 3. Market Dynamics
- 3.1. Introduction
- 3.2. Market Drivers
- 3.2.1. Increase in Demand for Autonomous Driving Technology; Growth in Edge Analytics for IoT Application
- 3.3. Market Restrains
- 3.3.1. Complexity in Design and AI Interface
- 3.4. Market Trends
- 3.4.1. Increasing Demand For Enterprise Storage Applications to Drive the Growth for MRAM
- 4. Market Factor Analysis
- 4.1. Porters Five Forces
- 4.2. Supply/Value Chain
- 4.3. PESTEL analysis
- 4.4. Market Entropy
- 4.5. Patent/Trademark Analysis
- 5. Global SRAM and ROM Design IP Market Analysis, Insights and Forecast, 2019-2031
- 5.1. Market Analysis, Insights and Forecast - by Type
- 5.1.1. High-density SRAM
- 5.1.2. Low-power SRAM
- 5.1.3. ROM
- 5.2. Market Analysis, Insights and Forecast - by Application
- 5.2.1. Consumer Electronics
- 5.2.2. Automotive
- 5.2.3. Industrial
- 5.2.4. Enterprise/Data Center
- 5.3. Market Analysis, Insights and Forecast - by Geography
- 5.3.1. North America
- 5.3.2. Asia-Pacific
- 5.3.3. Europe
- 5.3.4. Other Regions
- 5.4. Market Analysis, Insights and Forecast - by Region
- 5.4.1. North America
- 5.4.2. South America
- 5.4.3. Europe
- 5.4.4. Middle East & Africa
- 5.4.5. Asia Pacific
- 5.1. Market Analysis, Insights and Forecast - by Type
- 6. North America Global SRAM and ROM Design IP Market Analysis, Insights and Forecast, 2019-2031
- 6.1. Market Analysis, Insights and Forecast - by Type
- 6.1.1. High-density SRAM
- 6.1.2. Low-power SRAM
- 6.1.3. ROM
- 6.2. Market Analysis, Insights and Forecast - by Application
- 6.2.1. Consumer Electronics
- 6.2.2. Automotive
- 6.2.3. Industrial
- 6.2.4. Enterprise/Data Center
- 6.3. Market Analysis, Insights and Forecast - by Geography
- 6.3.1. North America
- 6.3.2. Asia-Pacific
- 6.3.3. Europe
- 6.3.4. Other Regions
- 6.1. Market Analysis, Insights and Forecast - by Type
- 7. South America Global SRAM and ROM Design IP Market Analysis, Insights and Forecast, 2019-2031
- 7.1. Market Analysis, Insights and Forecast - by Type
- 7.1.1. High-density SRAM
- 7.1.2. Low-power SRAM
- 7.1.3. ROM
- 7.2. Market Analysis, Insights and Forecast - by Application
- 7.2.1. Consumer Electronics
- 7.2.2. Automotive
- 7.2.3. Industrial
- 7.2.4. Enterprise/Data Center
- 7.3. Market Analysis, Insights and Forecast - by Geography
- 7.3.1. North America
- 7.3.2. Asia-Pacific
- 7.3.3. Europe
- 7.3.4. Other Regions
- 7.1. Market Analysis, Insights and Forecast - by Type
- 8. Europe Global SRAM and ROM Design IP Market Analysis, Insights and Forecast, 2019-2031
- 8.1. Market Analysis, Insights and Forecast - by Type
- 8.1.1. High-density SRAM
- 8.1.2. Low-power SRAM
- 8.1.3. ROM
- 8.2. Market Analysis, Insights and Forecast - by Application
- 8.2.1. Consumer Electronics
- 8.2.2. Automotive
- 8.2.3. Industrial
- 8.2.4. Enterprise/Data Center
- 8.3. Market Analysis, Insights and Forecast - by Geography
- 8.3.1. North America
- 8.3.2. Asia-Pacific
- 8.3.3. Europe
- 8.3.4. Other Regions
- 8.1. Market Analysis, Insights and Forecast - by Type
- 9. Middle East & Africa Global SRAM and ROM Design IP Market Analysis, Insights and Forecast, 2019-2031
- 9.1. Market Analysis, Insights and Forecast - by Type
- 9.1.1. High-density SRAM
- 9.1.2. Low-power SRAM
- 9.1.3. ROM
- 9.2. Market Analysis, Insights and Forecast - by Application
- 9.2.1. Consumer Electronics
- 9.2.2. Automotive
- 9.2.3. Industrial
- 9.2.4. Enterprise/Data Center
- 9.3. Market Analysis, Insights and Forecast - by Geography
- 9.3.1. North America
- 9.3.2. Asia-Pacific
- 9.3.3. Europe
- 9.3.4. Other Regions
- 9.1. Market Analysis, Insights and Forecast - by Type
- 10. Asia Pacific Global SRAM and ROM Design IP Market Analysis, Insights and Forecast, 2019-2031
- 10.1. Market Analysis, Insights and Forecast - by Type
- 10.1.1. High-density SRAM
- 10.1.2. Low-power SRAM
- 10.1.3. ROM
- 10.2. Market Analysis, Insights and Forecast - by Application
- 10.2.1. Consumer Electronics
- 10.2.2. Automotive
- 10.2.3. Industrial
- 10.2.4. Enterprise/Data Center
- 10.3. Market Analysis, Insights and Forecast - by Geography
- 10.3.1. North America
- 10.3.2. Asia-Pacific
- 10.3.3. Europe
- 10.3.4. Other Regions
- 10.1. Market Analysis, Insights and Forecast - by Type
- 11. North America Global SRAM and ROM Design IP Market Analysis, Insights and Forecast, 2019-2031
- 11.1. Market Analysis, Insights and Forecast - By Country/Sub-region
- 11.1.1.
- 12. Europe Global SRAM and ROM Design IP Market Analysis, Insights and Forecast, 2019-2031
- 12.1. Market Analysis, Insights and Forecast - By Country/Sub-region
- 12.1.1.
- 13. Asia Pacific Global SRAM and ROM Design IP Market Analysis, Insights and Forecast, 2019-2031
- 13.1. Market Analysis, Insights and Forecast - By Country/Sub-region
- 13.1.1.
- 14. Latin America Global SRAM and ROM Design IP Market Analysis, Insights and Forecast, 2019-2031
- 14.1. Market Analysis, Insights and Forecast - By Country/Sub-region
- 14.1.1.
- 15. Middle East Global SRAM and ROM Design IP Market Analysis, Insights and Forecast, 2019-2031
- 15.1. Market Analysis, Insights and Forecast - By Country/Sub-region
- 15.1.1.
- 16. Competitive Analysis
- 16.1. Market Share Analysis 2024
- 16.2. Company Profiles
- 16.2.1 Avalanche Technology Inc
- 16.2.1.1. Overview
- 16.2.1.2. Products
- 16.2.1.3. SWOT Analysis
- 16.2.1.4. Recent Developments
- 16.2.1.5. Financials (Based on Availability)
- 16.2.2 Everspin Technologies Inc
- 16.2.2.1. Overview
- 16.2.2.2. Products
- 16.2.2.3. SWOT Analysis
- 16.2.2.4. Recent Developments
- 16.2.2.5. Financials (Based on Availability)
- 16.2.3 TekStart LLC
- 16.2.3.1. Overview
- 16.2.3.2. Products
- 16.2.3.3. SWOT Analysis
- 16.2.3.4. Recent Developments
- 16.2.3.5. Financials (Based on Availability)
- 16.2.4 Verisilicon Holdings Co Ltd
- 16.2.4.1. Overview
- 16.2.4.2. Products
- 16.2.4.3. SWOT Analysis
- 16.2.4.4. Recent Developments
- 16.2.4.5. Financials (Based on Availability)
- 16.2.5 Xilinx Inc
- 16.2.5.1. Overview
- 16.2.5.2. Products
- 16.2.5.3. SWOT Analysis
- 16.2.5.4. Recent Developments
- 16.2.5.5. Financials (Based on Availability)
- 16.2.6 Dolphin Design SAS
- 16.2.6.1. Overview
- 16.2.6.2. Products
- 16.2.6.3. SWOT Analysis
- 16.2.6.4. Recent Developments
- 16.2.6.5. Financials (Based on Availability)
- 16.2.7 Arm Holdings
- 16.2.7.1. Overview
- 16.2.7.2. Products
- 16.2.7.3. SWOT Analysis
- 16.2.7.4. Recent Developments
- 16.2.7.5. Financials (Based on Availability)
- 16.2.8 Dolphin Technology Inc
- 16.2.8.1. Overview
- 16.2.8.2. Products
- 16.2.8.3. SWOT Analysis
- 16.2.8.4. Recent Developments
- 16.2.8.5. Financials (Based on Availability)
- 16.2.9 Surecore Ltd
- 16.2.9.1. Overview
- 16.2.9.2. Products
- 16.2.9.3. SWOT Analysis
- 16.2.9.4. Recent Developments
- 16.2.9.5. Financials (Based on Availability)
- 16.2.10 Renesas Electronics Corporation
- 16.2.10.1. Overview
- 16.2.10.2. Products
- 16.2.10.3. SWOT Analysis
- 16.2.10.4. Recent Developments
- 16.2.10.5. Financials (Based on Availability)
- 16.2.11 Synopsys Inc
- 16.2.11.1. Overview
- 16.2.11.2. Products
- 16.2.11.3. SWOT Analysis
- 16.2.11.4. Recent Developments
- 16.2.11.5. Financials (Based on Availability)
- 16.2.12 TDK Corporation
- 16.2.12.1. Overview
- 16.2.12.2. Products
- 16.2.12.3. SWOT Analysis
- 16.2.12.4. Recent Developments
- 16.2.12.5. Financials (Based on Availability)
- 16.2.13 eMemory Technology Inc
- 16.2.13.1. Overview
- 16.2.13.2. Products
- 16.2.13.3. SWOT Analysis
- 16.2.13.4. Recent Developments
- 16.2.13.5. Financials (Based on Availability)
- 16.2.14 Mentor Graphics Corporation
- 16.2.14.1. Overview
- 16.2.14.2. Products
- 16.2.14.3. SWOT Analysis
- 16.2.14.4. Recent Developments
- 16.2.14.5. Financials (Based on Availability)
- 16.2.1 Avalanche Technology Inc
List of Figures
- Figure 1: Global Global SRAM and ROM Design IP Market Revenue Breakdown (Million, %) by Region 2024 & 2032
- Figure 2: Global Global SRAM and ROM Design IP Market Volume Breakdown (K Unit, %) by Region 2024 & 2032
- Figure 3: North America Global SRAM and ROM Design IP Market Revenue (Million), by Country 2024 & 2032
- Figure 4: North America Global SRAM and ROM Design IP Market Volume (K Unit), by Country 2024 & 2032
- Figure 5: North America Global SRAM and ROM Design IP Market Revenue Share (%), by Country 2024 & 2032
- Figure 6: North America Global SRAM and ROM Design IP Market Volume Share (%), by Country 2024 & 2032
- Figure 7: Europe Global SRAM and ROM Design IP Market Revenue (Million), by Country 2024 & 2032
- Figure 8: Europe Global SRAM and ROM Design IP Market Volume (K Unit), by Country 2024 & 2032
- Figure 9: Europe Global SRAM and ROM Design IP Market Revenue Share (%), by Country 2024 & 2032
- Figure 10: Europe Global SRAM and ROM Design IP Market Volume Share (%), by Country 2024 & 2032
- Figure 11: Asia Pacific Global SRAM and ROM Design IP Market Revenue (Million), by Country 2024 & 2032
- Figure 12: Asia Pacific Global SRAM and ROM Design IP Market Volume (K Unit), by Country 2024 & 2032
- Figure 13: Asia Pacific Global SRAM and ROM Design IP Market Revenue Share (%), by Country 2024 & 2032
- Figure 14: Asia Pacific Global SRAM and ROM Design IP Market Volume Share (%), by Country 2024 & 2032
- Figure 15: Latin America Global SRAM and ROM Design IP Market Revenue (Million), by Country 2024 & 2032
- Figure 16: Latin America Global SRAM and ROM Design IP Market Volume (K Unit), by Country 2024 & 2032
- Figure 17: Latin America Global SRAM and ROM Design IP Market Revenue Share (%), by Country 2024 & 2032
- Figure 18: Latin America Global SRAM and ROM Design IP Market Volume Share (%), by Country 2024 & 2032
- Figure 19: Middle East Global SRAM and ROM Design IP Market Revenue (Million), by Country 2024 & 2032
- Figure 20: Middle East Global SRAM and ROM Design IP Market Volume (K Unit), by Country 2024 & 2032
- Figure 21: Middle East Global SRAM and ROM Design IP Market Revenue Share (%), by Country 2024 & 2032
- Figure 22: Middle East Global SRAM and ROM Design IP Market Volume Share (%), by Country 2024 & 2032
- Figure 23: North America Global SRAM and ROM Design IP Market Revenue (Million), by Type 2024 & 2032
- Figure 24: North America Global SRAM and ROM Design IP Market Volume (K Unit), by Type 2024 & 2032
- Figure 25: North America Global SRAM and ROM Design IP Market Revenue Share (%), by Type 2024 & 2032
- Figure 26: North America Global SRAM and ROM Design IP Market Volume Share (%), by Type 2024 & 2032
- Figure 27: North America Global SRAM and ROM Design IP Market Revenue (Million), by Application 2024 & 2032
- Figure 28: North America Global SRAM and ROM Design IP Market Volume (K Unit), by Application 2024 & 2032
- Figure 29: North America Global SRAM and ROM Design IP Market Revenue Share (%), by Application 2024 & 2032
- Figure 30: North America Global SRAM and ROM Design IP Market Volume Share (%), by Application 2024 & 2032
- Figure 31: North America Global SRAM and ROM Design IP Market Revenue (Million), by Geography 2024 & 2032
- Figure 32: North America Global SRAM and ROM Design IP Market Volume (K Unit), by Geography 2024 & 2032
- Figure 33: North America Global SRAM and ROM Design IP Market Revenue Share (%), by Geography 2024 & 2032
- Figure 34: North America Global SRAM and ROM Design IP Market Volume Share (%), by Geography 2024 & 2032
- Figure 35: North America Global SRAM and ROM Design IP Market Revenue (Million), by Country 2024 & 2032
- Figure 36: North America Global SRAM and ROM Design IP Market Volume (K Unit), by Country 2024 & 2032
- Figure 37: North America Global SRAM and ROM Design IP Market Revenue Share (%), by Country 2024 & 2032
- Figure 38: North America Global SRAM and ROM Design IP Market Volume Share (%), by Country 2024 & 2032
- Figure 39: South America Global SRAM and ROM Design IP Market Revenue (Million), by Type 2024 & 2032
- Figure 40: South America Global SRAM and ROM Design IP Market Volume (K Unit), by Type 2024 & 2032
- Figure 41: South America Global SRAM and ROM Design IP Market Revenue Share (%), by Type 2024 & 2032
- Figure 42: South America Global SRAM and ROM Design IP Market Volume Share (%), by Type 2024 & 2032
- Figure 43: South America Global SRAM and ROM Design IP Market Revenue (Million), by Application 2024 & 2032
- Figure 44: South America Global SRAM and ROM Design IP Market Volume (K Unit), by Application 2024 & 2032
- Figure 45: South America Global SRAM and ROM Design IP Market Revenue Share (%), by Application 2024 & 2032
- Figure 46: South America Global SRAM and ROM Design IP Market Volume Share (%), by Application 2024 & 2032
- Figure 47: South America Global SRAM and ROM Design IP Market Revenue (Million), by Geography 2024 & 2032
- Figure 48: South America Global SRAM and ROM Design IP Market Volume (K Unit), by Geography 2024 & 2032
- Figure 49: South America Global SRAM and ROM Design IP Market Revenue Share (%), by Geography 2024 & 2032
- Figure 50: South America Global SRAM and ROM Design IP Market Volume Share (%), by Geography 2024 & 2032
- Figure 51: South America Global SRAM and ROM Design IP Market Revenue (Million), by Country 2024 & 2032
- Figure 52: South America Global SRAM and ROM Design IP Market Volume (K Unit), by Country 2024 & 2032
- Figure 53: South America Global SRAM and ROM Design IP Market Revenue Share (%), by Country 2024 & 2032
- Figure 54: South America Global SRAM and ROM Design IP Market Volume Share (%), by Country 2024 & 2032
- Figure 55: Europe Global SRAM and ROM Design IP Market Revenue (Million), by Type 2024 & 2032
- Figure 56: Europe Global SRAM and ROM Design IP Market Volume (K Unit), by Type 2024 & 2032
- Figure 57: Europe Global SRAM and ROM Design IP Market Revenue Share (%), by Type 2024 & 2032
- Figure 58: Europe Global SRAM and ROM Design IP Market Volume Share (%), by Type 2024 & 2032
- Figure 59: Europe Global SRAM and ROM Design IP Market Revenue (Million), by Application 2024 & 2032
- Figure 60: Europe Global SRAM and ROM Design IP Market Volume (K Unit), by Application 2024 & 2032
- Figure 61: Europe Global SRAM and ROM Design IP Market Revenue Share (%), by Application 2024 & 2032
- Figure 62: Europe Global SRAM and ROM Design IP Market Volume Share (%), by Application 2024 & 2032
- Figure 63: Europe Global SRAM and ROM Design IP Market Revenue (Million), by Geography 2024 & 2032
- Figure 64: Europe Global SRAM and ROM Design IP Market Volume (K Unit), by Geography 2024 & 2032
- Figure 65: Europe Global SRAM and ROM Design IP Market Revenue Share (%), by Geography 2024 & 2032
- Figure 66: Europe Global SRAM and ROM Design IP Market Volume Share (%), by Geography 2024 & 2032
- Figure 67: Europe Global SRAM and ROM Design IP Market Revenue (Million), by Country 2024 & 2032
- Figure 68: Europe Global SRAM and ROM Design IP Market Volume (K Unit), by Country 2024 & 2032
- Figure 69: Europe Global SRAM and ROM Design IP Market Revenue Share (%), by Country 2024 & 2032
- Figure 70: Europe Global SRAM and ROM Design IP Market Volume Share (%), by Country 2024 & 2032
- Figure 71: Middle East & Africa Global SRAM and ROM Design IP Market Revenue (Million), by Type 2024 & 2032
- Figure 72: Middle East & Africa Global SRAM and ROM Design IP Market Volume (K Unit), by Type 2024 & 2032
- Figure 73: Middle East & Africa Global SRAM and ROM Design IP Market Revenue Share (%), by Type 2024 & 2032
- Figure 74: Middle East & Africa Global SRAM and ROM Design IP Market Volume Share (%), by Type 2024 & 2032
- Figure 75: Middle East & Africa Global SRAM and ROM Design IP Market Revenue (Million), by Application 2024 & 2032
- Figure 76: Middle East & Africa Global SRAM and ROM Design IP Market Volume (K Unit), by Application 2024 & 2032
- Figure 77: Middle East & Africa Global SRAM and ROM Design IP Market Revenue Share (%), by Application 2024 & 2032
- Figure 78: Middle East & Africa Global SRAM and ROM Design IP Market Volume Share (%), by Application 2024 & 2032
- Figure 79: Middle East & Africa Global SRAM and ROM Design IP Market Revenue (Million), by Geography 2024 & 2032
- Figure 80: Middle East & Africa Global SRAM and ROM Design IP Market Volume (K Unit), by Geography 2024 & 2032
- Figure 81: Middle East & Africa Global SRAM and ROM Design IP Market Revenue Share (%), by Geography 2024 & 2032
- Figure 82: Middle East & Africa Global SRAM and ROM Design IP Market Volume Share (%), by Geography 2024 & 2032
- Figure 83: Middle East & Africa Global SRAM and ROM Design IP Market Revenue (Million), by Country 2024 & 2032
- Figure 84: Middle East & Africa Global SRAM and ROM Design IP Market Volume (K Unit), by Country 2024 & 2032
- Figure 85: Middle East & Africa Global SRAM and ROM Design IP Market Revenue Share (%), by Country 2024 & 2032
- Figure 86: Middle East & Africa Global SRAM and ROM Design IP Market Volume Share (%), by Country 2024 & 2032
- Figure 87: Asia Pacific Global SRAM and ROM Design IP Market Revenue (Million), by Type 2024 & 2032
- Figure 88: Asia Pacific Global SRAM and ROM Design IP Market Volume (K Unit), by Type 2024 & 2032
- Figure 89: Asia Pacific Global SRAM and ROM Design IP Market Revenue Share (%), by Type 2024 & 2032
- Figure 90: Asia Pacific Global SRAM and ROM Design IP Market Volume Share (%), by Type 2024 & 2032
- Figure 91: Asia Pacific Global SRAM and ROM Design IP Market Revenue (Million), by Application 2024 & 2032
- Figure 92: Asia Pacific Global SRAM and ROM Design IP Market Volume (K Unit), by Application 2024 & 2032
- Figure 93: Asia Pacific Global SRAM and ROM Design IP Market Revenue Share (%), by Application 2024 & 2032
- Figure 94: Asia Pacific Global SRAM and ROM Design IP Market Volume Share (%), by Application 2024 & 2032
- Figure 95: Asia Pacific Global SRAM and ROM Design IP Market Revenue (Million), by Geography 2024 & 2032
- Figure 96: Asia Pacific Global SRAM and ROM Design IP Market Volume (K Unit), by Geography 2024 & 2032
- Figure 97: Asia Pacific Global SRAM and ROM Design IP Market Revenue Share (%), by Geography 2024 & 2032
- Figure 98: Asia Pacific Global SRAM and ROM Design IP Market Volume Share (%), by Geography 2024 & 2032
- Figure 99: Asia Pacific Global SRAM and ROM Design IP Market Revenue (Million), by Country 2024 & 2032
- Figure 100: Asia Pacific Global SRAM and ROM Design IP Market Volume (K Unit), by Country 2024 & 2032
- Figure 101: Asia Pacific Global SRAM and ROM Design IP Market Revenue Share (%), by Country 2024 & 2032
- Figure 102: Asia Pacific Global SRAM and ROM Design IP Market Volume Share (%), by Country 2024 & 2032
List of Tables
- Table 1: Global SRAM and ROM Design IP Market Revenue Million Forecast, by Region 2019 & 2032
- Table 2: Global SRAM and ROM Design IP Market Volume K Unit Forecast, by Region 2019 & 2032
- Table 3: Global SRAM and ROM Design IP Market Revenue Million Forecast, by Type 2019 & 2032
- Table 4: Global SRAM and ROM Design IP Market Volume K Unit Forecast, by Type 2019 & 2032
- Table 5: Global SRAM and ROM Design IP Market Revenue Million Forecast, by Application 2019 & 2032
- Table 6: Global SRAM and ROM Design IP Market Volume K Unit Forecast, by Application 2019 & 2032
- Table 7: Global SRAM and ROM Design IP Market Revenue Million Forecast, by Geography 2019 & 2032
- Table 8: Global SRAM and ROM Design IP Market Volume K Unit Forecast, by Geography 2019 & 2032
- Table 9: Global SRAM and ROM Design IP Market Revenue Million Forecast, by Region 2019 & 2032
- Table 10: Global SRAM and ROM Design IP Market Volume K Unit Forecast, by Region 2019 & 2032
- Table 11: Global SRAM and ROM Design IP Market Revenue Million Forecast, by Country 2019 & 2032
- Table 12: Global SRAM and ROM Design IP Market Volume K Unit Forecast, by Country 2019 & 2032
- Table 13: Global SRAM and ROM Design IP Market Revenue (Million) Forecast, by Application 2019 & 2032
- Table 14: Global SRAM and ROM Design IP Market Volume (K Unit) Forecast, by Application 2019 & 2032
- Table 15: Global SRAM and ROM Design IP Market Revenue Million Forecast, by Country 2019 & 2032
- Table 16: Global SRAM and ROM Design IP Market Volume K Unit Forecast, by Country 2019 & 2032
- Table 17: Global SRAM and ROM Design IP Market Revenue (Million) Forecast, by Application 2019 & 2032
- Table 18: Global SRAM and ROM Design IP Market Volume (K Unit) Forecast, by Application 2019 & 2032
- Table 19: Global SRAM and ROM Design IP Market Revenue Million Forecast, by Country 2019 & 2032
- Table 20: Global SRAM and ROM Design IP Market Volume K Unit Forecast, by Country 2019 & 2032
- Table 21: Global SRAM and ROM Design IP Market Revenue (Million) Forecast, by Application 2019 & 2032
- Table 22: Global SRAM and ROM Design IP Market Volume (K Unit) Forecast, by Application 2019 & 2032
- Table 23: Global SRAM and ROM Design IP Market Revenue Million Forecast, by Country 2019 & 2032
- Table 24: Global SRAM and ROM Design IP Market Volume K Unit Forecast, by Country 2019 & 2032
- Table 25: Global SRAM and ROM Design IP Market Revenue (Million) Forecast, by Application 2019 & 2032
- Table 26: Global SRAM and ROM Design IP Market Volume (K Unit) Forecast, by Application 2019 & 2032
- Table 27: Global SRAM and ROM Design IP Market Revenue Million Forecast, by Country 2019 & 2032
- Table 28: Global SRAM and ROM Design IP Market Volume K Unit Forecast, by Country 2019 & 2032
- Table 29: Global SRAM and ROM Design IP Market Revenue (Million) Forecast, by Application 2019 & 2032
- Table 30: Global SRAM and ROM Design IP Market Volume (K Unit) Forecast, by Application 2019 & 2032
- Table 31: Global SRAM and ROM Design IP Market Revenue Million Forecast, by Type 2019 & 2032
- Table 32: Global SRAM and ROM Design IP Market Volume K Unit Forecast, by Type 2019 & 2032
- Table 33: Global SRAM and ROM Design IP Market Revenue Million Forecast, by Application 2019 & 2032
- Table 34: Global SRAM and ROM Design IP Market Volume K Unit Forecast, by Application 2019 & 2032
- Table 35: Global SRAM and ROM Design IP Market Revenue Million Forecast, by Geography 2019 & 2032
- Table 36: Global SRAM and ROM Design IP Market Volume K Unit Forecast, by Geography 2019 & 2032
- Table 37: Global SRAM and ROM Design IP Market Revenue Million Forecast, by Country 2019 & 2032
- Table 38: Global SRAM and ROM Design IP Market Volume K Unit Forecast, by Country 2019 & 2032
- Table 39: United States Global SRAM and ROM Design IP Market Revenue (Million) Forecast, by Application 2019 & 2032
- Table 40: United States Global SRAM and ROM Design IP Market Volume (K Unit) Forecast, by Application 2019 & 2032
- Table 41: Canada Global SRAM and ROM Design IP Market Revenue (Million) Forecast, by Application 2019 & 2032
- Table 42: Canada Global SRAM and ROM Design IP Market Volume (K Unit) Forecast, by Application 2019 & 2032
- Table 43: Mexico Global SRAM and ROM Design IP Market Revenue (Million) Forecast, by Application 2019 & 2032
- Table 44: Mexico Global SRAM and ROM Design IP Market Volume (K Unit) Forecast, by Application 2019 & 2032
- Table 45: Global SRAM and ROM Design IP Market Revenue Million Forecast, by Type 2019 & 2032
- Table 46: Global SRAM and ROM Design IP Market Volume K Unit Forecast, by Type 2019 & 2032
- Table 47: Global SRAM and ROM Design IP Market Revenue Million Forecast, by Application 2019 & 2032
- Table 48: Global SRAM and ROM Design IP Market Volume K Unit Forecast, by Application 2019 & 2032
- Table 49: Global SRAM and ROM Design IP Market Revenue Million Forecast, by Geography 2019 & 2032
- Table 50: Global SRAM and ROM Design IP Market Volume K Unit Forecast, by Geography 2019 & 2032
- Table 51: Global SRAM and ROM Design IP Market Revenue Million Forecast, by Country 2019 & 2032
- Table 52: Global SRAM and ROM Design IP Market Volume K Unit Forecast, by Country 2019 & 2032
- Table 53: Brazil Global SRAM and ROM Design IP Market Revenue (Million) Forecast, by Application 2019 & 2032
- Table 54: Brazil Global SRAM and ROM Design IP Market Volume (K Unit) Forecast, by Application 2019 & 2032
- Table 55: Argentina Global SRAM and ROM Design IP Market Revenue (Million) Forecast, by Application 2019 & 2032
- Table 56: Argentina Global SRAM and ROM Design IP Market Volume (K Unit) Forecast, by Application 2019 & 2032
- Table 57: Rest of South America Global SRAM and ROM Design IP Market Revenue (Million) Forecast, by Application 2019 & 2032
- Table 58: Rest of South America Global SRAM and ROM Design IP Market Volume (K Unit) Forecast, by Application 2019 & 2032
- Table 59: Global SRAM and ROM Design IP Market Revenue Million Forecast, by Type 2019 & 2032
- Table 60: Global SRAM and ROM Design IP Market Volume K Unit Forecast, by Type 2019 & 2032
- Table 61: Global SRAM and ROM Design IP Market Revenue Million Forecast, by Application 2019 & 2032
- Table 62: Global SRAM and ROM Design IP Market Volume K Unit Forecast, by Application 2019 & 2032
- Table 63: Global SRAM and ROM Design IP Market Revenue Million Forecast, by Geography 2019 & 2032
- Table 64: Global SRAM and ROM Design IP Market Volume K Unit Forecast, by Geography 2019 & 2032
- Table 65: Global SRAM and ROM Design IP Market Revenue Million Forecast, by Country 2019 & 2032
- Table 66: Global SRAM and ROM Design IP Market Volume K Unit Forecast, by Country 2019 & 2032
- Table 67: United Kingdom Global SRAM and ROM Design IP Market Revenue (Million) Forecast, by Application 2019 & 2032
- Table 68: United Kingdom Global SRAM and ROM Design IP Market Volume (K Unit) Forecast, by Application 2019 & 2032
- Table 69: Germany Global SRAM and ROM Design IP Market Revenue (Million) Forecast, by Application 2019 & 2032
- Table 70: Germany Global SRAM and ROM Design IP Market Volume (K Unit) Forecast, by Application 2019 & 2032
- Table 71: France Global SRAM and ROM Design IP Market Revenue (Million) Forecast, by Application 2019 & 2032
- Table 72: France Global SRAM and ROM Design IP Market Volume (K Unit) Forecast, by Application 2019 & 2032
- Table 73: Italy Global SRAM and ROM Design IP Market Revenue (Million) Forecast, by Application 2019 & 2032
- Table 74: Italy Global SRAM and ROM Design IP Market Volume (K Unit) Forecast, by Application 2019 & 2032
- Table 75: Spain Global SRAM and ROM Design IP Market Revenue (Million) Forecast, by Application 2019 & 2032
- Table 76: Spain Global SRAM and ROM Design IP Market Volume (K Unit) Forecast, by Application 2019 & 2032
- Table 77: Russia Global SRAM and ROM Design IP Market Revenue (Million) Forecast, by Application 2019 & 2032
- Table 78: Russia Global SRAM and ROM Design IP Market Volume (K Unit) Forecast, by Application 2019 & 2032
- Table 79: Benelux Global SRAM and ROM Design IP Market Revenue (Million) Forecast, by Application 2019 & 2032
- Table 80: Benelux Global SRAM and ROM Design IP Market Volume (K Unit) Forecast, by Application 2019 & 2032
- Table 81: Nordics Global SRAM and ROM Design IP Market Revenue (Million) Forecast, by Application 2019 & 2032
- Table 82: Nordics Global SRAM and ROM Design IP Market Volume (K Unit) Forecast, by Application 2019 & 2032
- Table 83: Rest of Europe Global SRAM and ROM Design IP Market Revenue (Million) Forecast, by Application 2019 & 2032
- Table 84: Rest of Europe Global SRAM and ROM Design IP Market Volume (K Unit) Forecast, by Application 2019 & 2032
- Table 85: Global SRAM and ROM Design IP Market Revenue Million Forecast, by Type 2019 & 2032
- Table 86: Global SRAM and ROM Design IP Market Volume K Unit Forecast, by Type 2019 & 2032
- Table 87: Global SRAM and ROM Design IP Market Revenue Million Forecast, by Application 2019 & 2032
- Table 88: Global SRAM and ROM Design IP Market Volume K Unit Forecast, by Application 2019 & 2032
- Table 89: Global SRAM and ROM Design IP Market Revenue Million Forecast, by Geography 2019 & 2032
- Table 90: Global SRAM and ROM Design IP Market Volume K Unit Forecast, by Geography 2019 & 2032
- Table 91: Global SRAM and ROM Design IP Market Revenue Million Forecast, by Country 2019 & 2032
- Table 92: Global SRAM and ROM Design IP Market Volume K Unit Forecast, by Country 2019 & 2032
- Table 93: Turkey Global SRAM and ROM Design IP Market Revenue (Million) Forecast, by Application 2019 & 2032
- Table 94: Turkey Global SRAM and ROM Design IP Market Volume (K Unit) Forecast, by Application 2019 & 2032
- Table 95: Israel Global SRAM and ROM Design IP Market Revenue (Million) Forecast, by Application 2019 & 2032
- Table 96: Israel Global SRAM and ROM Design IP Market Volume (K Unit) Forecast, by Application 2019 & 2032
- Table 97: GCC Global SRAM and ROM Design IP Market Revenue (Million) Forecast, by Application 2019 & 2032
- Table 98: GCC Global SRAM and ROM Design IP Market Volume (K Unit) Forecast, by Application 2019 & 2032
- Table 99: North Africa Global SRAM and ROM Design IP Market Revenue (Million) Forecast, by Application 2019 & 2032
- Table 100: North Africa Global SRAM and ROM Design IP Market Volume (K Unit) Forecast, by Application 2019 & 2032
- Table 101: South Africa Global SRAM and ROM Design IP Market Revenue (Million) Forecast, by Application 2019 & 2032
- Table 102: South Africa Global SRAM and ROM Design IP Market Volume (K Unit) Forecast, by Application 2019 & 2032
- Table 103: Rest of Middle East & Africa Global SRAM and ROM Design IP Market Revenue (Million) Forecast, by Application 2019 & 2032
- Table 104: Rest of Middle East & Africa Global SRAM and ROM Design IP Market Volume (K Unit) Forecast, by Application 2019 & 2032
- Table 105: Global SRAM and ROM Design IP Market Revenue Million Forecast, by Type 2019 & 2032
- Table 106: Global SRAM and ROM Design IP Market Volume K Unit Forecast, by Type 2019 & 2032
- Table 107: Global SRAM and ROM Design IP Market Revenue Million Forecast, by Application 2019 & 2032
- Table 108: Global SRAM and ROM Design IP Market Volume K Unit Forecast, by Application 2019 & 2032
- Table 109: Global SRAM and ROM Design IP Market Revenue Million Forecast, by Geography 2019 & 2032
- Table 110: Global SRAM and ROM Design IP Market Volume K Unit Forecast, by Geography 2019 & 2032
- Table 111: Global SRAM and ROM Design IP Market Revenue Million Forecast, by Country 2019 & 2032
- Table 112: Global SRAM and ROM Design IP Market Volume K Unit Forecast, by Country 2019 & 2032
- Table 113: China Global SRAM and ROM Design IP Market Revenue (Million) Forecast, by Application 2019 & 2032
- Table 114: China Global SRAM and ROM Design IP Market Volume (K Unit) Forecast, by Application 2019 & 2032
- Table 115: India Global SRAM and ROM Design IP Market Revenue (Million) Forecast, by Application 2019 & 2032
- Table 116: India Global SRAM and ROM Design IP Market Volume (K Unit) Forecast, by Application 2019 & 2032
- Table 117: Japan Global SRAM and ROM Design IP Market Revenue (Million) Forecast, by Application 2019 & 2032
- Table 118: Japan Global SRAM and ROM Design IP Market Volume (K Unit) Forecast, by Application 2019 & 2032
- Table 119: South Korea Global SRAM and ROM Design IP Market Revenue (Million) Forecast, by Application 2019 & 2032
- Table 120: South Korea Global SRAM and ROM Design IP Market Volume (K Unit) Forecast, by Application 2019 & 2032
- Table 121: ASEAN Global SRAM and ROM Design IP Market Revenue (Million) Forecast, by Application 2019 & 2032
- Table 122: ASEAN Global SRAM and ROM Design IP Market Volume (K Unit) Forecast, by Application 2019 & 2032
- Table 123: Oceania Global SRAM and ROM Design IP Market Revenue (Million) Forecast, by Application 2019 & 2032
- Table 124: Oceania Global SRAM and ROM Design IP Market Volume (K Unit) Forecast, by Application 2019 & 2032
- Table 125: Rest of Asia Pacific Global SRAM and ROM Design IP Market Revenue (Million) Forecast, by Application 2019 & 2032
- Table 126: Rest of Asia Pacific Global SRAM and ROM Design IP Market Volume (K Unit) Forecast, by Application 2019 & 2032
Frequently Asked Questions
1. What is the projected Compound Annual Growth Rate (CAGR) of the Global SRAM and ROM Design IP Market?
The projected CAGR is approximately -1.54%.
2. Which companies are prominent players in the Global SRAM and ROM Design IP Market?
Key companies in the market include Avalanche Technology Inc, Everspin Technologies Inc, TekStart LLC, Verisilicon Holdings Co Ltd, Xilinx Inc, Dolphin Design SAS, Arm Holdings, Dolphin Technology Inc, Surecore Ltd, Renesas Electronics Corporation, Synopsys Inc, TDK Corporation, eMemory Technology Inc, Mentor Graphics Corporation.
3. What are the main segments of the Global SRAM and ROM Design IP Market?
The market segments include Type, Application, Geography.
4. Can you provide details about the market size?
The market size is estimated to be USD XX Million as of 2022.
5. What are some drivers contributing to market growth?
Increase in Demand for Autonomous Driving Technology; Growth in Edge Analytics for IoT Application.
6. What are the notable trends driving market growth?
Increasing Demand For Enterprise Storage Applications to Drive the Growth for MRAM.
7. Are there any restraints impacting market growth?
Complexity in Design and AI Interface.
8. Can you provide examples of recent developments in the market?
N/A
9. What pricing options are available for accessing the report?
Pricing options include single-user, multi-user, and enterprise licenses priced at USD 3800, USD 4500, and USD 5800 respectively.
10. Is the market size provided in terms of value or volume?
The market size is provided in terms of value, measured in Million and volume, measured in K Unit.
11. Are there any specific market keywords associated with the report?
Yes, the market keyword associated with the report is "Global SRAM and ROM Design IP Market," which aids in identifying and referencing the specific market segment covered.
12. How do I determine which pricing option suits my needs best?
The pricing options vary based on user requirements and access needs. Individual users may opt for single-user licenses, while businesses requiring broader access may choose multi-user or enterprise licenses for cost-effective access to the report.
13. Are there any additional resources or data provided in the Global SRAM and ROM Design IP Market report?
While the report offers comprehensive insights, it's advisable to review the specific contents or supplementary materials provided to ascertain if additional resources or data are available.
14. How can I stay updated on further developments or reports in the Global SRAM and ROM Design IP Market?
To stay informed about further developments, trends, and reports in the Global SRAM and ROM Design IP Market, consider subscribing to industry newsletters, following relevant companies and organizations, or regularly checking reputable industry news sources and publications.
Methodology
Step 1 - Identification of Relevant Samples Size from Population Database


Step 2 - Approaches for Defining Global Market Size (Value, Volume* & Price*)

Note*: In applicable scenarios
Step 3 - Data Sources
Primary Research
- Web Analytics
- Survey Reports
- Research Institute
- Latest Research Reports
- Opinion Leaders
Secondary Research
- Annual Reports
- White Paper
- Latest Press Release
- Industry Association
- Paid Database
- Investor Presentations

Step 4 - Data Triangulation
Involves using different sources of information in order to increase the validity of a study
These sources are likely to be stakeholders in a program - participants, other researchers, program staff, other community members, and so on.
Then we put all data in single framework & apply various statistical tools to find out the dynamic on the market.
During the analysis stage, feedback from the stakeholder groups would be compared to determine areas of agreement as well as areas of divergence
