

Key Insights
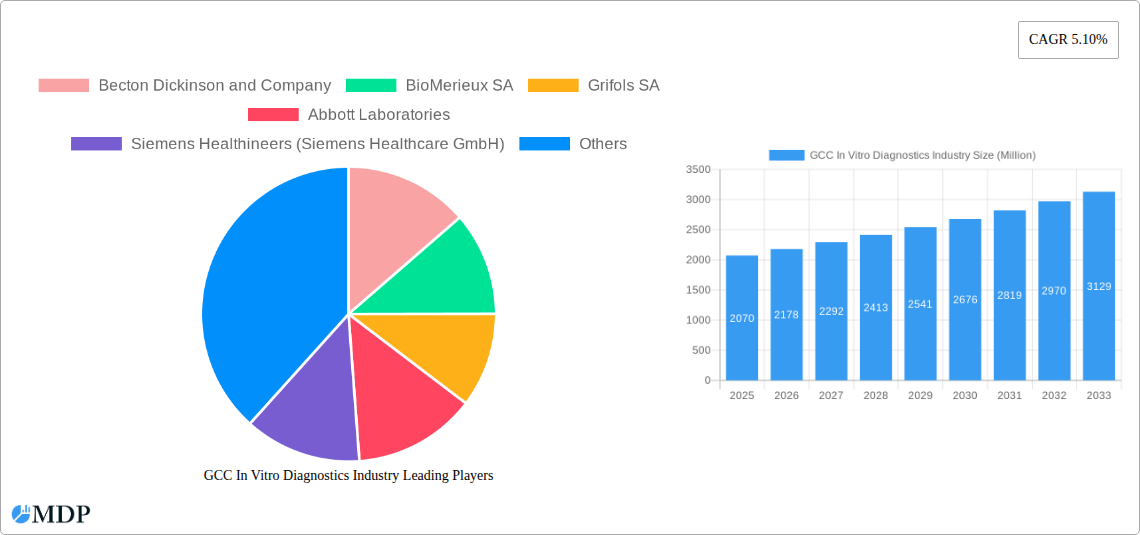
The GCC In Vitro Diagnostics (IVD) market, currently valued at approximately $2.07 billion in 2025, is projected to experience robust growth, driven by several key factors. The rising prevalence of chronic diseases like diabetes and cardiovascular conditions, coupled with an aging population, significantly fuels demand for diagnostic testing. Increased healthcare expenditure within the GCC region, along with government initiatives promoting preventative healthcare and early disease detection, further contribute to market expansion. Technological advancements, such as the adoption of point-of-care diagnostics and molecular diagnostics, are streamlining testing processes and improving accuracy, further boosting market growth. The market is segmented by product type (instruments, reagents, and other products), application (infectious diseases, diabetes, oncology, cardiology, and autoimmune diseases), and end-user (hospitals and clinics, diagnostic laboratories). The preference for advanced diagnostic techniques, like molecular diagnostics and immunochemistry, is also shaping market trends. While data limitations prevent precise regional breakdowns, the substantial investments in healthcare infrastructure and the growing awareness of health issues within the GCC suggest a strong and continuously expanding market potential. Competition in the market is fierce, with major players like Becton Dickinson, BioMerieux, Abbott Laboratories, and Roche actively engaged in product development and strategic acquisitions to maintain market share.
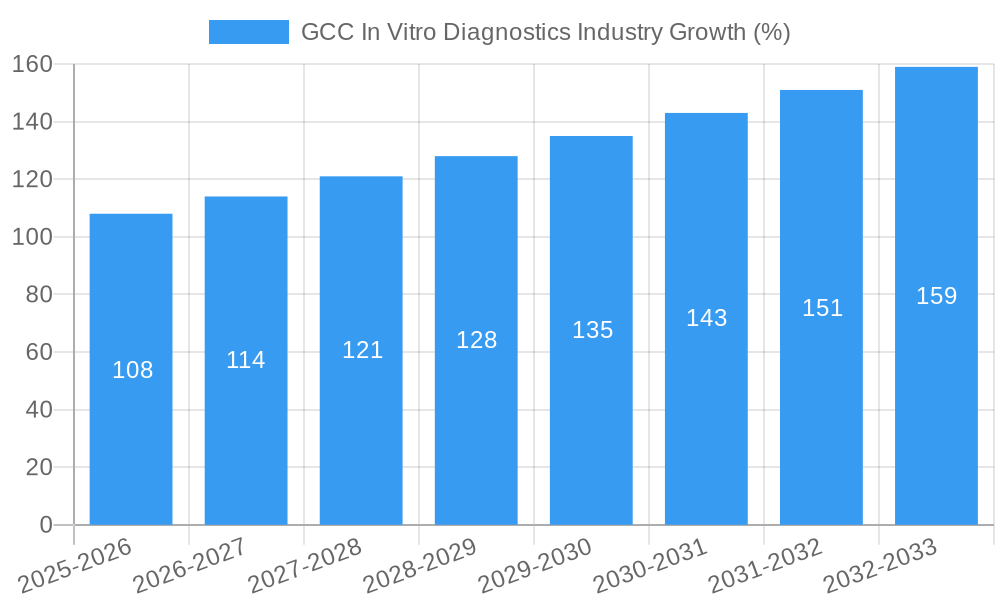
A projected Compound Annual Growth Rate (CAGR) of 5.10% from 2025 to 2033 indicates a significant upward trajectory for the GCC IVD market. This growth is anticipated to be propelled by several factors including improved healthcare infrastructure, increased healthcare spending, and a heightened focus on preventive healthcare initiatives across the region. The segment of reusable IVD devices, coupled with the adoption of centralized laboratory-based diagnostics, are predicted to capture a significant portion of the market share, although point-of-care diagnostics are expected to see considerable growth due to convenience and rapid results. Furthermore, the increasing prevalence of infectious diseases and the continued expansion of private healthcare facilities will contribute to the overall growth. The market's future success will depend heavily on the region's sustained economic growth, further investment in healthcare, and the continued adoption of advanced technologies.
GCC In Vitro Diagnostics Industry: A Comprehensive Market Report (2019-2033)
This comprehensive report provides an in-depth analysis of the GCC In Vitro Diagnostics (IVD) industry, offering valuable insights for stakeholders, investors, and industry professionals. The report covers the period 2019-2033, with a focus on the estimated year 2025 and a forecast period of 2025-2033. It analyzes market dynamics, leading players, emerging trends, and future growth potential, incorporating crucial data and projections to empower informed decision-making. This report leverages high-impact keywords, including "GCC In Vitro Diagnostics," "IVD Market," "Point-of-Care Diagnostics," "Molecular Diagnostics," and more, to ensure maximum search engine visibility and attract a wide audience.
GCC In Vitro Diagnostics Industry Market Dynamics & Concentration
The GCC IVD market is experiencing robust growth, driven by factors such as rising prevalence of chronic diseases, increasing healthcare expenditure, and government initiatives promoting healthcare infrastructure development. Market concentration is moderate, with several multinational corporations and regional players holding significant market share. The market is characterized by intense competition, with companies focusing on innovation, product diversification, and strategic acquisitions to gain a competitive edge.
Market Dynamics:
- Innovation Drivers: Advancements in molecular diagnostics, point-of-care testing, and automation are driving market innovation.
- Regulatory Frameworks: Stringent regulatory approvals and quality control measures influence market dynamics.
- Product Substitutes: The emergence of advanced diagnostic techniques creates competition and influences adoption rates.
- End-User Trends: Growing preference for faster, more accurate, and convenient diagnostic tests fuels market growth.
- M&A Activities: The number of M&A deals in the GCC IVD market is estimated at xx deals in the historical period (2019-2024), indicating a trend of consolidation and expansion by major players. Market share is distributed among key players, with the top 5 companies holding an estimated xx% of the market share.
GCC In Vitro Diagnostics Industry Industry Trends & Analysis
The GCC IVD market exhibits a robust Compound Annual Growth Rate (CAGR) of xx% during the forecast period (2025-2033). This growth is propelled by several key factors, including a rising prevalence of chronic diseases like diabetes and cancer, increasing healthcare expenditure across the region, and growing adoption of advanced diagnostic technologies. Market penetration for point-of-care diagnostics is increasing steadily, driven by demand for rapid and convenient testing solutions. Technological disruptions, such as the adoption of AI and big data analytics, are transforming the diagnostic landscape, leading to improved accuracy and efficiency. Consumer preferences are shifting toward personalized and preventative healthcare, which in turn impacts demand for specific diagnostic tests. Competitive dynamics are characterized by the entry of new players, the development of innovative diagnostic solutions, and strategic partnerships aimed at expanding market reach.
Leading Markets & Segments in GCC In Vitro Diagnostics Industry
The UAE and Saudi Arabia are the leading markets within the GCC region, driven by substantial healthcare investments, advanced medical infrastructure, and a large patient population. Within the various segments, the following show notable dominance:
Dominant Segments:
- Usability: Disposable IVD devices account for the largest segment due to convenience and cost-effectiveness.
- Application: Infectious disease diagnostics holds a significant market share, reflecting the prevalence of infectious diseases in the region.
- End User: Diagnostic laboratories and hospitals and clinics represent the largest end-user segments.
- Diagnostic Approach: Centralized laboratory-based diagnostics still dominate, although Point-of-Care diagnostics are rapidly gaining traction.
- Technique: Immunochemistry and molecular diagnostics are prominent, driven by technological advancements and clinical needs.
- Product: Reagents hold a larger market share compared to instruments, reflecting high volumes in routine testing.
Key Drivers:
- Economic Policies: Government initiatives to improve healthcare infrastructure and increase healthcare spending are crucial drivers.
- Infrastructure: Improved healthcare infrastructure in major cities facilitates the adoption of advanced diagnostic technologies.
GCC In Vitro Diagnostics Industry Product Developments
Recent product innovations focus on enhancing diagnostic accuracy, speed, and ease of use. Point-of-care testing devices with advanced features and integrated software are gaining popularity. Miniaturization and automation are prominent trends, aimed at improving efficiency and reducing costs. The focus on developing user-friendly devices and efficient diagnostic workflows improves access to healthcare services. These developments aim to meet the growing demand for rapid and accurate diagnostics, catering to diverse clinical needs and improving overall healthcare outcomes.
Key Drivers of GCC In Vitro Diagnostics Industry Growth
Technological advancements, such as AI-powered diagnostic tools and improved molecular diagnostic techniques, are accelerating market expansion. Strong economic growth in the GCC region, coupled with increased healthcare expenditure and investments in healthcare infrastructure, create a favorable environment for market growth. Government regulations supporting the development and adoption of advanced diagnostic solutions further propel the market forward. For example, initiatives to improve disease surveillance and strengthen public health infrastructure create increased demand for advanced IVD technologies.
Challenges in the GCC In Vitro Diagnostics Industry Market
Regulatory hurdles and varying approval processes across different GCC countries create complexity for market entry. Supply chain disruptions and potential price fluctuations of raw materials impact market stability. Intense competition among established players and the emergence of new market entrants pose challenges to profitability and market share. These factors, if not mitigated, could collectively reduce overall market growth by an estimated xx% by 2033.
Emerging Opportunities in GCC In Vitro Diagnostics Industry
The development and adoption of innovative diagnostic techniques, such as liquid biopsies and personalized medicine approaches, represent significant opportunities. Strategic partnerships between multinational companies and local healthcare providers facilitate market expansion and improve access to advanced technologies. Expanding into underserved areas and addressing the growing demand for point-of-care and home-based diagnostics offers substantial growth potential.
Leading Players in the GCC In Vitro Diagnostics Industry Sector
- Becton Dickinson and Company
- BioMerieux SA
- Grifols SA
- Abbott Laboratories
- Siemens Healthineers (Siemens Healthcare GmbH)
- Danaher Corporation
- F Hoffmann-La Roche AG
- DiaSorin
- Thermo Fischer Scientific Inc
- Qiagen NV
- Sysmex Corporation
- Bio-Rad Laboratories
Key Milestones in GCC In Vitro Diagnostics Industry Industry
- July 2022: Saudi Arabia's Arabian International Healthcare Holding Company, TIBBIYAH, launched a Joint Venture (JV) with Swiss company Unilabs Diagnostics AB, expanding diagnostic services and market competition.
- April 2022: The United Arab Emirates Sheikh Shakhbout Medical City (SSMC) launched a point-of-care tool for antimicrobial management, enhancing healthcare efficiency and antimicrobial stewardship.
Strategic Outlook for GCC In Vitro Diagnostics Industry Market
The GCC IVD market is poised for continued growth, driven by technological advancements, increasing healthcare spending, and favorable government policies. Strategic partnerships and investments in research and development will further fuel market expansion. The focus on personalized medicine and preventative healthcare will create opportunities for innovative diagnostic solutions, leading to significant growth in the coming years. The long-term outlook remains positive, with substantial potential for market expansion across various segments.
GCC In Vitro Diagnostics Industry Segmentation
-
1. Technique
- 1.1. Histochemistry
- 1.2. Molecular Diagnostics
- 1.3. Hematology
- 1.4. Self-blood Glucose Testing
- 1.5. Immunochemistry
- 1.6. Other Techniques
-
2. Product
- 2.1. Instrument
- 2.2. Reagent
- 2.3. Other Products
-
3. Usability
- 3.1. Disposable IVD Device
- 3.2. Reusable IVD Device
-
4. Application
- 4.1. Infectious Disease
- 4.2. Diabetes
- 4.3. Cancer/Oncology
- 4.4. Cardiology
- 4.5. Autoimmune Disease
- 4.6. Other Applications
-
5. End User
- 5.1. Diagnostic Laboratories
- 5.2. Hospitals and Clinics
- 5.3. Other End Users
-
6. Diagnostic Approach
- 6.1. Point-of-Care Diagnostics
- 6.2. Centralized Laboratory-based Diagnostics
GCC In Vitro Diagnostics Industry Segmentation By Geography
-
1. North America
- 1.1. United States
- 1.2. Canada
- 1.3. Mexico
-
2. South America
- 2.1. Brazil
- 2.2. Argentina
- 2.3. Rest of South America
-
3. Europe
- 3.1. United Kingdom
- 3.2. Germany
- 3.3. France
- 3.4. Italy
- 3.5. Spain
- 3.6. Russia
- 3.7. Benelux
- 3.8. Nordics
- 3.9. Rest of Europe
-
4. Middle East & Africa
- 4.1. Turkey
- 4.2. Israel
- 4.3. GCC
- 4.4. North Africa
- 4.5. South Africa
- 4.6. Rest of Middle East & Africa
-
5. Asia Pacific
- 5.1. China
- 5.2. India
- 5.3. Japan
- 5.4. South Korea
- 5.5. ASEAN
- 5.6. Oceania
- 5.7. Rest of Asia Pacific
GCC In Vitro Diagnostics Industry REPORT HIGHLIGHTS
| Aspects | Details |
|---|---|
| Study Period | 2019-2033 |
| Base Year | 2024 |
| Estimated Year | 2025 |
| Forecast Period | 2025-2033 |
| Historical Period | 2019-2024 |
| Growth Rate | CAGR of 5.10% from 2019-2033 |
| Segmentation |
|
Table of Contents
- 1. Introduction
- 1.1. Research Scope
- 1.2. Market Segmentation
- 1.3. Research Methodology
- 1.4. Definitions and Assumptions
- 2. Executive Summary
- 2.1. Introduction
- 3. Market Dynamics
- 3.1. Introduction
- 3.2. Market Drivers
- 3.2.1. Growing Burden of Chronic Diseases and Infectious Diseases; Increasing Healthcare Expenditure
- 3.3. Market Restrains
- 3.3.1. Stringent Regulations
- 3.4. Market Trends
- 3.4.1. Point-of-care diagnostics Segment is Expected to Witness Growth Over The Forecast Period.
- 4. Market Factor Analysis
- 4.1. Porters Five Forces
- 4.2. Supply/Value Chain
- 4.3. PESTEL analysis
- 4.4. Market Entropy
- 4.5. Patent/Trademark Analysis
- 5. Global GCC In Vitro Diagnostics Industry Analysis, Insights and Forecast, 2019-2031
- 5.1. Market Analysis, Insights and Forecast - by Technique
- 5.1.1. Histochemistry
- 5.1.2. Molecular Diagnostics
- 5.1.3. Hematology
- 5.1.4. Self-blood Glucose Testing
- 5.1.5. Immunochemistry
- 5.1.6. Other Techniques
- 5.2. Market Analysis, Insights and Forecast - by Product
- 5.2.1. Instrument
- 5.2.2. Reagent
- 5.2.3. Other Products
- 5.3. Market Analysis, Insights and Forecast - by Usability
- 5.3.1. Disposable IVD Device
- 5.3.2. Reusable IVD Device
- 5.4. Market Analysis, Insights and Forecast - by Application
- 5.4.1. Infectious Disease
- 5.4.2. Diabetes
- 5.4.3. Cancer/Oncology
- 5.4.4. Cardiology
- 5.4.5. Autoimmune Disease
- 5.4.6. Other Applications
- 5.5. Market Analysis, Insights and Forecast - by End User
- 5.5.1. Diagnostic Laboratories
- 5.5.2. Hospitals and Clinics
- 5.5.3. Other End Users
- 5.6. Market Analysis, Insights and Forecast - by Diagnostic Approach
- 5.6.1. Point-of-Care Diagnostics
- 5.6.2. Centralized Laboratory-based Diagnostics
- 5.7. Market Analysis, Insights and Forecast - by Region
- 5.7.1. North America
- 5.7.2. South America
- 5.7.3. Europe
- 5.7.4. Middle East & Africa
- 5.7.5. Asia Pacific
- 5.1. Market Analysis, Insights and Forecast - by Technique
- 6. North America GCC In Vitro Diagnostics Industry Analysis, Insights and Forecast, 2019-2031
- 6.1. Market Analysis, Insights and Forecast - by Technique
- 6.1.1. Histochemistry
- 6.1.2. Molecular Diagnostics
- 6.1.3. Hematology
- 6.1.4. Self-blood Glucose Testing
- 6.1.5. Immunochemistry
- 6.1.6. Other Techniques
- 6.2. Market Analysis, Insights and Forecast - by Product
- 6.2.1. Instrument
- 6.2.2. Reagent
- 6.2.3. Other Products
- 6.3. Market Analysis, Insights and Forecast - by Usability
- 6.3.1. Disposable IVD Device
- 6.3.2. Reusable IVD Device
- 6.4. Market Analysis, Insights and Forecast - by Application
- 6.4.1. Infectious Disease
- 6.4.2. Diabetes
- 6.4.3. Cancer/Oncology
- 6.4.4. Cardiology
- 6.4.5. Autoimmune Disease
- 6.4.6. Other Applications
- 6.5. Market Analysis, Insights and Forecast - by End User
- 6.5.1. Diagnostic Laboratories
- 6.5.2. Hospitals and Clinics
- 6.5.3. Other End Users
- 6.6. Market Analysis, Insights and Forecast - by Diagnostic Approach
- 6.6.1. Point-of-Care Diagnostics
- 6.6.2. Centralized Laboratory-based Diagnostics
- 6.1. Market Analysis, Insights and Forecast - by Technique
- 7. South America GCC In Vitro Diagnostics Industry Analysis, Insights and Forecast, 2019-2031
- 7.1. Market Analysis, Insights and Forecast - by Technique
- 7.1.1. Histochemistry
- 7.1.2. Molecular Diagnostics
- 7.1.3. Hematology
- 7.1.4. Self-blood Glucose Testing
- 7.1.5. Immunochemistry
- 7.1.6. Other Techniques
- 7.2. Market Analysis, Insights and Forecast - by Product
- 7.2.1. Instrument
- 7.2.2. Reagent
- 7.2.3. Other Products
- 7.3. Market Analysis, Insights and Forecast - by Usability
- 7.3.1. Disposable IVD Device
- 7.3.2. Reusable IVD Device
- 7.4. Market Analysis, Insights and Forecast - by Application
- 7.4.1. Infectious Disease
- 7.4.2. Diabetes
- 7.4.3. Cancer/Oncology
- 7.4.4. Cardiology
- 7.4.5. Autoimmune Disease
- 7.4.6. Other Applications
- 7.5. Market Analysis, Insights and Forecast - by End User
- 7.5.1. Diagnostic Laboratories
- 7.5.2. Hospitals and Clinics
- 7.5.3. Other End Users
- 7.6. Market Analysis, Insights and Forecast - by Diagnostic Approach
- 7.6.1. Point-of-Care Diagnostics
- 7.6.2. Centralized Laboratory-based Diagnostics
- 7.1. Market Analysis, Insights and Forecast - by Technique
- 8. Europe GCC In Vitro Diagnostics Industry Analysis, Insights and Forecast, 2019-2031
- 8.1. Market Analysis, Insights and Forecast - by Technique
- 8.1.1. Histochemistry
- 8.1.2. Molecular Diagnostics
- 8.1.3. Hematology
- 8.1.4. Self-blood Glucose Testing
- 8.1.5. Immunochemistry
- 8.1.6. Other Techniques
- 8.2. Market Analysis, Insights and Forecast - by Product
- 8.2.1. Instrument
- 8.2.2. Reagent
- 8.2.3. Other Products
- 8.3. Market Analysis, Insights and Forecast - by Usability
- 8.3.1. Disposable IVD Device
- 8.3.2. Reusable IVD Device
- 8.4. Market Analysis, Insights and Forecast - by Application
- 8.4.1. Infectious Disease
- 8.4.2. Diabetes
- 8.4.3. Cancer/Oncology
- 8.4.4. Cardiology
- 8.4.5. Autoimmune Disease
- 8.4.6. Other Applications
- 8.5. Market Analysis, Insights and Forecast - by End User
- 8.5.1. Diagnostic Laboratories
- 8.5.2. Hospitals and Clinics
- 8.5.3. Other End Users
- 8.6. Market Analysis, Insights and Forecast - by Diagnostic Approach
- 8.6.1. Point-of-Care Diagnostics
- 8.6.2. Centralized Laboratory-based Diagnostics
- 8.1. Market Analysis, Insights and Forecast - by Technique
- 9. Middle East & Africa GCC In Vitro Diagnostics Industry Analysis, Insights and Forecast, 2019-2031
- 9.1. Market Analysis, Insights and Forecast - by Technique
- 9.1.1. Histochemistry
- 9.1.2. Molecular Diagnostics
- 9.1.3. Hematology
- 9.1.4. Self-blood Glucose Testing
- 9.1.5. Immunochemistry
- 9.1.6. Other Techniques
- 9.2. Market Analysis, Insights and Forecast - by Product
- 9.2.1. Instrument
- 9.2.2. Reagent
- 9.2.3. Other Products
- 9.3. Market Analysis, Insights and Forecast - by Usability
- 9.3.1. Disposable IVD Device
- 9.3.2. Reusable IVD Device
- 9.4. Market Analysis, Insights and Forecast - by Application
- 9.4.1. Infectious Disease
- 9.4.2. Diabetes
- 9.4.3. Cancer/Oncology
- 9.4.4. Cardiology
- 9.4.5. Autoimmune Disease
- 9.4.6. Other Applications
- 9.5. Market Analysis, Insights and Forecast - by End User
- 9.5.1. Diagnostic Laboratories
- 9.5.2. Hospitals and Clinics
- 9.5.3. Other End Users
- 9.6. Market Analysis, Insights and Forecast - by Diagnostic Approach
- 9.6.1. Point-of-Care Diagnostics
- 9.6.2. Centralized Laboratory-based Diagnostics
- 9.1. Market Analysis, Insights and Forecast - by Technique
- 10. Asia Pacific GCC In Vitro Diagnostics Industry Analysis, Insights and Forecast, 2019-2031
- 10.1. Market Analysis, Insights and Forecast - by Technique
- 10.1.1. Histochemistry
- 10.1.2. Molecular Diagnostics
- 10.1.3. Hematology
- 10.1.4. Self-blood Glucose Testing
- 10.1.5. Immunochemistry
- 10.1.6. Other Techniques
- 10.2. Market Analysis, Insights and Forecast - by Product
- 10.2.1. Instrument
- 10.2.2. Reagent
- 10.2.3. Other Products
- 10.3. Market Analysis, Insights and Forecast - by Usability
- 10.3.1. Disposable IVD Device
- 10.3.2. Reusable IVD Device
- 10.4. Market Analysis, Insights and Forecast - by Application
- 10.4.1. Infectious Disease
- 10.4.2. Diabetes
- 10.4.3. Cancer/Oncology
- 10.4.4. Cardiology
- 10.4.5. Autoimmune Disease
- 10.4.6. Other Applications
- 10.5. Market Analysis, Insights and Forecast - by End User
- 10.5.1. Diagnostic Laboratories
- 10.5.2. Hospitals and Clinics
- 10.5.3. Other End Users
- 10.6. Market Analysis, Insights and Forecast - by Diagnostic Approach
- 10.6.1. Point-of-Care Diagnostics
- 10.6.2. Centralized Laboratory-based Diagnostics
- 10.1. Market Analysis, Insights and Forecast - by Technique
- 11. Competitive Analysis
- 11.1. Global Market Share Analysis 2024
- 11.2. Company Profiles
- 11.2.1 Becton Dickinson and Company
- 11.2.1.1. Overview
- 11.2.1.2. Products
- 11.2.1.3. SWOT Analysis
- 11.2.1.4. Recent Developments
- 11.2.1.5. Financials (Based on Availability)
- 11.2.2 BioMerieux SA
- 11.2.2.1. Overview
- 11.2.2.2. Products
- 11.2.2.3. SWOT Analysis
- 11.2.2.4. Recent Developments
- 11.2.2.5. Financials (Based on Availability)
- 11.2.3 Grifols SA
- 11.2.3.1. Overview
- 11.2.3.2. Products
- 11.2.3.3. SWOT Analysis
- 11.2.3.4. Recent Developments
- 11.2.3.5. Financials (Based on Availability)
- 11.2.4 Abbott Laboratories
- 11.2.4.1. Overview
- 11.2.4.2. Products
- 11.2.4.3. SWOT Analysis
- 11.2.4.4. Recent Developments
- 11.2.4.5. Financials (Based on Availability)
- 11.2.5 Siemens Healthineers (Siemens Healthcare GmbH)
- 11.2.5.1. Overview
- 11.2.5.2. Products
- 11.2.5.3. SWOT Analysis
- 11.2.5.4. Recent Developments
- 11.2.5.5. Financials (Based on Availability)
- 11.2.6 Danaher Corporation
- 11.2.6.1. Overview
- 11.2.6.2. Products
- 11.2.6.3. SWOT Analysis
- 11.2.6.4. Recent Developments
- 11.2.6.5. Financials (Based on Availability)
- 11.2.7 F Hoffmann-La Roche AG
- 11.2.7.1. Overview
- 11.2.7.2. Products
- 11.2.7.3. SWOT Analysis
- 11.2.7.4. Recent Developments
- 11.2.7.5. Financials (Based on Availability)
- 11.2.8 DiaSorin
- 11.2.8.1. Overview
- 11.2.8.2. Products
- 11.2.8.3. SWOT Analysis
- 11.2.8.4. Recent Developments
- 11.2.8.5. Financials (Based on Availability)
- 11.2.9 Thermo Fischer Scientific Inc
- 11.2.9.1. Overview
- 11.2.9.2. Products
- 11.2.9.3. SWOT Analysis
- 11.2.9.4. Recent Developments
- 11.2.9.5. Financials (Based on Availability)
- 11.2.10 Qiagen NV
- 11.2.10.1. Overview
- 11.2.10.2. Products
- 11.2.10.3. SWOT Analysis
- 11.2.10.4. Recent Developments
- 11.2.10.5. Financials (Based on Availability)
- 11.2.11 Sysmex Corporation
- 11.2.11.1. Overview
- 11.2.11.2. Products
- 11.2.11.3. SWOT Analysis
- 11.2.11.4. Recent Developments
- 11.2.11.5. Financials (Based on Availability)
- 11.2.12 Bio-Rad Laboratories
- 11.2.12.1. Overview
- 11.2.12.2. Products
- 11.2.12.3. SWOT Analysis
- 11.2.12.4. Recent Developments
- 11.2.12.5. Financials (Based on Availability)
- 11.2.1 Becton Dickinson and Company
List of Figures
- Figure 1: Global GCC In Vitro Diagnostics Industry Revenue Breakdown (Million, %) by Region 2024 & 2032
- Figure 2: Global GCC In Vitro Diagnostics Industry Volume Breakdown (K Unit, %) by Region 2024 & 2032
- Figure 3: US GCC In Vitro Diagnostics Industry Revenue (Million), by Country 2024 & 2032
- Figure 4: US GCC In Vitro Diagnostics Industry Volume (K Unit), by Country 2024 & 2032
- Figure 5: US GCC In Vitro Diagnostics Industry Revenue Share (%), by Country 2024 & 2032
- Figure 6: US GCC In Vitro Diagnostics Industry Volume Share (%), by Country 2024 & 2032
- Figure 7: North America GCC In Vitro Diagnostics Industry Revenue (Million), by Technique 2024 & 2032
- Figure 8: North America GCC In Vitro Diagnostics Industry Volume (K Unit), by Technique 2024 & 2032
- Figure 9: North America GCC In Vitro Diagnostics Industry Revenue Share (%), by Technique 2024 & 2032
- Figure 10: North America GCC In Vitro Diagnostics Industry Volume Share (%), by Technique 2024 & 2032
- Figure 11: North America GCC In Vitro Diagnostics Industry Revenue (Million), by Product 2024 & 2032
- Figure 12: North America GCC In Vitro Diagnostics Industry Volume (K Unit), by Product 2024 & 2032
- Figure 13: North America GCC In Vitro Diagnostics Industry Revenue Share (%), by Product 2024 & 2032
- Figure 14: North America GCC In Vitro Diagnostics Industry Volume Share (%), by Product 2024 & 2032
- Figure 15: North America GCC In Vitro Diagnostics Industry Revenue (Million), by Usability 2024 & 2032
- Figure 16: North America GCC In Vitro Diagnostics Industry Volume (K Unit), by Usability 2024 & 2032
- Figure 17: North America GCC In Vitro Diagnostics Industry Revenue Share (%), by Usability 2024 & 2032
- Figure 18: North America GCC In Vitro Diagnostics Industry Volume Share (%), by Usability 2024 & 2032
- Figure 19: North America GCC In Vitro Diagnostics Industry Revenue (Million), by Application 2024 & 2032
- Figure 20: North America GCC In Vitro Diagnostics Industry Volume (K Unit), by Application 2024 & 2032
- Figure 21: North America GCC In Vitro Diagnostics Industry Revenue Share (%), by Application 2024 & 2032
- Figure 22: North America GCC In Vitro Diagnostics Industry Volume Share (%), by Application 2024 & 2032
- Figure 23: North America GCC In Vitro Diagnostics Industry Revenue (Million), by End User 2024 & 2032
- Figure 24: North America GCC In Vitro Diagnostics Industry Volume (K Unit), by End User 2024 & 2032
- Figure 25: North America GCC In Vitro Diagnostics Industry Revenue Share (%), by End User 2024 & 2032
- Figure 26: North America GCC In Vitro Diagnostics Industry Volume Share (%), by End User 2024 & 2032
- Figure 27: North America GCC In Vitro Diagnostics Industry Revenue (Million), by Diagnostic Approach 2024 & 2032
- Figure 28: North America GCC In Vitro Diagnostics Industry Volume (K Unit), by Diagnostic Approach 2024 & 2032
- Figure 29: North America GCC In Vitro Diagnostics Industry Revenue Share (%), by Diagnostic Approach 2024 & 2032
- Figure 30: North America GCC In Vitro Diagnostics Industry Volume Share (%), by Diagnostic Approach 2024 & 2032
- Figure 31: North America GCC In Vitro Diagnostics Industry Revenue (Million), by Country 2024 & 2032
- Figure 32: North America GCC In Vitro Diagnostics Industry Volume (K Unit), by Country 2024 & 2032
- Figure 33: North America GCC In Vitro Diagnostics Industry Revenue Share (%), by Country 2024 & 2032
- Figure 34: North America GCC In Vitro Diagnostics Industry Volume Share (%), by Country 2024 & 2032
- Figure 35: South America GCC In Vitro Diagnostics Industry Revenue (Million), by Technique 2024 & 2032
- Figure 36: South America GCC In Vitro Diagnostics Industry Volume (K Unit), by Technique 2024 & 2032
- Figure 37: South America GCC In Vitro Diagnostics Industry Revenue Share (%), by Technique 2024 & 2032
- Figure 38: South America GCC In Vitro Diagnostics Industry Volume Share (%), by Technique 2024 & 2032
- Figure 39: South America GCC In Vitro Diagnostics Industry Revenue (Million), by Product 2024 & 2032
- Figure 40: South America GCC In Vitro Diagnostics Industry Volume (K Unit), by Product 2024 & 2032
- Figure 41: South America GCC In Vitro Diagnostics Industry Revenue Share (%), by Product 2024 & 2032
- Figure 42: South America GCC In Vitro Diagnostics Industry Volume Share (%), by Product 2024 & 2032
- Figure 43: South America GCC In Vitro Diagnostics Industry Revenue (Million), by Usability 2024 & 2032
- Figure 44: South America GCC In Vitro Diagnostics Industry Volume (K Unit), by Usability 2024 & 2032
- Figure 45: South America GCC In Vitro Diagnostics Industry Revenue Share (%), by Usability 2024 & 2032
- Figure 46: South America GCC In Vitro Diagnostics Industry Volume Share (%), by Usability 2024 & 2032
- Figure 47: South America GCC In Vitro Diagnostics Industry Revenue (Million), by Application 2024 & 2032
- Figure 48: South America GCC In Vitro Diagnostics Industry Volume (K Unit), by Application 2024 & 2032
- Figure 49: South America GCC In Vitro Diagnostics Industry Revenue Share (%), by Application 2024 & 2032
- Figure 50: South America GCC In Vitro Diagnostics Industry Volume Share (%), by Application 2024 & 2032
- Figure 51: South America GCC In Vitro Diagnostics Industry Revenue (Million), by End User 2024 & 2032
- Figure 52: South America GCC In Vitro Diagnostics Industry Volume (K Unit), by End User 2024 & 2032
- Figure 53: South America GCC In Vitro Diagnostics Industry Revenue Share (%), by End User 2024 & 2032
- Figure 54: South America GCC In Vitro Diagnostics Industry Volume Share (%), by End User 2024 & 2032
- Figure 55: South America GCC In Vitro Diagnostics Industry Revenue (Million), by Diagnostic Approach 2024 & 2032
- Figure 56: South America GCC In Vitro Diagnostics Industry Volume (K Unit), by Diagnostic Approach 2024 & 2032
- Figure 57: South America GCC In Vitro Diagnostics Industry Revenue Share (%), by Diagnostic Approach 2024 & 2032
- Figure 58: South America GCC In Vitro Diagnostics Industry Volume Share (%), by Diagnostic Approach 2024 & 2032
- Figure 59: South America GCC In Vitro Diagnostics Industry Revenue (Million), by Country 2024 & 2032
- Figure 60: South America GCC In Vitro Diagnostics Industry Volume (K Unit), by Country 2024 & 2032
- Figure 61: South America GCC In Vitro Diagnostics Industry Revenue Share (%), by Country 2024 & 2032
- Figure 62: South America GCC In Vitro Diagnostics Industry Volume Share (%), by Country 2024 & 2032
- Figure 63: Europe GCC In Vitro Diagnostics Industry Revenue (Million), by Technique 2024 & 2032
- Figure 64: Europe GCC In Vitro Diagnostics Industry Volume (K Unit), by Technique 2024 & 2032
- Figure 65: Europe GCC In Vitro Diagnostics Industry Revenue Share (%), by Technique 2024 & 2032
- Figure 66: Europe GCC In Vitro Diagnostics Industry Volume Share (%), by Technique 2024 & 2032
- Figure 67: Europe GCC In Vitro Diagnostics Industry Revenue (Million), by Product 2024 & 2032
- Figure 68: Europe GCC In Vitro Diagnostics Industry Volume (K Unit), by Product 2024 & 2032
- Figure 69: Europe GCC In Vitro Diagnostics Industry Revenue Share (%), by Product 2024 & 2032
- Figure 70: Europe GCC In Vitro Diagnostics Industry Volume Share (%), by Product 2024 & 2032
- Figure 71: Europe GCC In Vitro Diagnostics Industry Revenue (Million), by Usability 2024 & 2032
- Figure 72: Europe GCC In Vitro Diagnostics Industry Volume (K Unit), by Usability 2024 & 2032
- Figure 73: Europe GCC In Vitro Diagnostics Industry Revenue Share (%), by Usability 2024 & 2032
- Figure 74: Europe GCC In Vitro Diagnostics Industry Volume Share (%), by Usability 2024 & 2032
- Figure 75: Europe GCC In Vitro Diagnostics Industry Revenue (Million), by Application 2024 & 2032
- Figure 76: Europe GCC In Vitro Diagnostics Industry Volume (K Unit), by Application 2024 & 2032
- Figure 77: Europe GCC In Vitro Diagnostics Industry Revenue Share (%), by Application 2024 & 2032
- Figure 78: Europe GCC In Vitro Diagnostics Industry Volume Share (%), by Application 2024 & 2032
- Figure 79: Europe GCC In Vitro Diagnostics Industry Revenue (Million), by End User 2024 & 2032
- Figure 80: Europe GCC In Vitro Diagnostics Industry Volume (K Unit), by End User 2024 & 2032
- Figure 81: Europe GCC In Vitro Diagnostics Industry Revenue Share (%), by End User 2024 & 2032
- Figure 82: Europe GCC In Vitro Diagnostics Industry Volume Share (%), by End User 2024 & 2032
- Figure 83: Europe GCC In Vitro Diagnostics Industry Revenue (Million), by Diagnostic Approach 2024 & 2032
- Figure 84: Europe GCC In Vitro Diagnostics Industry Volume (K Unit), by Diagnostic Approach 2024 & 2032
- Figure 85: Europe GCC In Vitro Diagnostics Industry Revenue Share (%), by Diagnostic Approach 2024 & 2032
- Figure 86: Europe GCC In Vitro Diagnostics Industry Volume Share (%), by Diagnostic Approach 2024 & 2032
- Figure 87: Europe GCC In Vitro Diagnostics Industry Revenue (Million), by Country 2024 & 2032
- Figure 88: Europe GCC In Vitro Diagnostics Industry Volume (K Unit), by Country 2024 & 2032
- Figure 89: Europe GCC In Vitro Diagnostics Industry Revenue Share (%), by Country 2024 & 2032
- Figure 90: Europe GCC In Vitro Diagnostics Industry Volume Share (%), by Country 2024 & 2032
- Figure 91: Middle East & Africa GCC In Vitro Diagnostics Industry Revenue (Million), by Technique 2024 & 2032
- Figure 92: Middle East & Africa GCC In Vitro Diagnostics Industry Volume (K Unit), by Technique 2024 & 2032
- Figure 93: Middle East & Africa GCC In Vitro Diagnostics Industry Revenue Share (%), by Technique 2024 & 2032
- Figure 94: Middle East & Africa GCC In Vitro Diagnostics Industry Volume Share (%), by Technique 2024 & 2032
- Figure 95: Middle East & Africa GCC In Vitro Diagnostics Industry Revenue (Million), by Product 2024 & 2032
- Figure 96: Middle East & Africa GCC In Vitro Diagnostics Industry Volume (K Unit), by Product 2024 & 2032
- Figure 97: Middle East & Africa GCC In Vitro Diagnostics Industry Revenue Share (%), by Product 2024 & 2032
- Figure 98: Middle East & Africa GCC In Vitro Diagnostics Industry Volume Share (%), by Product 2024 & 2032
- Figure 99: Middle East & Africa GCC In Vitro Diagnostics Industry Revenue (Million), by Usability 2024 & 2032
- Figure 100: Middle East & Africa GCC In Vitro Diagnostics Industry Volume (K Unit), by Usability 2024 & 2032
- Figure 101: Middle East & Africa GCC In Vitro Diagnostics Industry Revenue Share (%), by Usability 2024 & 2032
- Figure 102: Middle East & Africa GCC In Vitro Diagnostics Industry Volume Share (%), by Usability 2024 & 2032
- Figure 103: Middle East & Africa GCC In Vitro Diagnostics Industry Revenue (Million), by Application 2024 & 2032
- Figure 104: Middle East & Africa GCC In Vitro Diagnostics Industry Volume (K Unit), by Application 2024 & 2032
- Figure 105: Middle East & Africa GCC In Vitro Diagnostics Industry Revenue Share (%), by Application 2024 & 2032
- Figure 106: Middle East & Africa GCC In Vitro Diagnostics Industry Volume Share (%), by Application 2024 & 2032
- Figure 107: Middle East & Africa GCC In Vitro Diagnostics Industry Revenue (Million), by End User 2024 & 2032
- Figure 108: Middle East & Africa GCC In Vitro Diagnostics Industry Volume (K Unit), by End User 2024 & 2032
- Figure 109: Middle East & Africa GCC In Vitro Diagnostics Industry Revenue Share (%), by End User 2024 & 2032
- Figure 110: Middle East & Africa GCC In Vitro Diagnostics Industry Volume Share (%), by End User 2024 & 2032
- Figure 111: Middle East & Africa GCC In Vitro Diagnostics Industry Revenue (Million), by Diagnostic Approach 2024 & 2032
- Figure 112: Middle East & Africa GCC In Vitro Diagnostics Industry Volume (K Unit), by Diagnostic Approach 2024 & 2032
- Figure 113: Middle East & Africa GCC In Vitro Diagnostics Industry Revenue Share (%), by Diagnostic Approach 2024 & 2032
- Figure 114: Middle East & Africa GCC In Vitro Diagnostics Industry Volume Share (%), by Diagnostic Approach 2024 & 2032
- Figure 115: Middle East & Africa GCC In Vitro Diagnostics Industry Revenue (Million), by Country 2024 & 2032
- Figure 116: Middle East & Africa GCC In Vitro Diagnostics Industry Volume (K Unit), by Country 2024 & 2032
- Figure 117: Middle East & Africa GCC In Vitro Diagnostics Industry Revenue Share (%), by Country 2024 & 2032
- Figure 118: Middle East & Africa GCC In Vitro Diagnostics Industry Volume Share (%), by Country 2024 & 2032
- Figure 119: Asia Pacific GCC In Vitro Diagnostics Industry Revenue (Million), by Technique 2024 & 2032
- Figure 120: Asia Pacific GCC In Vitro Diagnostics Industry Volume (K Unit), by Technique 2024 & 2032
- Figure 121: Asia Pacific GCC In Vitro Diagnostics Industry Revenue Share (%), by Technique 2024 & 2032
- Figure 122: Asia Pacific GCC In Vitro Diagnostics Industry Volume Share (%), by Technique 2024 & 2032
- Figure 123: Asia Pacific GCC In Vitro Diagnostics Industry Revenue (Million), by Product 2024 & 2032
- Figure 124: Asia Pacific GCC In Vitro Diagnostics Industry Volume (K Unit), by Product 2024 & 2032
- Figure 125: Asia Pacific GCC In Vitro Diagnostics Industry Revenue Share (%), by Product 2024 & 2032
- Figure 126: Asia Pacific GCC In Vitro Diagnostics Industry Volume Share (%), by Product 2024 & 2032
- Figure 127: Asia Pacific GCC In Vitro Diagnostics Industry Revenue (Million), by Usability 2024 & 2032
- Figure 128: Asia Pacific GCC In Vitro Diagnostics Industry Volume (K Unit), by Usability 2024 & 2032
- Figure 129: Asia Pacific GCC In Vitro Diagnostics Industry Revenue Share (%), by Usability 2024 & 2032
- Figure 130: Asia Pacific GCC In Vitro Diagnostics Industry Volume Share (%), by Usability 2024 & 2032
- Figure 131: Asia Pacific GCC In Vitro Diagnostics Industry Revenue (Million), by Application 2024 & 2032
- Figure 132: Asia Pacific GCC In Vitro Diagnostics Industry Volume (K Unit), by Application 2024 & 2032
- Figure 133: Asia Pacific GCC In Vitro Diagnostics Industry Revenue Share (%), by Application 2024 & 2032
- Figure 134: Asia Pacific GCC In Vitro Diagnostics Industry Volume Share (%), by Application 2024 & 2032
- Figure 135: Asia Pacific GCC In Vitro Diagnostics Industry Revenue (Million), by End User 2024 & 2032
- Figure 136: Asia Pacific GCC In Vitro Diagnostics Industry Volume (K Unit), by End User 2024 & 2032
- Figure 137: Asia Pacific GCC In Vitro Diagnostics Industry Revenue Share (%), by End User 2024 & 2032
- Figure 138: Asia Pacific GCC In Vitro Diagnostics Industry Volume Share (%), by End User 2024 & 2032
- Figure 139: Asia Pacific GCC In Vitro Diagnostics Industry Revenue (Million), by Diagnostic Approach 2024 & 2032
- Figure 140: Asia Pacific GCC In Vitro Diagnostics Industry Volume (K Unit), by Diagnostic Approach 2024 & 2032
- Figure 141: Asia Pacific GCC In Vitro Diagnostics Industry Revenue Share (%), by Diagnostic Approach 2024 & 2032
- Figure 142: Asia Pacific GCC In Vitro Diagnostics Industry Volume Share (%), by Diagnostic Approach 2024 & 2032
- Figure 143: Asia Pacific GCC In Vitro Diagnostics Industry Revenue (Million), by Country 2024 & 2032
- Figure 144: Asia Pacific GCC In Vitro Diagnostics Industry Volume (K Unit), by Country 2024 & 2032
- Figure 145: Asia Pacific GCC In Vitro Diagnostics Industry Revenue Share (%), by Country 2024 & 2032
- Figure 146: Asia Pacific GCC In Vitro Diagnostics Industry Volume Share (%), by Country 2024 & 2032
List of Tables
- Table 1: Global GCC In Vitro Diagnostics Industry Revenue Million Forecast, by Region 2019 & 2032
- Table 2: Global GCC In Vitro Diagnostics Industry Volume K Unit Forecast, by Region 2019 & 2032
- Table 3: Global GCC In Vitro Diagnostics Industry Revenue Million Forecast, by Technique 2019 & 2032
- Table 4: Global GCC In Vitro Diagnostics Industry Volume K Unit Forecast, by Technique 2019 & 2032
- Table 5: Global GCC In Vitro Diagnostics Industry Revenue Million Forecast, by Product 2019 & 2032
- Table 6: Global GCC In Vitro Diagnostics Industry Volume K Unit Forecast, by Product 2019 & 2032
- Table 7: Global GCC In Vitro Diagnostics Industry Revenue Million Forecast, by Usability 2019 & 2032
- Table 8: Global GCC In Vitro Diagnostics Industry Volume K Unit Forecast, by Usability 2019 & 2032
- Table 9: Global GCC In Vitro Diagnostics Industry Revenue Million Forecast, by Application 2019 & 2032
- Table 10: Global GCC In Vitro Diagnostics Industry Volume K Unit Forecast, by Application 2019 & 2032
- Table 11: Global GCC In Vitro Diagnostics Industry Revenue Million Forecast, by End User 2019 & 2032
- Table 12: Global GCC In Vitro Diagnostics Industry Volume K Unit Forecast, by End User 2019 & 2032
- Table 13: Global GCC In Vitro Diagnostics Industry Revenue Million Forecast, by Diagnostic Approach 2019 & 2032
- Table 14: Global GCC In Vitro Diagnostics Industry Volume K Unit Forecast, by Diagnostic Approach 2019 & 2032
- Table 15: Global GCC In Vitro Diagnostics Industry Revenue Million Forecast, by Region 2019 & 2032
- Table 16: Global GCC In Vitro Diagnostics Industry Volume K Unit Forecast, by Region 2019 & 2032
- Table 17: Global GCC In Vitro Diagnostics Industry Revenue Million Forecast, by Country 2019 & 2032
- Table 18: Global GCC In Vitro Diagnostics Industry Volume K Unit Forecast, by Country 2019 & 2032
- Table 19: Global GCC In Vitro Diagnostics Industry Revenue Million Forecast, by Technique 2019 & 2032
- Table 20: Global GCC In Vitro Diagnostics Industry Volume K Unit Forecast, by Technique 2019 & 2032
- Table 21: Global GCC In Vitro Diagnostics Industry Revenue Million Forecast, by Product 2019 & 2032
- Table 22: Global GCC In Vitro Diagnostics Industry Volume K Unit Forecast, by Product 2019 & 2032
- Table 23: Global GCC In Vitro Diagnostics Industry Revenue Million Forecast, by Usability 2019 & 2032
- Table 24: Global GCC In Vitro Diagnostics Industry Volume K Unit Forecast, by Usability 2019 & 2032
- Table 25: Global GCC In Vitro Diagnostics Industry Revenue Million Forecast, by Application 2019 & 2032
- Table 26: Global GCC In Vitro Diagnostics Industry Volume K Unit Forecast, by Application 2019 & 2032
- Table 27: Global GCC In Vitro Diagnostics Industry Revenue Million Forecast, by End User 2019 & 2032
- Table 28: Global GCC In Vitro Diagnostics Industry Volume K Unit Forecast, by End User 2019 & 2032
- Table 29: Global GCC In Vitro Diagnostics Industry Revenue Million Forecast, by Diagnostic Approach 2019 & 2032
- Table 30: Global GCC In Vitro Diagnostics Industry Volume K Unit Forecast, by Diagnostic Approach 2019 & 2032
- Table 31: Global GCC In Vitro Diagnostics Industry Revenue Million Forecast, by Country 2019 & 2032
- Table 32: Global GCC In Vitro Diagnostics Industry Volume K Unit Forecast, by Country 2019 & 2032
- Table 33: United States GCC In Vitro Diagnostics Industry Revenue (Million) Forecast, by Application 2019 & 2032
- Table 34: United States GCC In Vitro Diagnostics Industry Volume (K Unit) Forecast, by Application 2019 & 2032
- Table 35: Canada GCC In Vitro Diagnostics Industry Revenue (Million) Forecast, by Application 2019 & 2032
- Table 36: Canada GCC In Vitro Diagnostics Industry Volume (K Unit) Forecast, by Application 2019 & 2032
- Table 37: Mexico GCC In Vitro Diagnostics Industry Revenue (Million) Forecast, by Application 2019 & 2032
- Table 38: Mexico GCC In Vitro Diagnostics Industry Volume (K Unit) Forecast, by Application 2019 & 2032
- Table 39: Global GCC In Vitro Diagnostics Industry Revenue Million Forecast, by Technique 2019 & 2032
- Table 40: Global GCC In Vitro Diagnostics Industry Volume K Unit Forecast, by Technique 2019 & 2032
- Table 41: Global GCC In Vitro Diagnostics Industry Revenue Million Forecast, by Product 2019 & 2032
- Table 42: Global GCC In Vitro Diagnostics Industry Volume K Unit Forecast, by Product 2019 & 2032
- Table 43: Global GCC In Vitro Diagnostics Industry Revenue Million Forecast, by Usability 2019 & 2032
- Table 44: Global GCC In Vitro Diagnostics Industry Volume K Unit Forecast, by Usability 2019 & 2032
- Table 45: Global GCC In Vitro Diagnostics Industry Revenue Million Forecast, by Application 2019 & 2032
- Table 46: Global GCC In Vitro Diagnostics Industry Volume K Unit Forecast, by Application 2019 & 2032
- Table 47: Global GCC In Vitro Diagnostics Industry Revenue Million Forecast, by End User 2019 & 2032
- Table 48: Global GCC In Vitro Diagnostics Industry Volume K Unit Forecast, by End User 2019 & 2032
- Table 49: Global GCC In Vitro Diagnostics Industry Revenue Million Forecast, by Diagnostic Approach 2019 & 2032
- Table 50: Global GCC In Vitro Diagnostics Industry Volume K Unit Forecast, by Diagnostic Approach 2019 & 2032
- Table 51: Global GCC In Vitro Diagnostics Industry Revenue Million Forecast, by Country 2019 & 2032
- Table 52: Global GCC In Vitro Diagnostics Industry Volume K Unit Forecast, by Country 2019 & 2032
- Table 53: Brazil GCC In Vitro Diagnostics Industry Revenue (Million) Forecast, by Application 2019 & 2032
- Table 54: Brazil GCC In Vitro Diagnostics Industry Volume (K Unit) Forecast, by Application 2019 & 2032
- Table 55: Argentina GCC In Vitro Diagnostics Industry Revenue (Million) Forecast, by Application 2019 & 2032
- Table 56: Argentina GCC In Vitro Diagnostics Industry Volume (K Unit) Forecast, by Application 2019 & 2032
- Table 57: Rest of South America GCC In Vitro Diagnostics Industry Revenue (Million) Forecast, by Application 2019 & 2032
- Table 58: Rest of South America GCC In Vitro Diagnostics Industry Volume (K Unit) Forecast, by Application 2019 & 2032
- Table 59: Global GCC In Vitro Diagnostics Industry Revenue Million Forecast, by Technique 2019 & 2032
- Table 60: Global GCC In Vitro Diagnostics Industry Volume K Unit Forecast, by Technique 2019 & 2032
- Table 61: Global GCC In Vitro Diagnostics Industry Revenue Million Forecast, by Product 2019 & 2032
- Table 62: Global GCC In Vitro Diagnostics Industry Volume K Unit Forecast, by Product 2019 & 2032
- Table 63: Global GCC In Vitro Diagnostics Industry Revenue Million Forecast, by Usability 2019 & 2032
- Table 64: Global GCC In Vitro Diagnostics Industry Volume K Unit Forecast, by Usability 2019 & 2032
- Table 65: Global GCC In Vitro Diagnostics Industry Revenue Million Forecast, by Application 2019 & 2032
- Table 66: Global GCC In Vitro Diagnostics Industry Volume K Unit Forecast, by Application 2019 & 2032
- Table 67: Global GCC In Vitro Diagnostics Industry Revenue Million Forecast, by End User 2019 & 2032
- Table 68: Global GCC In Vitro Diagnostics Industry Volume K Unit Forecast, by End User 2019 & 2032
- Table 69: Global GCC In Vitro Diagnostics Industry Revenue Million Forecast, by Diagnostic Approach 2019 & 2032
- Table 70: Global GCC In Vitro Diagnostics Industry Volume K Unit Forecast, by Diagnostic Approach 2019 & 2032
- Table 71: Global GCC In Vitro Diagnostics Industry Revenue Million Forecast, by Country 2019 & 2032
- Table 72: Global GCC In Vitro Diagnostics Industry Volume K Unit Forecast, by Country 2019 & 2032
- Table 73: United Kingdom GCC In Vitro Diagnostics Industry Revenue (Million) Forecast, by Application 2019 & 2032
- Table 74: United Kingdom GCC In Vitro Diagnostics Industry Volume (K Unit) Forecast, by Application 2019 & 2032
- Table 75: Germany GCC In Vitro Diagnostics Industry Revenue (Million) Forecast, by Application 2019 & 2032
- Table 76: Germany GCC In Vitro Diagnostics Industry Volume (K Unit) Forecast, by Application 2019 & 2032
- Table 77: France GCC In Vitro Diagnostics Industry Revenue (Million) Forecast, by Application 2019 & 2032
- Table 78: France GCC In Vitro Diagnostics Industry Volume (K Unit) Forecast, by Application 2019 & 2032
- Table 79: Italy GCC In Vitro Diagnostics Industry Revenue (Million) Forecast, by Application 2019 & 2032
- Table 80: Italy GCC In Vitro Diagnostics Industry Volume (K Unit) Forecast, by Application 2019 & 2032
- Table 81: Spain GCC In Vitro Diagnostics Industry Revenue (Million) Forecast, by Application 2019 & 2032
- Table 82: Spain GCC In Vitro Diagnostics Industry Volume (K Unit) Forecast, by Application 2019 & 2032
- Table 83: Russia GCC In Vitro Diagnostics Industry Revenue (Million) Forecast, by Application 2019 & 2032
- Table 84: Russia GCC In Vitro Diagnostics Industry Volume (K Unit) Forecast, by Application 2019 & 2032
- Table 85: Benelux GCC In Vitro Diagnostics Industry Revenue (Million) Forecast, by Application 2019 & 2032
- Table 86: Benelux GCC In Vitro Diagnostics Industry Volume (K Unit) Forecast, by Application 2019 & 2032
- Table 87: Nordics GCC In Vitro Diagnostics Industry Revenue (Million) Forecast, by Application 2019 & 2032
- Table 88: Nordics GCC In Vitro Diagnostics Industry Volume (K Unit) Forecast, by Application 2019 & 2032
- Table 89: Rest of Europe GCC In Vitro Diagnostics Industry Revenue (Million) Forecast, by Application 2019 & 2032
- Table 90: Rest of Europe GCC In Vitro Diagnostics Industry Volume (K Unit) Forecast, by Application 2019 & 2032
- Table 91: Global GCC In Vitro Diagnostics Industry Revenue Million Forecast, by Technique 2019 & 2032
- Table 92: Global GCC In Vitro Diagnostics Industry Volume K Unit Forecast, by Technique 2019 & 2032
- Table 93: Global GCC In Vitro Diagnostics Industry Revenue Million Forecast, by Product 2019 & 2032
- Table 94: Global GCC In Vitro Diagnostics Industry Volume K Unit Forecast, by Product 2019 & 2032
- Table 95: Global GCC In Vitro Diagnostics Industry Revenue Million Forecast, by Usability 2019 & 2032
- Table 96: Global GCC In Vitro Diagnostics Industry Volume K Unit Forecast, by Usability 2019 & 2032
- Table 97: Global GCC In Vitro Diagnostics Industry Revenue Million Forecast, by Application 2019 & 2032
- Table 98: Global GCC In Vitro Diagnostics Industry Volume K Unit Forecast, by Application 2019 & 2032
- Table 99: Global GCC In Vitro Diagnostics Industry Revenue Million Forecast, by End User 2019 & 2032
- Table 100: Global GCC In Vitro Diagnostics Industry Volume K Unit Forecast, by End User 2019 & 2032
- Table 101: Global GCC In Vitro Diagnostics Industry Revenue Million Forecast, by Diagnostic Approach 2019 & 2032
- Table 102: Global GCC In Vitro Diagnostics Industry Volume K Unit Forecast, by Diagnostic Approach 2019 & 2032
- Table 103: Global GCC In Vitro Diagnostics Industry Revenue Million Forecast, by Country 2019 & 2032
- Table 104: Global GCC In Vitro Diagnostics Industry Volume K Unit Forecast, by Country 2019 & 2032
- Table 105: Turkey GCC In Vitro Diagnostics Industry Revenue (Million) Forecast, by Application 2019 & 2032
- Table 106: Turkey GCC In Vitro Diagnostics Industry Volume (K Unit) Forecast, by Application 2019 & 2032
- Table 107: Israel GCC In Vitro Diagnostics Industry Revenue (Million) Forecast, by Application 2019 & 2032
- Table 108: Israel GCC In Vitro Diagnostics Industry Volume (K Unit) Forecast, by Application 2019 & 2032
- Table 109: GCC GCC In Vitro Diagnostics Industry Revenue (Million) Forecast, by Application 2019 & 2032
- Table 110: GCC GCC In Vitro Diagnostics Industry Volume (K Unit) Forecast, by Application 2019 & 2032
- Table 111: North Africa GCC In Vitro Diagnostics Industry Revenue (Million) Forecast, by Application 2019 & 2032
- Table 112: North Africa GCC In Vitro Diagnostics Industry Volume (K Unit) Forecast, by Application 2019 & 2032
- Table 113: South Africa GCC In Vitro Diagnostics Industry Revenue (Million) Forecast, by Application 2019 & 2032
- Table 114: South Africa GCC In Vitro Diagnostics Industry Volume (K Unit) Forecast, by Application 2019 & 2032
- Table 115: Rest of Middle East & Africa GCC In Vitro Diagnostics Industry Revenue (Million) Forecast, by Application 2019 & 2032
- Table 116: Rest of Middle East & Africa GCC In Vitro Diagnostics Industry Volume (K Unit) Forecast, by Application 2019 & 2032
- Table 117: Global GCC In Vitro Diagnostics Industry Revenue Million Forecast, by Technique 2019 & 2032
- Table 118: Global GCC In Vitro Diagnostics Industry Volume K Unit Forecast, by Technique 2019 & 2032
- Table 119: Global GCC In Vitro Diagnostics Industry Revenue Million Forecast, by Product 2019 & 2032
- Table 120: Global GCC In Vitro Diagnostics Industry Volume K Unit Forecast, by Product 2019 & 2032
- Table 121: Global GCC In Vitro Diagnostics Industry Revenue Million Forecast, by Usability 2019 & 2032
- Table 122: Global GCC In Vitro Diagnostics Industry Volume K Unit Forecast, by Usability 2019 & 2032
- Table 123: Global GCC In Vitro Diagnostics Industry Revenue Million Forecast, by Application 2019 & 2032
- Table 124: Global GCC In Vitro Diagnostics Industry Volume K Unit Forecast, by Application 2019 & 2032
- Table 125: Global GCC In Vitro Diagnostics Industry Revenue Million Forecast, by End User 2019 & 2032
- Table 126: Global GCC In Vitro Diagnostics Industry Volume K Unit Forecast, by End User 2019 & 2032
- Table 127: Global GCC In Vitro Diagnostics Industry Revenue Million Forecast, by Diagnostic Approach 2019 & 2032
- Table 128: Global GCC In Vitro Diagnostics Industry Volume K Unit Forecast, by Diagnostic Approach 2019 & 2032
- Table 129: Global GCC In Vitro Diagnostics Industry Revenue Million Forecast, by Country 2019 & 2032
- Table 130: Global GCC In Vitro Diagnostics Industry Volume K Unit Forecast, by Country 2019 & 2032
- Table 131: China GCC In Vitro Diagnostics Industry Revenue (Million) Forecast, by Application 2019 & 2032
- Table 132: China GCC In Vitro Diagnostics Industry Volume (K Unit) Forecast, by Application 2019 & 2032
- Table 133: India GCC In Vitro Diagnostics Industry Revenue (Million) Forecast, by Application 2019 & 2032
- Table 134: India GCC In Vitro Diagnostics Industry Volume (K Unit) Forecast, by Application 2019 & 2032
- Table 135: Japan GCC In Vitro Diagnostics Industry Revenue (Million) Forecast, by Application 2019 & 2032
- Table 136: Japan GCC In Vitro Diagnostics Industry Volume (K Unit) Forecast, by Application 2019 & 2032
- Table 137: South Korea GCC In Vitro Diagnostics Industry Revenue (Million) Forecast, by Application 2019 & 2032
- Table 138: South Korea GCC In Vitro Diagnostics Industry Volume (K Unit) Forecast, by Application 2019 & 2032
- Table 139: ASEAN GCC In Vitro Diagnostics Industry Revenue (Million) Forecast, by Application 2019 & 2032
- Table 140: ASEAN GCC In Vitro Diagnostics Industry Volume (K Unit) Forecast, by Application 2019 & 2032
- Table 141: Oceania GCC In Vitro Diagnostics Industry Revenue (Million) Forecast, by Application 2019 & 2032
- Table 142: Oceania GCC In Vitro Diagnostics Industry Volume (K Unit) Forecast, by Application 2019 & 2032
- Table 143: Rest of Asia Pacific GCC In Vitro Diagnostics Industry Revenue (Million) Forecast, by Application 2019 & 2032
- Table 144: Rest of Asia Pacific GCC In Vitro Diagnostics Industry Volume (K Unit) Forecast, by Application 2019 & 2032
Frequently Asked Questions
1. What is the projected Compound Annual Growth Rate (CAGR) of the GCC In Vitro Diagnostics Industry?
The projected CAGR is approximately 5.10%.
2. Which companies are prominent players in the GCC In Vitro Diagnostics Industry?
Key companies in the market include Becton Dickinson and Company, BioMerieux SA, Grifols SA, Abbott Laboratories, Siemens Healthineers (Siemens Healthcare GmbH), Danaher Corporation, F Hoffmann-La Roche AG, DiaSorin, Thermo Fischer Scientific Inc, Qiagen NV, Sysmex Corporation, Bio-Rad Laboratories.
3. What are the main segments of the GCC In Vitro Diagnostics Industry?
The market segments include Technique, Product, Usability, Application, End User, Diagnostic Approach.
4. Can you provide details about the market size?
The market size is estimated to be USD 2.07 Million as of 2022.
5. What are some drivers contributing to market growth?
Growing Burden of Chronic Diseases and Infectious Diseases; Increasing Healthcare Expenditure.
6. What are the notable trends driving market growth?
Point-of-care diagnostics Segment is Expected to Witness Growth Over The Forecast Period..
7. Are there any restraints impacting market growth?
Stringent Regulations.
8. Can you provide examples of recent developments in the market?
July 2022: Saudi Arabia's Arabian International Healthcare Holding Company, TIBBIYAH, commenced a new Joint Venture (JV) with Swiss company Unilabs Diagnostics AB.
9. What pricing options are available for accessing the report?
Pricing options include single-user, multi-user, and enterprise licenses priced at USD 3800, USD 4500, and USD 5800 respectively.
10. Is the market size provided in terms of value or volume?
The market size is provided in terms of value, measured in Million and volume, measured in K Unit.
11. Are there any specific market keywords associated with the report?
Yes, the market keyword associated with the report is "GCC In Vitro Diagnostics Industry," which aids in identifying and referencing the specific market segment covered.
12. How do I determine which pricing option suits my needs best?
The pricing options vary based on user requirements and access needs. Individual users may opt for single-user licenses, while businesses requiring broader access may choose multi-user or enterprise licenses for cost-effective access to the report.
13. Are there any additional resources or data provided in the GCC In Vitro Diagnostics Industry report?
While the report offers comprehensive insights, it's advisable to review the specific contents or supplementary materials provided to ascertain if additional resources or data are available.
14. How can I stay updated on further developments or reports in the GCC In Vitro Diagnostics Industry?
To stay informed about further developments, trends, and reports in the GCC In Vitro Diagnostics Industry, consider subscribing to industry newsletters, following relevant companies and organizations, or regularly checking reputable industry news sources and publications.
Methodology
Step 1 - Identification of Relevant Samples Size from Population Database


Step 2 - Approaches for Defining Global Market Size (Value, Volume* & Price*)

Note*: In applicable scenarios
Step 3 - Data Sources
Primary Research
- Web Analytics
- Survey Reports
- Research Institute
- Latest Research Reports
- Opinion Leaders
Secondary Research
- Annual Reports
- White Paper
- Latest Press Release
- Industry Association
- Paid Database
- Investor Presentations

Step 4 - Data Triangulation
Involves using different sources of information in order to increase the validity of a study
These sources are likely to be stakeholders in a program - participants, other researchers, program staff, other community members, and so on.
Then we put all data in single framework & apply various statistical tools to find out the dynamic on the market.
During the analysis stage, feedback from the stakeholder groups would be compared to determine areas of agreement as well as areas of divergence
