

Key Insights
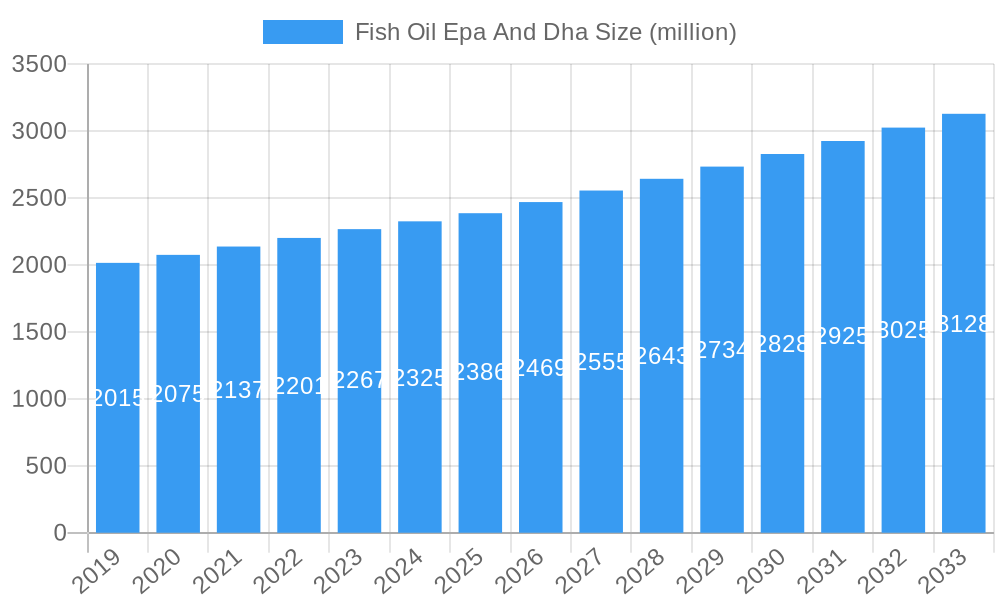
The global Fish Oil EPA and DHA market is poised for robust expansion, projected to reach a substantial market size of $2,386 million by 2025. Driven by a projected Compound Annual Growth Rate (CAGR) of 3.5% from 2019 to 2033, this industry signifies a sustained upward trajectory in demand. Key market drivers include the escalating consumer awareness regarding the health benefits of omega-3 fatty acids, particularly EPA (eicosapentaenoic acid) and DHA (docosahexaenoic acid). These benefits encompass cardiovascular health, cognitive function, and anti-inflammatory properties, leading to increased incorporation into dietary supplements, a segment anticipated to witness significant growth. Furthermore, the rising demand for fortified foods and beverages, as well as infant formula, reflects a growing trend towards functional nutrition and preventative healthcare. The pharmaceutical sector also presents a vital application, leveraging the therapeutic properties of fish oil for various medical conditions. The market's expansion is further supported by advancements in extraction and purification technologies, ensuring higher quality and purity of fish oil products.
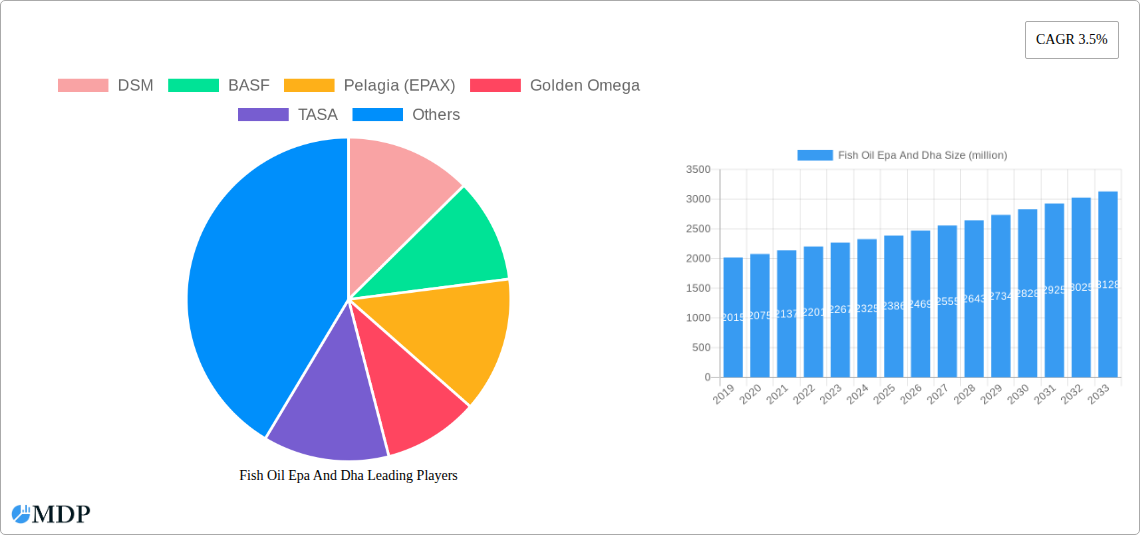
Fish Oil Epa And Dha Market Size (In Billion)
The market's growth is not without its challenges. While the overall outlook is positive, factors such as fluctuating raw material prices, sustainability concerns related to fish sourcing, and stringent regulatory landscapes in certain regions can act as restraints. However, innovative approaches to sustainable sourcing, such as aquaculture and algae-based omega-3 production, are emerging to mitigate these concerns. Geographically, the Asia Pacific region, particularly China and India, is expected to emerge as a significant growth engine due to a burgeoning middle class with increasing disposable incomes and a growing health consciousness. North America and Europe are established markets, driven by high consumer awareness and a mature supplement industry. Companies like DSM, BASF, Pelagia (EPAX), and TASA are at the forefront, investing in research and development to meet the evolving demands for high-purity EPA and DHA products across diverse applications. The market's segmentation by type, with distinct demand for both Fish Oil EPA and Fish Oil DHA, highlights specialized needs within the nutraceutical and pharmaceutical industries.
Fish Oil Epa And Dha Company Market Share
Fish Oil EPA and DHA Market: Growth, Trends, and Future Outlook (2019-2033)
This comprehensive report offers an in-depth analysis of the global Fish Oil EPA and DHA market, projecting its trajectory from 2019 to 2033. With a base year of 2025 and a forecast period extending to 2033, this study provides crucial insights into market dynamics, key trends, leading segments, and the competitive landscape. Industry stakeholders, including manufacturers, suppliers, investors, and researchers, will find actionable intelligence to navigate this evolving sector, driven by increasing health awareness and demand for omega-3 fatty acids. The report covers the market size in million USD, industry developments, and strategic opportunities, offering a 360-degree view of the global Fish Oil EPA and DHA market.
Fish Oil Epa And Dha Market Dynamics & Concentration
The global Fish Oil EPA and DHA market exhibits a moderate level of concentration, with several key players vying for market share. Innovation drivers are primarily focused on improving extraction technologies for higher purity EPA and DHA, developing novel delivery formats, and enhancing sustainability in sourcing. Regulatory frameworks, particularly concerning product labeling, health claims, and environmental impact, play a significant role in shaping market entry and product development. While direct substitutes are limited for the unique nutritional benefits of fish oil, alternative omega-3 sources like algal oil are gaining traction, presenting a competitive challenge. End-user trends indicate a growing preference for naturally sourced and sustainably harvested ingredients, especially within the dietary supplements and infant formula segments. Mergers and acquisitions (M&A) activities are observed, driven by the need for vertical integration, expanded product portfolios, and enhanced market reach. Historical M&A deal counts are estimated to be in the range of 50-100 significant transactions over the study period. Key market share holders are expected to maintain a strong presence, with innovative players capable of capturing incremental growth.
Fish Oil Epa And Dha Industry Trends & Analysis
The Fish Oil EPA and DHA market is experiencing robust growth, fueled by escalating consumer awareness regarding the health benefits of omega-3 fatty acids. These benefits, encompassing cardiovascular health, cognitive function, and anti-inflammatory properties, are increasingly being recognized and promoted by health organizations and medical professionals worldwide. This heightened awareness directly translates into increased demand across various application segments, most notably dietary supplements, where consumers actively seek to augment their daily nutrient intake. The market penetration of fish oil products, particularly in developed economies, continues to rise steadily.
Technological disruptions are playing a pivotal role in shaping the industry. Advances in extraction and purification techniques have enabled the production of high-purity EPA and DHA concentrates, catering to the demand for more potent and targeted health solutions. Furthermore, innovative delivery systems, such as microencapsulation and chewable formats, are enhancing consumer compliance and product appeal. The CAGR for the Fish Oil EPA and DHA market is projected to be approximately 6-8% over the forecast period, indicating a strong and sustained growth trajectory.
Consumer preferences are evolving towards more sustainable and traceable sourcing of fish oil. Concerns about overfishing and the environmental impact of traditional fishing practices are driving demand for certified sustainable seafood and eco-friendly production methods. This trend is pushing manufacturers to adopt responsible sourcing strategies and invest in transparent supply chains. The competitive dynamics are characterized by both established global players and emerging regional manufacturers, all striving to differentiate through product quality, innovation, and sustainability. The overall market size is expected to reach over $15,000 million by 2033, a substantial increase from historical figures.
Leading Markets & Segments in Fish Oil Epa And Dha
The Dietary Supplements segment is the dominant force within the global Fish Oil EPA and DHA market. This dominance is driven by a confluence of factors, including the widespread consumer understanding of omega-3s' health benefits, the accessibility of these products, and the increasing trend towards preventative healthcare and wellness. Countries with higher disposable incomes and well-developed healthcare infrastructures, such as the United States, Canada, and various European nations, represent the leading geographic markets.
- Key Drivers for Dietary Supplements Dominance:
- Health Awareness: Pervasive public knowledge and promotion of benefits for heart health, brain function, and inflammation.
- Aging Population: Increased demand from older demographics seeking to maintain cognitive function and reduce the risk of age-related diseases.
- Lifestyle Diseases: Growing concern over cardiovascular issues, obesity, and metabolic disorders, prompting individuals to seek nutritional support.
- Online Retail Growth: The expansion of e-commerce platforms has made dietary supplements more accessible to a wider consumer base globally.
Within the Type segmentation, Fish Oil DHA holds a significant share, primarily due to its critical role in brain development and cognitive function, leading to strong demand in infant formula and cognitive health supplements. However, Fish Oil EPA is experiencing rapid growth, propelled by its established benefits for cardiovascular health and mood regulation, making it a key ingredient in heart health and mood support supplements.
The Fortified Foods and Beverages segment is also witnessing substantial growth, as manufacturers increasingly incorporate omega-3s into everyday food products to enhance their nutritional profile and appeal to health-conscious consumers. This includes items like milk, yogurt, juices, and bread.
The Pharmaceuticals segment, while representing a smaller but high-value segment, is driven by prescription-based omega-3 fatty acid medications for specific medical conditions, such as hypertriglyceridemia. Regulatory approvals and stringent quality standards characterize this segment.
Infant Formula is a critical segment, with DHA being an essential nutrient for the proper development of a baby's brain and eyes. Stringent regulations and high consumer trust in the safety and efficacy of omega-3 enriched infant formulas contribute to its steady demand.
Pet Foods represents an emerging segment, with pet owners increasingly seeking to provide their companions with health-enhancing supplements, including omega-3s for coat health, joint function, and overall well-being.
Fish Oil Epa And Dha Product Developments
Product innovation in the Fish Oil EPA and DHA market is centered on enhancing purity, bioavailability, and sensory appeal. Manufacturers are developing highly concentrated EPA and DHA formulations, often exceeding 90% purity, to meet specific therapeutic needs and consumer preferences for potent supplements. Advances in purification technologies, such as molecular distillation and supercritical fluid extraction, are crucial in removing contaminants and ensuring product safety. Furthermore, efforts are underway to mask the characteristic fishy odor and taste, leading to the development of flavored and odorless softgels and liquids. Novel delivery systems, including liposomal encapsulation and microemulsions, are being explored to improve the absorption and efficacy of omega-3s. These innovations aim to offer clear competitive advantages by addressing consumer concerns about taste, odor, and absorption, thereby expanding the market reach and appeal of fish oil products.
Key Drivers of Fish Oil Epa And Dha Growth
The Fish Oil EPA and DHA market is propelled by several key drivers. Firstly, the ever-increasing global awareness and understanding of the extensive health benefits associated with omega-3 fatty acids, particularly EPA and DHA, for cardiovascular health, cognitive function, and anti-inflammatory properties, is a primary catalyst. Secondly, the rising prevalence of chronic diseases and lifestyle-related health concerns worldwide is encouraging consumers to adopt preventative healthcare measures, including the consumption of omega-3 rich supplements. Thirdly, advancements in extraction and purification technologies are leading to higher quality, purer, and more bioavailable EPA and DHA products, meeting stringent regulatory standards and consumer demand. Finally, the growing popularity of fortified foods and beverages, along with the increasing demand for infant nutrition enriched with DHA, further contributes to sustained market growth.
Challenges in the Fish Oil Epa And Dha Market
Despite the robust growth, the Fish Oil EPA and DHA market faces several challenges. Supply chain volatility, driven by fluctuating fish stocks, fishing quotas, and seasonal availability, can impact raw material costs and consistent supply. Increasing regulatory scrutiny regarding purity standards, heavy metal contamination, and sustainability certifications presents a significant hurdle for manufacturers, requiring substantial investment in quality control and compliance. The growing consumer preference for alternative omega-3 sources, such as algal oil, which is plant-based and perceived as more sustainable, poses a competitive threat. Furthermore, the characteristic fishy odor and aftertaste of some fish oil products can deter a segment of consumers, necessitating ongoing innovation in taste masking and delivery systems. Fluctuating raw material prices can also impact profit margins, requiring careful strategic sourcing and pricing.
Emerging Opportunities in Fish Oil Epa And Dha
Emerging opportunities in the Fish Oil EPA and DHA market are diverse and promising. Technological breakthroughs in enzymatic triglyceride production are paving the way for more efficient and sustainable extraction of high-value EPA and DHA. Strategic partnerships between ingredient suppliers and food manufacturers are expanding the reach of omega-3s into novel food and beverage categories, catering to a broader consumer base. Market expansion into emerging economies, where awareness of omega-3 benefits is growing rapidly, presents significant untapped potential. Furthermore, research into the specific therapeutic applications of concentrated EPA and DHA for conditions beyond cardiovascular health, such as mental health and autoimmune diseases, is expected to drive demand in the pharmaceutical and nutraceutical sectors. The focus on marine biotechnology and sustainable aquaculture practices offers opportunities for innovative and environmentally responsible sourcing.
Leading Players in the Fish Oil Epa And Dha Sector
- DSM
- BASF
- Pelagia (EPAX)
- Golden Omega
- TASA
- Omega Protein
- Croda
- GC Rieber
- Polaris
- KD Pharma
- Yuwang Pharmaceutical
- Jiangsu Auqi Marine Biotechnology
- KinOmega Biopharm
- Skuny BioScience
- Anhui Xinzhou Marine Biological Products
- Renpu Pharmaceuticals
- Sinomega Biotech
- CABIO
- Segments
Key Milestones in Fish Oil Epa And Dha Industry
- 2019: Increased regulatory focus on sustainability in sourcing from major bodies.
- 2020: Significant growth in e-commerce sales of dietary supplements containing EPA & DHA.
- 2021: Launch of novel microencapsulation technologies for improved taste and stability.
- 2022: Expansion of fortified food and beverage offerings with omega-3s.
- 2023: Growing demand for high-purity EPA and DHA concentrates for pharmaceutical applications.
- 2024: Increased investment in sustainable aquaculture for fish oil production.
- 2025 (Estimated): Continued robust growth driven by health awareness and product innovation.
- 2026-2033 (Forecast Period): Sustained CAGR with emerging markets showing accelerated growth and new therapeutic applications gaining traction.
Strategic Outlook for Fish Oil Epa And Dha Market
The strategic outlook for the Fish Oil EPA and DHA market is characterized by sustained growth and increasing specialization. The market will likely see a continued emphasis on product innovation, focusing on higher purity, enhanced bioavailability, and improved sensory profiles to meet evolving consumer demands. Sustainability and traceability will remain paramount, driving investments in responsible sourcing and eco-friendly production methods. Expansion into emerging markets, coupled with the development of new therapeutic applications in the pharmaceutical and nutraceutical sectors, will act as significant growth accelerators. Strategic partnerships and collaborations across the value chain will be crucial for navigating regulatory landscapes and optimizing supply chains. The market is poised for continued expansion, driven by the undeniable health benefits and increasing consumer adoption of omega-3 fatty acids.
Fish Oil Epa And Dha Segmentation
-
1. Application
- 1.1. Dietary Supplements
- 1.2. Fortified Foods and Beverages
- 1.3. Infant Formula
- 1.4. Pharmaceuticals
- 1.5. Pet Foods
- 1.6. Others
-
2. Type
- 2.1. Fish Oil EPA
- 2.2. Fish Oil DHA
Fish Oil Epa And Dha Segmentation By Geography
-
1. North America
- 1.1. United States
- 1.2. Canada
- 1.3. Mexico
-
2. South America
- 2.1. Brazil
- 2.2. Argentina
- 2.3. Rest of South America
-
3. Europe
- 3.1. United Kingdom
- 3.2. Germany
- 3.3. France
- 3.4. Italy
- 3.5. Spain
- 3.6. Russia
- 3.7. Benelux
- 3.8. Nordics
- 3.9. Rest of Europe
-
4. Middle East & Africa
- 4.1. Turkey
- 4.2. Israel
- 4.3. GCC
- 4.4. North Africa
- 4.5. South Africa
- 4.6. Rest of Middle East & Africa
-
5. Asia Pacific
- 5.1. China
- 5.2. India
- 5.3. Japan
- 5.4. South Korea
- 5.5. ASEAN
- 5.6. Oceania
- 5.7. Rest of Asia Pacific
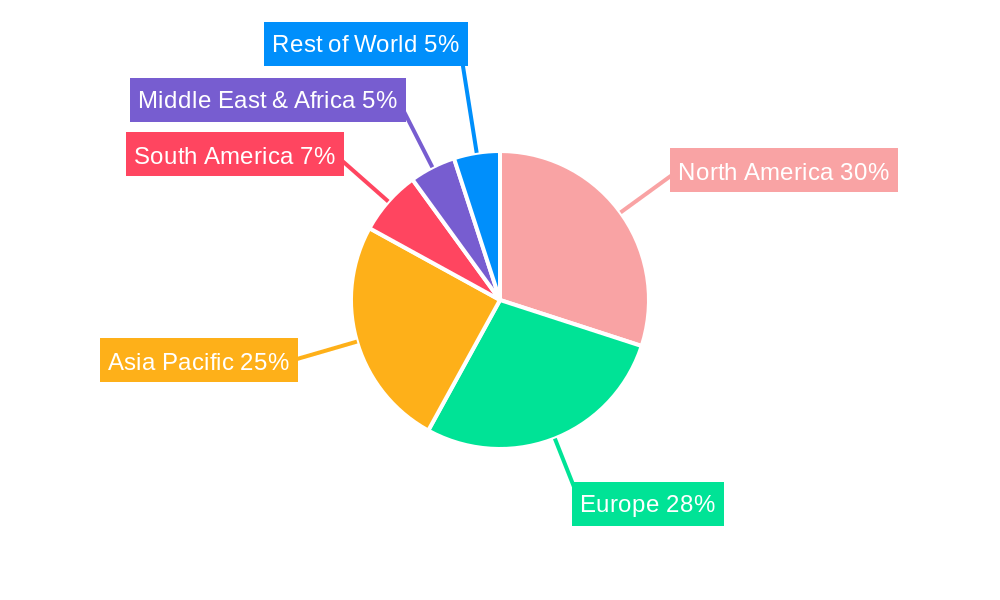
Fish Oil Epa And Dha Regional Market Share
Geographic Coverage of Fish Oil Epa And Dha
Fish Oil Epa And Dha REPORT HIGHLIGHTS
| Aspects | Details |
|---|---|
| Study Period | 2020-2034 |
| Base Year | 2025 |
| Estimated Year | 2026 |
| Forecast Period | 2026-2034 |
| Historical Period | 2020-2025 |
| Growth Rate | CAGR of 3.5% from 2020-2034 |
| Segmentation |
|
Table of Contents
- 1. Introduction
- 1.1. Research Scope
- 1.2. Market Segmentation
- 1.3. Research Methodology
- 1.4. Definitions and Assumptions
- 2. Executive Summary
- 2.1. Introduction
- 3. Market Dynamics
- 3.1. Introduction
- 3.2. Market Drivers
- 3.3. Market Restrains
- 3.4. Market Trends
- 4. Market Factor Analysis
- 4.1. Porters Five Forces
- 4.2. Supply/Value Chain
- 4.3. PESTEL analysis
- 4.4. Market Entropy
- 4.5. Patent/Trademark Analysis
- 5. Global Fish Oil Epa And Dha Analysis, Insights and Forecast, 2020-2032
- 5.1. Market Analysis, Insights and Forecast - by Application
- 5.1.1. Dietary Supplements
- 5.1.2. Fortified Foods and Beverages
- 5.1.3. Infant Formula
- 5.1.4. Pharmaceuticals
- 5.1.5. Pet Foods
- 5.1.6. Others
- 5.2. Market Analysis, Insights and Forecast - by Type
- 5.2.1. Fish Oil EPA
- 5.2.2. Fish Oil DHA
- 5.3. Market Analysis, Insights and Forecast - by Region
- 5.3.1. North America
- 5.3.2. South America
- 5.3.3. Europe
- 5.3.4. Middle East & Africa
- 5.3.5. Asia Pacific
- 5.1. Market Analysis, Insights and Forecast - by Application
- 6. North America Fish Oil Epa And Dha Analysis, Insights and Forecast, 2020-2032
- 6.1. Market Analysis, Insights and Forecast - by Application
- 6.1.1. Dietary Supplements
- 6.1.2. Fortified Foods and Beverages
- 6.1.3. Infant Formula
- 6.1.4. Pharmaceuticals
- 6.1.5. Pet Foods
- 6.1.6. Others
- 6.2. Market Analysis, Insights and Forecast - by Type
- 6.2.1. Fish Oil EPA
- 6.2.2. Fish Oil DHA
- 6.1. Market Analysis, Insights and Forecast - by Application
- 7. South America Fish Oil Epa And Dha Analysis, Insights and Forecast, 2020-2032
- 7.1. Market Analysis, Insights and Forecast - by Application
- 7.1.1. Dietary Supplements
- 7.1.2. Fortified Foods and Beverages
- 7.1.3. Infant Formula
- 7.1.4. Pharmaceuticals
- 7.1.5. Pet Foods
- 7.1.6. Others
- 7.2. Market Analysis, Insights and Forecast - by Type
- 7.2.1. Fish Oil EPA
- 7.2.2. Fish Oil DHA
- 7.1. Market Analysis, Insights and Forecast - by Application
- 8. Europe Fish Oil Epa And Dha Analysis, Insights and Forecast, 2020-2032
- 8.1. Market Analysis, Insights and Forecast - by Application
- 8.1.1. Dietary Supplements
- 8.1.2. Fortified Foods and Beverages
- 8.1.3. Infant Formula
- 8.1.4. Pharmaceuticals
- 8.1.5. Pet Foods
- 8.1.6. Others
- 8.2. Market Analysis, Insights and Forecast - by Type
- 8.2.1. Fish Oil EPA
- 8.2.2. Fish Oil DHA
- 8.1. Market Analysis, Insights and Forecast - by Application
- 9. Middle East & Africa Fish Oil Epa And Dha Analysis, Insights and Forecast, 2020-2032
- 9.1. Market Analysis, Insights and Forecast - by Application
- 9.1.1. Dietary Supplements
- 9.1.2. Fortified Foods and Beverages
- 9.1.3. Infant Formula
- 9.1.4. Pharmaceuticals
- 9.1.5. Pet Foods
- 9.1.6. Others
- 9.2. Market Analysis, Insights and Forecast - by Type
- 9.2.1. Fish Oil EPA
- 9.2.2. Fish Oil DHA
- 9.1. Market Analysis, Insights and Forecast - by Application
- 10. Asia Pacific Fish Oil Epa And Dha Analysis, Insights and Forecast, 2020-2032
- 10.1. Market Analysis, Insights and Forecast - by Application
- 10.1.1. Dietary Supplements
- 10.1.2. Fortified Foods and Beverages
- 10.1.3. Infant Formula
- 10.1.4. Pharmaceuticals
- 10.1.5. Pet Foods
- 10.1.6. Others
- 10.2. Market Analysis, Insights and Forecast - by Type
- 10.2.1. Fish Oil EPA
- 10.2.2. Fish Oil DHA
- 10.1. Market Analysis, Insights and Forecast - by Application
- 11. Competitive Analysis
- 11.1. Global Market Share Analysis 2025
- 11.2. Company Profiles
- 11.2.1 DSM
- 11.2.1.1. Overview
- 11.2.1.2. Products
- 11.2.1.3. SWOT Analysis
- 11.2.1.4. Recent Developments
- 11.2.1.5. Financials (Based on Availability)
- 11.2.2 BASF
- 11.2.2.1. Overview
- 11.2.2.2. Products
- 11.2.2.3. SWOT Analysis
- 11.2.2.4. Recent Developments
- 11.2.2.5. Financials (Based on Availability)
- 11.2.3 Pelagia (EPAX)
- 11.2.3.1. Overview
- 11.2.3.2. Products
- 11.2.3.3. SWOT Analysis
- 11.2.3.4. Recent Developments
- 11.2.3.5. Financials (Based on Availability)
- 11.2.4 Golden Omega
- 11.2.4.1. Overview
- 11.2.4.2. Products
- 11.2.4.3. SWOT Analysis
- 11.2.4.4. Recent Developments
- 11.2.4.5. Financials (Based on Availability)
- 11.2.5 TASA
- 11.2.5.1. Overview
- 11.2.5.2. Products
- 11.2.5.3. SWOT Analysis
- 11.2.5.4. Recent Developments
- 11.2.5.5. Financials (Based on Availability)
- 11.2.6 Omega Protein
- 11.2.6.1. Overview
- 11.2.6.2. Products
- 11.2.6.3. SWOT Analysis
- 11.2.6.4. Recent Developments
- 11.2.6.5. Financials (Based on Availability)
- 11.2.7 Croda
- 11.2.7.1. Overview
- 11.2.7.2. Products
- 11.2.7.3. SWOT Analysis
- 11.2.7.4. Recent Developments
- 11.2.7.5. Financials (Based on Availability)
- 11.2.8 GC Rieber
- 11.2.8.1. Overview
- 11.2.8.2. Products
- 11.2.8.3. SWOT Analysis
- 11.2.8.4. Recent Developments
- 11.2.8.5. Financials (Based on Availability)
- 11.2.9 Polaris
- 11.2.9.1. Overview
- 11.2.9.2. Products
- 11.2.9.3. SWOT Analysis
- 11.2.9.4. Recent Developments
- 11.2.9.5. Financials (Based on Availability)
- 11.2.10 KD Pharma
- 11.2.10.1. Overview
- 11.2.10.2. Products
- 11.2.10.3. SWOT Analysis
- 11.2.10.4. Recent Developments
- 11.2.10.5. Financials (Based on Availability)
- 11.2.11 Yuwang Pharmaceutical
- 11.2.11.1. Overview
- 11.2.11.2. Products
- 11.2.11.3. SWOT Analysis
- 11.2.11.4. Recent Developments
- 11.2.11.5. Financials (Based on Availability)
- 11.2.12 Jiangsu Auqi Marine Biotechnology
- 11.2.12.1. Overview
- 11.2.12.2. Products
- 11.2.12.3. SWOT Analysis
- 11.2.12.4. Recent Developments
- 11.2.12.5. Financials (Based on Availability)
- 11.2.13 KinOmega Biopharm
- 11.2.13.1. Overview
- 11.2.13.2. Products
- 11.2.13.3. SWOT Analysis
- 11.2.13.4. Recent Developments
- 11.2.13.5. Financials (Based on Availability)
- 11.2.14 Skuny BioScience
- 11.2.14.1. Overview
- 11.2.14.2. Products
- 11.2.14.3. SWOT Analysis
- 11.2.14.4. Recent Developments
- 11.2.14.5. Financials (Based on Availability)
- 11.2.15 Anhui Xinzhou Marine Biological Products
- 11.2.15.1. Overview
- 11.2.15.2. Products
- 11.2.15.3. SWOT Analysis
- 11.2.15.4. Recent Developments
- 11.2.15.5. Financials (Based on Availability)
- 11.2.16 Renpu Pharmaceuticals
- 11.2.16.1. Overview
- 11.2.16.2. Products
- 11.2.16.3. SWOT Analysis
- 11.2.16.4. Recent Developments
- 11.2.16.5. Financials (Based on Availability)
- 11.2.17 Sinomega Biotech
- 11.2.17.1. Overview
- 11.2.17.2. Products
- 11.2.17.3. SWOT Analysis
- 11.2.17.4. Recent Developments
- 11.2.17.5. Financials (Based on Availability)
- 11.2.18 CABIO
- 11.2.18.1. Overview
- 11.2.18.2. Products
- 11.2.18.3. SWOT Analysis
- 11.2.18.4. Recent Developments
- 11.2.18.5. Financials (Based on Availability)
- 11.2.1 DSM
List of Figures
- Figure 1: Global Fish Oil Epa And Dha Revenue Breakdown (million, %) by Region 2025 & 2033
- Figure 2: North America Fish Oil Epa And Dha Revenue (million), by Application 2025 & 2033
- Figure 3: North America Fish Oil Epa And Dha Revenue Share (%), by Application 2025 & 2033
- Figure 4: North America Fish Oil Epa And Dha Revenue (million), by Type 2025 & 2033
- Figure 5: North America Fish Oil Epa And Dha Revenue Share (%), by Type 2025 & 2033
- Figure 6: North America Fish Oil Epa And Dha Revenue (million), by Country 2025 & 2033
- Figure 7: North America Fish Oil Epa And Dha Revenue Share (%), by Country 2025 & 2033
- Figure 8: South America Fish Oil Epa And Dha Revenue (million), by Application 2025 & 2033
- Figure 9: South America Fish Oil Epa And Dha Revenue Share (%), by Application 2025 & 2033
- Figure 10: South America Fish Oil Epa And Dha Revenue (million), by Type 2025 & 2033
- Figure 11: South America Fish Oil Epa And Dha Revenue Share (%), by Type 2025 & 2033
- Figure 12: South America Fish Oil Epa And Dha Revenue (million), by Country 2025 & 2033
- Figure 13: South America Fish Oil Epa And Dha Revenue Share (%), by Country 2025 & 2033
- Figure 14: Europe Fish Oil Epa And Dha Revenue (million), by Application 2025 & 2033
- Figure 15: Europe Fish Oil Epa And Dha Revenue Share (%), by Application 2025 & 2033
- Figure 16: Europe Fish Oil Epa And Dha Revenue (million), by Type 2025 & 2033
- Figure 17: Europe Fish Oil Epa And Dha Revenue Share (%), by Type 2025 & 2033
- Figure 18: Europe Fish Oil Epa And Dha Revenue (million), by Country 2025 & 2033
- Figure 19: Europe Fish Oil Epa And Dha Revenue Share (%), by Country 2025 & 2033
- Figure 20: Middle East & Africa Fish Oil Epa And Dha Revenue (million), by Application 2025 & 2033
- Figure 21: Middle East & Africa Fish Oil Epa And Dha Revenue Share (%), by Application 2025 & 2033
- Figure 22: Middle East & Africa Fish Oil Epa And Dha Revenue (million), by Type 2025 & 2033
- Figure 23: Middle East & Africa Fish Oil Epa And Dha Revenue Share (%), by Type 2025 & 2033
- Figure 24: Middle East & Africa Fish Oil Epa And Dha Revenue (million), by Country 2025 & 2033
- Figure 25: Middle East & Africa Fish Oil Epa And Dha Revenue Share (%), by Country 2025 & 2033
- Figure 26: Asia Pacific Fish Oil Epa And Dha Revenue (million), by Application 2025 & 2033
- Figure 27: Asia Pacific Fish Oil Epa And Dha Revenue Share (%), by Application 2025 & 2033
- Figure 28: Asia Pacific Fish Oil Epa And Dha Revenue (million), by Type 2025 & 2033
- Figure 29: Asia Pacific Fish Oil Epa And Dha Revenue Share (%), by Type 2025 & 2033
- Figure 30: Asia Pacific Fish Oil Epa And Dha Revenue (million), by Country 2025 & 2033
- Figure 31: Asia Pacific Fish Oil Epa And Dha Revenue Share (%), by Country 2025 & 2033
List of Tables
- Table 1: Global Fish Oil Epa And Dha Revenue million Forecast, by Application 2020 & 2033
- Table 2: Global Fish Oil Epa And Dha Revenue million Forecast, by Type 2020 & 2033
- Table 3: Global Fish Oil Epa And Dha Revenue million Forecast, by Region 2020 & 2033
- Table 4: Global Fish Oil Epa And Dha Revenue million Forecast, by Application 2020 & 2033
- Table 5: Global Fish Oil Epa And Dha Revenue million Forecast, by Type 2020 & 2033
- Table 6: Global Fish Oil Epa And Dha Revenue million Forecast, by Country 2020 & 2033
- Table 7: United States Fish Oil Epa And Dha Revenue (million) Forecast, by Application 2020 & 2033
- Table 8: Canada Fish Oil Epa And Dha Revenue (million) Forecast, by Application 2020 & 2033
- Table 9: Mexico Fish Oil Epa And Dha Revenue (million) Forecast, by Application 2020 & 2033
- Table 10: Global Fish Oil Epa And Dha Revenue million Forecast, by Application 2020 & 2033
- Table 11: Global Fish Oil Epa And Dha Revenue million Forecast, by Type 2020 & 2033
- Table 12: Global Fish Oil Epa And Dha Revenue million Forecast, by Country 2020 & 2033
- Table 13: Brazil Fish Oil Epa And Dha Revenue (million) Forecast, by Application 2020 & 2033
- Table 14: Argentina Fish Oil Epa And Dha Revenue (million) Forecast, by Application 2020 & 2033
- Table 15: Rest of South America Fish Oil Epa And Dha Revenue (million) Forecast, by Application 2020 & 2033
- Table 16: Global Fish Oil Epa And Dha Revenue million Forecast, by Application 2020 & 2033
- Table 17: Global Fish Oil Epa And Dha Revenue million Forecast, by Type 2020 & 2033
- Table 18: Global Fish Oil Epa And Dha Revenue million Forecast, by Country 2020 & 2033
- Table 19: United Kingdom Fish Oil Epa And Dha Revenue (million) Forecast, by Application 2020 & 2033
- Table 20: Germany Fish Oil Epa And Dha Revenue (million) Forecast, by Application 2020 & 2033
- Table 21: France Fish Oil Epa And Dha Revenue (million) Forecast, by Application 2020 & 2033
- Table 22: Italy Fish Oil Epa And Dha Revenue (million) Forecast, by Application 2020 & 2033
- Table 23: Spain Fish Oil Epa And Dha Revenue (million) Forecast, by Application 2020 & 2033
- Table 24: Russia Fish Oil Epa And Dha Revenue (million) Forecast, by Application 2020 & 2033
- Table 25: Benelux Fish Oil Epa And Dha Revenue (million) Forecast, by Application 2020 & 2033
- Table 26: Nordics Fish Oil Epa And Dha Revenue (million) Forecast, by Application 2020 & 2033
- Table 27: Rest of Europe Fish Oil Epa And Dha Revenue (million) Forecast, by Application 2020 & 2033
- Table 28: Global Fish Oil Epa And Dha Revenue million Forecast, by Application 2020 & 2033
- Table 29: Global Fish Oil Epa And Dha Revenue million Forecast, by Type 2020 & 2033
- Table 30: Global Fish Oil Epa And Dha Revenue million Forecast, by Country 2020 & 2033
- Table 31: Turkey Fish Oil Epa And Dha Revenue (million) Forecast, by Application 2020 & 2033
- Table 32: Israel Fish Oil Epa And Dha Revenue (million) Forecast, by Application 2020 & 2033
- Table 33: GCC Fish Oil Epa And Dha Revenue (million) Forecast, by Application 2020 & 2033
- Table 34: North Africa Fish Oil Epa And Dha Revenue (million) Forecast, by Application 2020 & 2033
- Table 35: South Africa Fish Oil Epa And Dha Revenue (million) Forecast, by Application 2020 & 2033
- Table 36: Rest of Middle East & Africa Fish Oil Epa And Dha Revenue (million) Forecast, by Application 2020 & 2033
- Table 37: Global Fish Oil Epa And Dha Revenue million Forecast, by Application 2020 & 2033
- Table 38: Global Fish Oil Epa And Dha Revenue million Forecast, by Type 2020 & 2033
- Table 39: Global Fish Oil Epa And Dha Revenue million Forecast, by Country 2020 & 2033
- Table 40: China Fish Oil Epa And Dha Revenue (million) Forecast, by Application 2020 & 2033
- Table 41: India Fish Oil Epa And Dha Revenue (million) Forecast, by Application 2020 & 2033
- Table 42: Japan Fish Oil Epa And Dha Revenue (million) Forecast, by Application 2020 & 2033
- Table 43: South Korea Fish Oil Epa And Dha Revenue (million) Forecast, by Application 2020 & 2033
- Table 44: ASEAN Fish Oil Epa And Dha Revenue (million) Forecast, by Application 2020 & 2033
- Table 45: Oceania Fish Oil Epa And Dha Revenue (million) Forecast, by Application 2020 & 2033
- Table 46: Rest of Asia Pacific Fish Oil Epa And Dha Revenue (million) Forecast, by Application 2020 & 2033
Frequently Asked Questions
1. What is the projected Compound Annual Growth Rate (CAGR) of the Fish Oil Epa And Dha?
The projected CAGR is approximately 3.5%.
2. Which companies are prominent players in the Fish Oil Epa And Dha?
Key companies in the market include DSM, BASF, Pelagia (EPAX), Golden Omega, TASA, Omega Protein, Croda, GC Rieber, Polaris, KD Pharma, Yuwang Pharmaceutical, Jiangsu Auqi Marine Biotechnology, KinOmega Biopharm, Skuny BioScience, Anhui Xinzhou Marine Biological Products, Renpu Pharmaceuticals, Sinomega Biotech, CABIO.
3. What are the main segments of the Fish Oil Epa And Dha?
The market segments include Application, Type.
4. Can you provide details about the market size?
The market size is estimated to be USD 2386 million as of 2022.
5. What are some drivers contributing to market growth?
N/A
6. What are the notable trends driving market growth?
N/A
7. Are there any restraints impacting market growth?
N/A
8. Can you provide examples of recent developments in the market?
N/A
9. What pricing options are available for accessing the report?
Pricing options include single-user, multi-user, and enterprise licenses priced at USD 2900.00, USD 4350.00, and USD 5800.00 respectively.
10. Is the market size provided in terms of value or volume?
The market size is provided in terms of value, measured in million.
11. Are there any specific market keywords associated with the report?
Yes, the market keyword associated with the report is "Fish Oil Epa And Dha," which aids in identifying and referencing the specific market segment covered.
12. How do I determine which pricing option suits my needs best?
The pricing options vary based on user requirements and access needs. Individual users may opt for single-user licenses, while businesses requiring broader access may choose multi-user or enterprise licenses for cost-effective access to the report.
13. Are there any additional resources or data provided in the Fish Oil Epa And Dha report?
While the report offers comprehensive insights, it's advisable to review the specific contents or supplementary materials provided to ascertain if additional resources or data are available.
14. How can I stay updated on further developments or reports in the Fish Oil Epa And Dha?
To stay informed about further developments, trends, and reports in the Fish Oil Epa And Dha, consider subscribing to industry newsletters, following relevant companies and organizations, or regularly checking reputable industry news sources and publications.
Methodology
Step 1 - Identification of Relevant Samples Size from Population Database


Step 2 - Approaches for Defining Global Market Size (Value, Volume* & Price*)

Note*: In applicable scenarios
Step 3 - Data Sources
Primary Research
- Web Analytics
- Survey Reports
- Research Institute
- Latest Research Reports
- Opinion Leaders
Secondary Research
- Annual Reports
- White Paper
- Latest Press Release
- Industry Association
- Paid Database
- Investor Presentations

Step 4 - Data Triangulation
Involves using different sources of information in order to increase the validity of a study
These sources are likely to be stakeholders in a program - participants, other researchers, program staff, other community members, and so on.
Then we put all data in single framework & apply various statistical tools to find out the dynamic on the market.
During the analysis stage, feedback from the stakeholder groups would be compared to determine areas of agreement as well as areas of divergence