

Key Insights
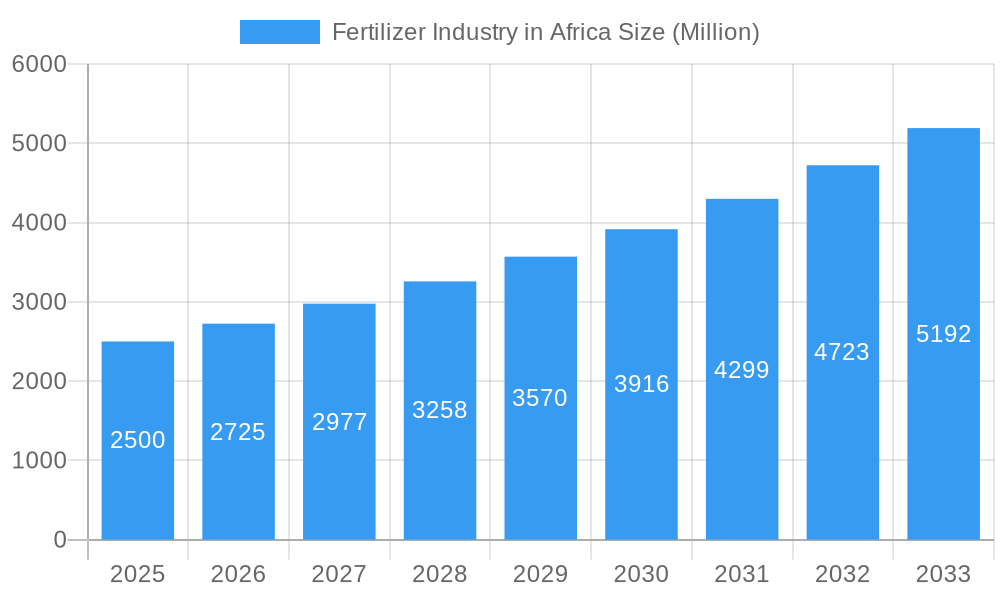
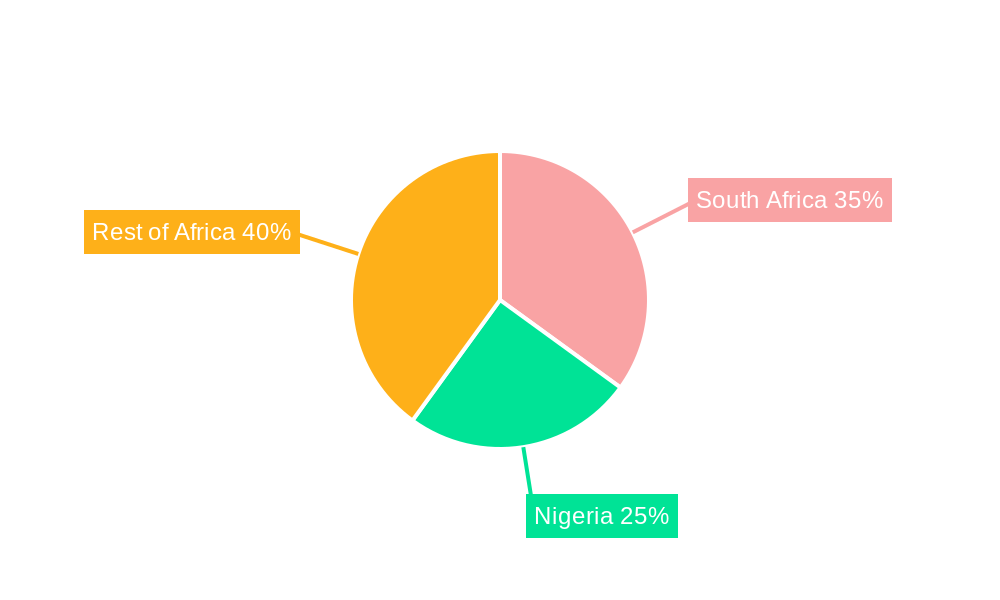
The African fertilizer market, valued at approximately $XX million in 2025, is experiencing robust growth, projected to expand at a CAGR of 9.02% from 2025 to 2033. This surge is driven by several factors. Increasing agricultural production to meet the demands of a rapidly growing population is a primary driver. Government initiatives promoting agricultural modernization and improved farming techniques, including increased fertilizer usage, further fuel market expansion. The rising adoption of advanced farming practices like fertigation, and a shift towards high-yielding crop varieties are also contributing to growth. However, challenges remain. High input costs, including fertilizer prices, coupled with limited access to credit and infrastructure limitations in certain regions, restrain market growth, particularly in less developed areas. Market segmentation reveals a strong demand for both conventional and specialty fertilizers, catering to diverse crop types (field crops, horticultural crops, and turf & ornamental) and application methods (fertigation, foliar, and soil). South Africa and Nigeria dominate the regional landscape, accounting for a significant portion of the market share. The market’s future hinges on addressing infrastructural deficiencies, enhancing farmer access to finance, and promoting sustainable agricultural practices. Continued investment in research and development focusing on locally adapted fertilizers will be crucial for unlocking the full potential of the African fertilizer market. The diversification of fertilizer forms and types, catering to specific crop needs, will also play a significant role in shaping future market trends.
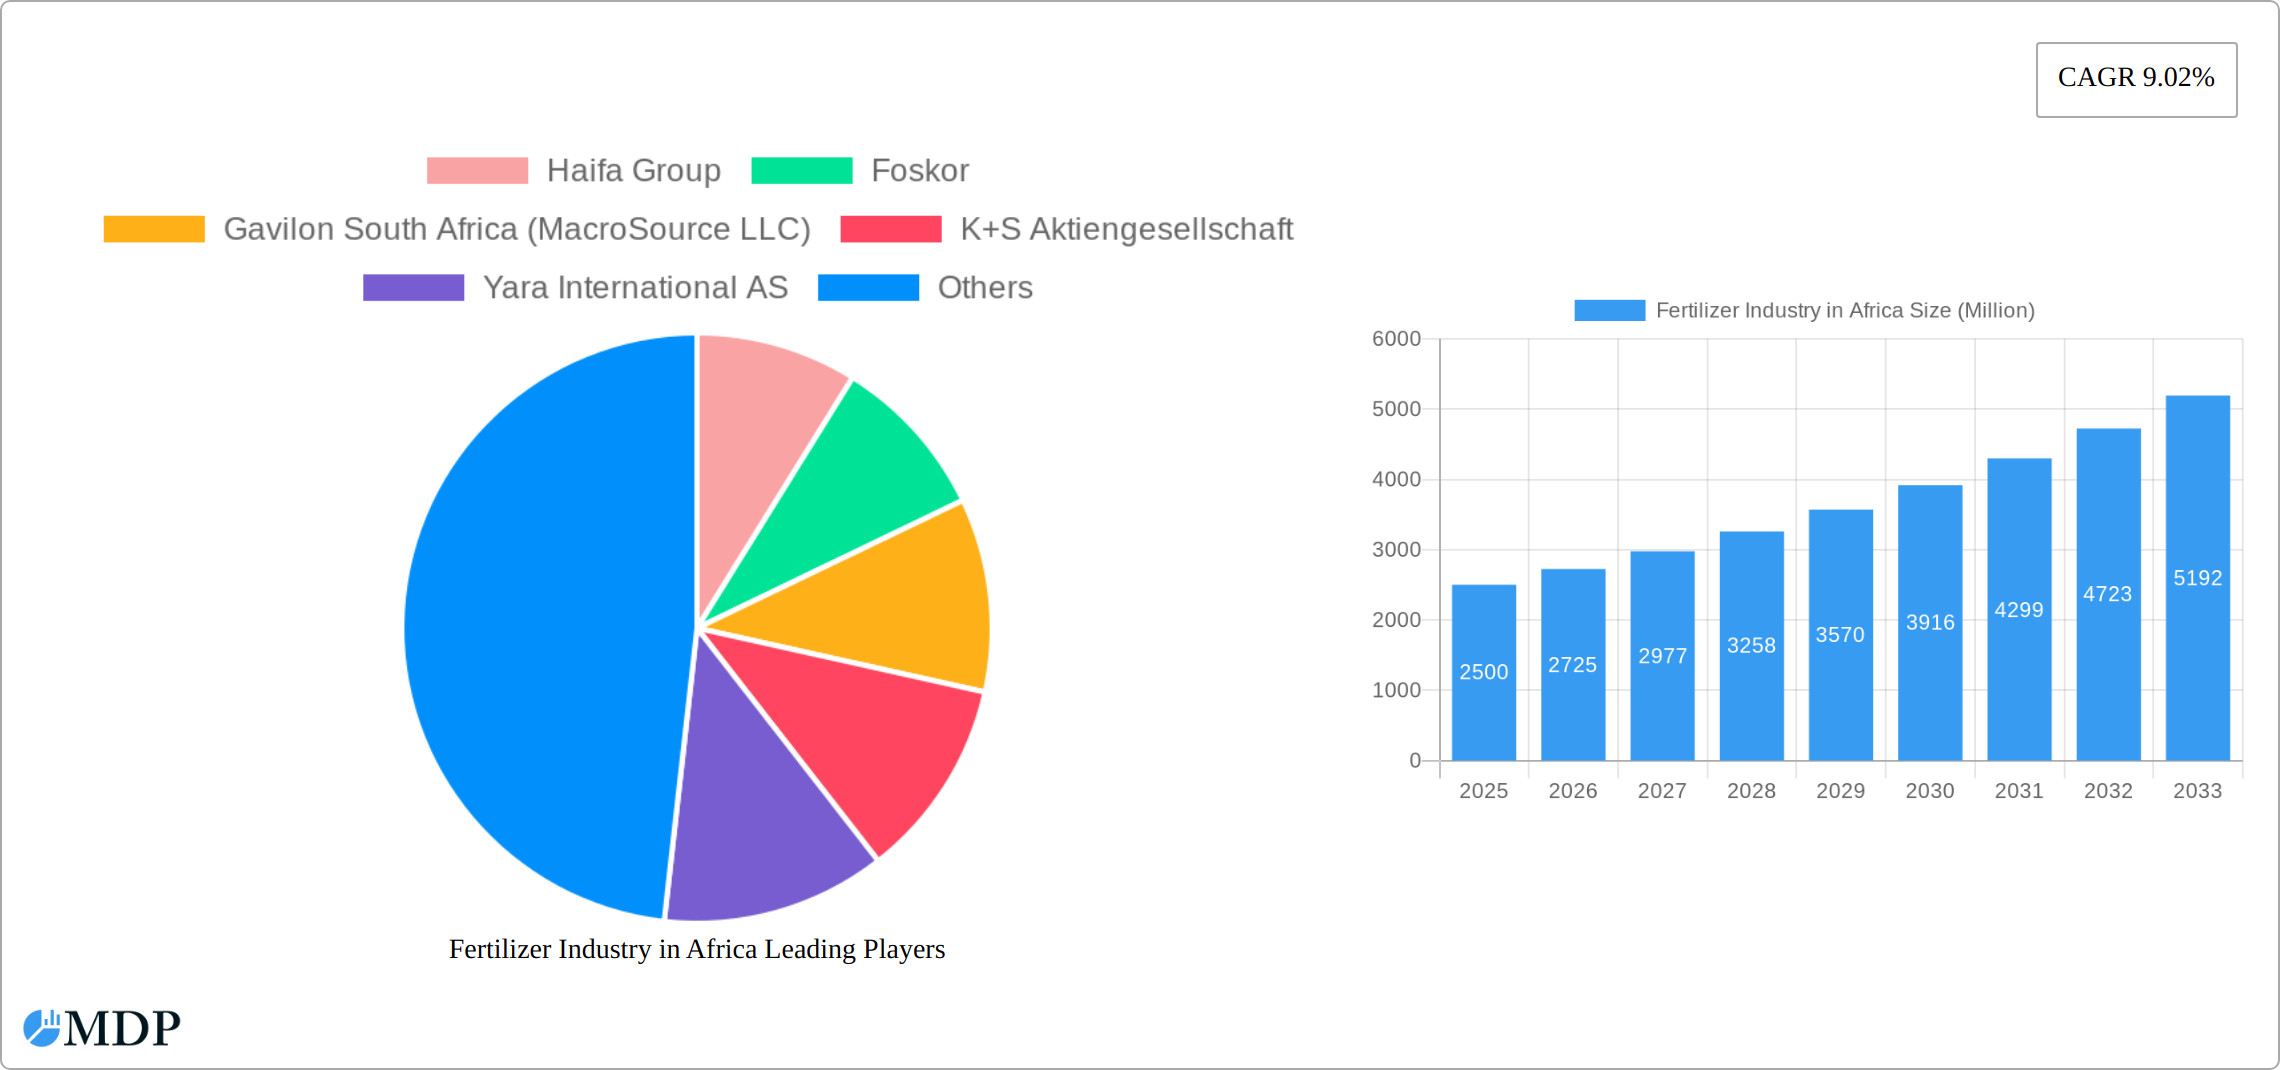
Fertilizer Industry in Africa Market Size (In Billion)
The competitive landscape is marked by a mix of both multinational corporations and local players. Key players, including Haifa Group, Foskor, Yara International, and ICL Group, are strategically positioning themselves within this evolving market. Their success is largely dependent on effective distribution networks, capacity to provide technical support to farmers, and the ability to adapt to the unique needs of various African agricultural contexts. Given the substantial untapped potential of the African agricultural sector, the fertilizer industry is poised for substantial expansion over the forecast period, demanding both investment and innovative solutions to address existing challenges. Sustainable practices, affordability, and effective distribution will be key differentiators in the coming years.
Fertilizer Industry in Africa Company Market Share
Fertilizer Industry in Africa: A Comprehensive Market Report (2019-2033)
This comprehensive report provides an in-depth analysis of the African fertilizer industry, covering market dynamics, leading players, and future growth opportunities. The study period spans from 2019 to 2033, with a focus on 2025 as the base and estimated year. This report is essential for investors, industry stakeholders, and anyone seeking to understand the complexities and potential of this rapidly evolving market. The report includes detailed analysis of key segments, including application modes (fertigation, foliar, soil), crop types (field crops, horticultural crops, turf & ornamental), fertilizer forms (conventional, specialty), and fertilizer types (complex, straight, water-soluble specialty). The report also incorporates data from major African countries like Nigeria and South Africa, and the rest of Africa.
Fertilizer Industry in Africa Market Dynamics & Concentration
The African fertilizer market is a dynamic landscape shaped by a complex interplay of factors influencing its concentration, innovation, and regulatory environment. While several multinational corporations like Yara International, ICL Group, and K+S hold substantial market shares, contributing to a moderately concentrated market, numerous smaller regional and local players also significantly impact the overall market dynamics. Innovation is a key driver, fueled by the growing need for enhanced nutrient-use efficiency and sustainable agricultural practices. This has led to the development and adoption of specialized fertilizers such as ICL's Solinure, showcasing a commitment to improving crop yields while minimizing environmental impact. Regulatory frameworks, however, vary considerably across different African nations, impacting market access, product registration, and ultimately, pricing. While alternatives like organic fertilizers and improved soil management practices exist, their market penetration remains limited, with conventional fertilizers continuing to dominate the sector. End-user trends reveal a clear preference for higher-quality, value-added fertilizers that deliver improved yields and optimize resource utilization. The past five years have witnessed [Insert Number] mergers and acquisitions (M&A) deals, including notable acquisitions like K+S's 75% stake in Industrial Commodities Holdings (Pty) Ltd in April 2023, significantly reshaping the competitive landscape and consolidating market power. Analysis indicates that the top 5 players control approximately [Insert Percentage]% of the market, while the remaining [Insert Percentage]% is dispersed among a large number of smaller participants. This fragmented nature presents both opportunities and challenges for growth.
- Market Concentration: Moderately concentrated, with substantial regional variations reflecting diverse economic and infrastructural conditions.
- Innovation Drivers: Growing demand for higher crop yields, sustainable agriculture, and efficient nutrient utilization are pushing innovation in fertilizer technology.
- Regulatory Frameworks: Diverse regulatory landscapes across African nations influence market access, pricing strategies, and the overall ease of doing business.
- Product Substitutes: Organic fertilizers and improved soil management techniques present niche alternatives, but their widespread adoption remains limited.
- End-User Trends: A clear preference towards high-quality, efficient fertilizers that provide demonstrable improvements in crop yields and profitability.
- M&A Activities: [Insert Number] deals in the past five years illustrate ongoing consolidation and expansion within the African fertilizer market.
Fertilizer Industry in Africa Industry Trends & Analysis
The African fertilizer market is experiencing robust growth, propelled by several key factors. Increasing agricultural production, driven by rising food demand and a growing population, is a primary driver. Government support for agricultural development, including investment in infrastructure and farmer support programs, further stimulates market expansion. The Compound Annual Growth Rate (CAGR) for the period 2019-2024 is estimated at [Insert Percentage]%, with market penetration steadily increasing across various regions. Technological advancements, such as the adoption of precision farming techniques and digital tools for optimized fertilizer application, are transforming the industry. Consumer preferences are shifting towards value-added fertilizers offering superior nutrient uptake and enhanced yield. Competitive dynamics are significantly influenced by factors like pricing strategies, product innovation, efficient distribution networks, and the ability to effectively reach and support farmers. Market growth is projected to accelerate, particularly in countries with supportive government policies and significant investments in agricultural infrastructure. The forecast period (2025-2033) anticipates a CAGR of [Insert Percentage]%, fueled by rising incomes, population growth, and increasing investment in modern farming techniques. However, this positive outlook is contingent on addressing critical challenges such as infrastructural limitations, fluctuating commodity prices, and ensuring access to finance for farmers.
Leading Markets & Segments in Fertilizer Industry in Africa
South Africa currently leads the African fertilizer market in terms of consumption, primarily due to its well-established agricultural sector, advanced farming practices, and substantial investments in agricultural infrastructure and technology. Nigeria represents another significant market with substantial growth potential, although logistical challenges remain a constraint. The "Rest of Africa" encompasses a diverse range of markets at different stages of development and market maturity, each presenting unique opportunities and challenges.
Dominant Segments:
- Country: South Africa, Nigeria, and diverse markets within the "Rest of Africa" category.
- Application Mode: Soil application remains the most prevalent method, followed by fertigation (applying fertilizers through irrigation systems) and foliar application (direct application to plant leaves).
- Form: Conventional fertilizers continue to hold the largest market share due to their cost-effectiveness and wide availability. However, specialty fertilizers, tailored to specific crop needs, are witnessing increasing demand and growth.
- Crop Type: Field crops, owing to their large-scale cultivation, constitute the dominant segment, followed by horticultural crops. Turf and ornamental applications represent niche markets.
- Type: Complex fertilizers (containing multiple nutrients) are most widely used, followed by straight fertilizers (containing a single nutrient). Water-soluble fertilizers, offering improved nutrient uptake, are also gaining traction.
Key Drivers for Dominant Segments:
- South Africa: A robust agricultural sector supported by advanced farming techniques, supportive government policies, and access to financing and technology.
- Nigeria: A large agricultural sector, a rapidly growing population, and an increasing demand for food, coupled with ongoing investments in agricultural development.
- Rest of Africa: A diverse market with pockets of high growth potential, but also significant infrastructure gaps that hinder market expansion in many areas.
- Soil Application: Established application methods, relatively lower investment requirements, and ease of use contribute to its dominance.
- Conventional Fertilizers: Cost-effectiveness and widespread availability remain key factors driving their continued use.
- Field Crops: The large-scale cultivation of field crops drives significant fertilizer consumption volumes.
Fertilizer Industry in Africa Product Developments
Recent product innovations focus on improving nutrient efficiency, reducing environmental impact, and enhancing crop yields. Companies are developing specialty fertilizers tailored to specific crop needs and soil conditions. This includes the launch of enhanced NPK formulations like ICL's Solinure, which optimize yields with increased trace elements. These products leverage advanced technologies to improve nutrient uptake and reduce fertilizer waste. The market is witnessing the introduction of slow-release and controlled-release fertilizers for better nutrient management, addressing environmental concerns and improving overall efficiency.
Key Drivers of Fertilizer Industry in Africa Growth
Several converging factors are propelling the growth of the African fertilizer market. Technological advancements in fertilizer production and application are enhancing efficiency, reducing environmental impact, and improving nutrient-use efficiency. Government initiatives focused on agricultural development, along with investments in crucial infrastructure such as transportation networks and storage facilities, create a favorable environment for growth. Rising incomes and population growth are fueling an increased demand for food, directly boosting fertilizer consumption. Overall economic growth in several African countries is leading to greater investment in the agricultural sector and increased spending on fertilizers. These factors, combined, point towards a promising trajectory for the fertilizer industry.
Challenges in the Fertilizer Industry in Africa Market
The African fertilizer industry faces several challenges. Inadequate infrastructure, particularly in transportation and storage, increases costs and hampers efficient distribution. Fluctuating commodity prices and currency volatility impact profitability. Access to finance and credit is limited for many farmers, hindering fertilizer adoption. Regulatory hurdles and bureaucratic complexities can delay market entry for new players. These factors collectively constrain the growth of the market and present obstacles to achieving its full potential. The lack of sufficient soil testing and extension services further complicates fertilizer application and limits yield optimization.
Emerging Opportunities in Fertilizer Industry in Africa
The long-term growth trajectory of the African fertilizer industry is underpinned by several exciting opportunities. Technological innovations in precision farming and digital agriculture offer significant potential to optimize fertilizer application, improve yields, and minimize environmental footprint. Strategic partnerships between fertilizer companies and agricultural input suppliers are crucial for enhancing distribution networks, making fertilizers more accessible and affordable to farmers. Market expansion into underserved regions with high agricultural potential, particularly in sub-Saharan Africa, presents significant growth opportunities. However, realizing this potential requires concerted efforts in infrastructure development and farmer education and training programs, focusing on best practices and sustainable farming techniques.
Leading Players in the Fertilizer Industry in Africa Sector
- Haifa Group
- Foskor
- Gavilon South Africa (MacroSource LLC)
- K+S Aktiengesellschaft
- Yara International AS
- UPL Limited
- ICL Group Ltd
- Kynoch Fertilizer
Key Milestones in Fertilizer Industry in Africa Industry
- May 2022: ICL launched three new NPK formulations of Solinure, optimizing yields with increased trace elements.
- January 2023: ICL partnered with General Mills for supplying specialty phosphate solutions, signaling international expansion.
- April 2023: K+S acquired a 75% share of Industrial Commodities Holdings (Pty) Ltd's fertilizer business, strengthening its presence in southern and eastern Africa. The new joint venture will operate under the name FertivPty Ltd.
Strategic Outlook for Fertilizer Industry in Africa Market
The African fertilizer market holds significant long-term potential. Continued investment in agricultural infrastructure, coupled with technological advancements and supportive government policies, will drive substantial growth. Strategic partnerships and market expansion into untapped regions offer considerable opportunities for players. Addressing challenges related to supply chain efficiency, affordability, and sustainable practices will be crucial for achieving the industry's full potential. The focus on enhancing farmer access to quality fertilizers, combined with effective extension services, is pivotal to market expansion and sustainable agricultural development throughout the forecast period.
Fertilizer Industry in Africa Segmentation
- 1. Production Analysis
- 2. Consumption Analysis
- 3. Import Market Analysis (Value & Volume)
- 4. Export Market Analysis (Value & Volume)
- 5. Price Trend Analysis
Fertilizer Industry in Africa Segmentation By Geography
-
1. North America
- 1.1. United States
- 1.2. Canada
- 1.3. Mexico
-
2. South America
- 2.1. Brazil
- 2.2. Argentina
- 2.3. Rest of South America
-
3. Europe
- 3.1. United Kingdom
- 3.2. Germany
- 3.3. France
- 3.4. Italy
- 3.5. Spain
- 3.6. Russia
- 3.7. Benelux
- 3.8. Nordics
- 3.9. Rest of Europe
-
4. Middle East & Africa
- 4.1. Turkey
- 4.2. Israel
- 4.3. GCC
- 4.4. North Africa
- 4.5. South Africa
- 4.6. Rest of Middle East & Africa
-
5. Asia Pacific
- 5.1. China
- 5.2. India
- 5.3. Japan
- 5.4. South Korea
- 5.5. ASEAN
- 5.6. Oceania
- 5.7. Rest of Asia Pacific
Fertilizer Industry in Africa Regional Market Share
Geographic Coverage of Fertilizer Industry in Africa
Fertilizer Industry in Africa REPORT HIGHLIGHTS
| Aspects | Details |
|---|---|
| Study Period | 2020-2034 |
| Base Year | 2025 |
| Estimated Year | 2026 |
| Forecast Period | 2026-2034 |
| Historical Period | 2020-2025 |
| Growth Rate | CAGR of 9.02% from 2020-2034 |
| Segmentation |
|
Table of Contents
- 1. Introduction
- 1.1. Research Scope
- 1.2. Market Segmentation
- 1.3. Research Methodology
- 1.4. Definitions and Assumptions
- 2. Executive Summary
- 2.1. Introduction
- 3. Market Dynamics
- 3.1. Introduction
- 3.2. Market Drivers
- 3.2.1. Need for Custom Product Development; Use of CROs for Regulatory Services
- 3.3. Market Restrains
- 3.3.1. Data and Cyber Security Concerns; Lack of Experts and Professionals in this Industry
- 3.4. Market Trends
- 3.4.1. OTHER KEY INDUSTRY TRENDS COVERED IN THE REPORT
- 4. Market Factor Analysis
- 4.1. Porters Five Forces
- 4.2. Supply/Value Chain
- 4.3. PESTEL analysis
- 4.4. Market Entropy
- 4.5. Patent/Trademark Analysis
- 5. Global Fertilizer Industry in Africa Analysis, Insights and Forecast, 2020-2032
- 5.1. Market Analysis, Insights and Forecast - by Production Analysis
- 5.2. Market Analysis, Insights and Forecast - by Consumption Analysis
- 5.3. Market Analysis, Insights and Forecast - by Import Market Analysis (Value & Volume)
- 5.4. Market Analysis, Insights and Forecast - by Export Market Analysis (Value & Volume)
- 5.5. Market Analysis, Insights and Forecast - by Price Trend Analysis
- 5.6. Market Analysis, Insights and Forecast - by Region
- 5.6.1. North America
- 5.6.2. South America
- 5.6.3. Europe
- 5.6.4. Middle East & Africa
- 5.6.5. Asia Pacific
- 5.1. Market Analysis, Insights and Forecast - by Production Analysis
- 6. North America Fertilizer Industry in Africa Analysis, Insights and Forecast, 2020-2032
- 6.1. Market Analysis, Insights and Forecast - by Production Analysis
- 6.2. Market Analysis, Insights and Forecast - by Consumption Analysis
- 6.3. Market Analysis, Insights and Forecast - by Import Market Analysis (Value & Volume)
- 6.4. Market Analysis, Insights and Forecast - by Export Market Analysis (Value & Volume)
- 6.5. Market Analysis, Insights and Forecast - by Price Trend Analysis
- 6.1. Market Analysis, Insights and Forecast - by Production Analysis
- 7. South America Fertilizer Industry in Africa Analysis, Insights and Forecast, 2020-2032
- 7.1. Market Analysis, Insights and Forecast - by Production Analysis
- 7.2. Market Analysis, Insights and Forecast - by Consumption Analysis
- 7.3. Market Analysis, Insights and Forecast - by Import Market Analysis (Value & Volume)
- 7.4. Market Analysis, Insights and Forecast - by Export Market Analysis (Value & Volume)
- 7.5. Market Analysis, Insights and Forecast - by Price Trend Analysis
- 7.1. Market Analysis, Insights and Forecast - by Production Analysis
- 8. Europe Fertilizer Industry in Africa Analysis, Insights and Forecast, 2020-2032
- 8.1. Market Analysis, Insights and Forecast - by Production Analysis
- 8.2. Market Analysis, Insights and Forecast - by Consumption Analysis
- 8.3. Market Analysis, Insights and Forecast - by Import Market Analysis (Value & Volume)
- 8.4. Market Analysis, Insights and Forecast - by Export Market Analysis (Value & Volume)
- 8.5. Market Analysis, Insights and Forecast - by Price Trend Analysis
- 8.1. Market Analysis, Insights and Forecast - by Production Analysis
- 9. Middle East & Africa Fertilizer Industry in Africa Analysis, Insights and Forecast, 2020-2032
- 9.1. Market Analysis, Insights and Forecast - by Production Analysis
- 9.2. Market Analysis, Insights and Forecast - by Consumption Analysis
- 9.3. Market Analysis, Insights and Forecast - by Import Market Analysis (Value & Volume)
- 9.4. Market Analysis, Insights and Forecast - by Export Market Analysis (Value & Volume)
- 9.5. Market Analysis, Insights and Forecast - by Price Trend Analysis
- 9.1. Market Analysis, Insights and Forecast - by Production Analysis
- 10. Asia Pacific Fertilizer Industry in Africa Analysis, Insights and Forecast, 2020-2032
- 10.1. Market Analysis, Insights and Forecast - by Production Analysis
- 10.2. Market Analysis, Insights and Forecast - by Consumption Analysis
- 10.3. Market Analysis, Insights and Forecast - by Import Market Analysis (Value & Volume)
- 10.4. Market Analysis, Insights and Forecast - by Export Market Analysis (Value & Volume)
- 10.5. Market Analysis, Insights and Forecast - by Price Trend Analysis
- 10.1. Market Analysis, Insights and Forecast - by Production Analysis
- 11. Competitive Analysis
- 11.1. Global Market Share Analysis 2025
- 11.2. Company Profiles
- 11.2.1 Haifa Group
- 11.2.1.1. Overview
- 11.2.1.2. Products
- 11.2.1.3. SWOT Analysis
- 11.2.1.4. Recent Developments
- 11.2.1.5. Financials (Based on Availability)
- 11.2.2 Foskor
- 11.2.2.1. Overview
- 11.2.2.2. Products
- 11.2.2.3. SWOT Analysis
- 11.2.2.4. Recent Developments
- 11.2.2.5. Financials (Based on Availability)
- 11.2.3 Gavilon South Africa (MacroSource LLC)
- 11.2.3.1. Overview
- 11.2.3.2. Products
- 11.2.3.3. SWOT Analysis
- 11.2.3.4. Recent Developments
- 11.2.3.5. Financials (Based on Availability)
- 11.2.4 K+S Aktiengesellschaft
- 11.2.4.1. Overview
- 11.2.4.2. Products
- 11.2.4.3. SWOT Analysis
- 11.2.4.4. Recent Developments
- 11.2.4.5. Financials (Based on Availability)
- 11.2.5 Yara International AS
- 11.2.5.1. Overview
- 11.2.5.2. Products
- 11.2.5.3. SWOT Analysis
- 11.2.5.4. Recent Developments
- 11.2.5.5. Financials (Based on Availability)
- 11.2.6 UPL Limited
- 11.2.6.1. Overview
- 11.2.6.2. Products
- 11.2.6.3. SWOT Analysis
- 11.2.6.4. Recent Developments
- 11.2.6.5. Financials (Based on Availability)
- 11.2.7 ICL Group Ltd
- 11.2.7.1. Overview
- 11.2.7.2. Products
- 11.2.7.3. SWOT Analysis
- 11.2.7.4. Recent Developments
- 11.2.7.5. Financials (Based on Availability)
- 11.2.8 Kynoch Fertilizer
- 11.2.8.1. Overview
- 11.2.8.2. Products
- 11.2.8.3. SWOT Analysis
- 11.2.8.4. Recent Developments
- 11.2.8.5. Financials (Based on Availability)
- 11.2.1 Haifa Group
List of Figures
- Figure 1: Global Fertilizer Industry in Africa Revenue Breakdown (Million, %) by Region 2025 & 2033
- Figure 2: North America Fertilizer Industry in Africa Revenue (Million), by Production Analysis 2025 & 2033
- Figure 3: North America Fertilizer Industry in Africa Revenue Share (%), by Production Analysis 2025 & 2033
- Figure 4: North America Fertilizer Industry in Africa Revenue (Million), by Consumption Analysis 2025 & 2033
- Figure 5: North America Fertilizer Industry in Africa Revenue Share (%), by Consumption Analysis 2025 & 2033
- Figure 6: North America Fertilizer Industry in Africa Revenue (Million), by Import Market Analysis (Value & Volume) 2025 & 2033
- Figure 7: North America Fertilizer Industry in Africa Revenue Share (%), by Import Market Analysis (Value & Volume) 2025 & 2033
- Figure 8: North America Fertilizer Industry in Africa Revenue (Million), by Export Market Analysis (Value & Volume) 2025 & 2033
- Figure 9: North America Fertilizer Industry in Africa Revenue Share (%), by Export Market Analysis (Value & Volume) 2025 & 2033
- Figure 10: North America Fertilizer Industry in Africa Revenue (Million), by Price Trend Analysis 2025 & 2033
- Figure 11: North America Fertilizer Industry in Africa Revenue Share (%), by Price Trend Analysis 2025 & 2033
- Figure 12: North America Fertilizer Industry in Africa Revenue (Million), by Country 2025 & 2033
- Figure 13: North America Fertilizer Industry in Africa Revenue Share (%), by Country 2025 & 2033
- Figure 14: South America Fertilizer Industry in Africa Revenue (Million), by Production Analysis 2025 & 2033
- Figure 15: South America Fertilizer Industry in Africa Revenue Share (%), by Production Analysis 2025 & 2033
- Figure 16: South America Fertilizer Industry in Africa Revenue (Million), by Consumption Analysis 2025 & 2033
- Figure 17: South America Fertilizer Industry in Africa Revenue Share (%), by Consumption Analysis 2025 & 2033
- Figure 18: South America Fertilizer Industry in Africa Revenue (Million), by Import Market Analysis (Value & Volume) 2025 & 2033
- Figure 19: South America Fertilizer Industry in Africa Revenue Share (%), by Import Market Analysis (Value & Volume) 2025 & 2033
- Figure 20: South America Fertilizer Industry in Africa Revenue (Million), by Export Market Analysis (Value & Volume) 2025 & 2033
- Figure 21: South America Fertilizer Industry in Africa Revenue Share (%), by Export Market Analysis (Value & Volume) 2025 & 2033
- Figure 22: South America Fertilizer Industry in Africa Revenue (Million), by Price Trend Analysis 2025 & 2033
- Figure 23: South America Fertilizer Industry in Africa Revenue Share (%), by Price Trend Analysis 2025 & 2033
- Figure 24: South America Fertilizer Industry in Africa Revenue (Million), by Country 2025 & 2033
- Figure 25: South America Fertilizer Industry in Africa Revenue Share (%), by Country 2025 & 2033
- Figure 26: Europe Fertilizer Industry in Africa Revenue (Million), by Production Analysis 2025 & 2033
- Figure 27: Europe Fertilizer Industry in Africa Revenue Share (%), by Production Analysis 2025 & 2033
- Figure 28: Europe Fertilizer Industry in Africa Revenue (Million), by Consumption Analysis 2025 & 2033
- Figure 29: Europe Fertilizer Industry in Africa Revenue Share (%), by Consumption Analysis 2025 & 2033
- Figure 30: Europe Fertilizer Industry in Africa Revenue (Million), by Import Market Analysis (Value & Volume) 2025 & 2033
- Figure 31: Europe Fertilizer Industry in Africa Revenue Share (%), by Import Market Analysis (Value & Volume) 2025 & 2033
- Figure 32: Europe Fertilizer Industry in Africa Revenue (Million), by Export Market Analysis (Value & Volume) 2025 & 2033
- Figure 33: Europe Fertilizer Industry in Africa Revenue Share (%), by Export Market Analysis (Value & Volume) 2025 & 2033
- Figure 34: Europe Fertilizer Industry in Africa Revenue (Million), by Price Trend Analysis 2025 & 2033
- Figure 35: Europe Fertilizer Industry in Africa Revenue Share (%), by Price Trend Analysis 2025 & 2033
- Figure 36: Europe Fertilizer Industry in Africa Revenue (Million), by Country 2025 & 2033
- Figure 37: Europe Fertilizer Industry in Africa Revenue Share (%), by Country 2025 & 2033
- Figure 38: Middle East & Africa Fertilizer Industry in Africa Revenue (Million), by Production Analysis 2025 & 2033
- Figure 39: Middle East & Africa Fertilizer Industry in Africa Revenue Share (%), by Production Analysis 2025 & 2033
- Figure 40: Middle East & Africa Fertilizer Industry in Africa Revenue (Million), by Consumption Analysis 2025 & 2033
- Figure 41: Middle East & Africa Fertilizer Industry in Africa Revenue Share (%), by Consumption Analysis 2025 & 2033
- Figure 42: Middle East & Africa Fertilizer Industry in Africa Revenue (Million), by Import Market Analysis (Value & Volume) 2025 & 2033
- Figure 43: Middle East & Africa Fertilizer Industry in Africa Revenue Share (%), by Import Market Analysis (Value & Volume) 2025 & 2033
- Figure 44: Middle East & Africa Fertilizer Industry in Africa Revenue (Million), by Export Market Analysis (Value & Volume) 2025 & 2033
- Figure 45: Middle East & Africa Fertilizer Industry in Africa Revenue Share (%), by Export Market Analysis (Value & Volume) 2025 & 2033
- Figure 46: Middle East & Africa Fertilizer Industry in Africa Revenue (Million), by Price Trend Analysis 2025 & 2033
- Figure 47: Middle East & Africa Fertilizer Industry in Africa Revenue Share (%), by Price Trend Analysis 2025 & 2033
- Figure 48: Middle East & Africa Fertilizer Industry in Africa Revenue (Million), by Country 2025 & 2033
- Figure 49: Middle East & Africa Fertilizer Industry in Africa Revenue Share (%), by Country 2025 & 2033
- Figure 50: Asia Pacific Fertilizer Industry in Africa Revenue (Million), by Production Analysis 2025 & 2033
- Figure 51: Asia Pacific Fertilizer Industry in Africa Revenue Share (%), by Production Analysis 2025 & 2033
- Figure 52: Asia Pacific Fertilizer Industry in Africa Revenue (Million), by Consumption Analysis 2025 & 2033
- Figure 53: Asia Pacific Fertilizer Industry in Africa Revenue Share (%), by Consumption Analysis 2025 & 2033
- Figure 54: Asia Pacific Fertilizer Industry in Africa Revenue (Million), by Import Market Analysis (Value & Volume) 2025 & 2033
- Figure 55: Asia Pacific Fertilizer Industry in Africa Revenue Share (%), by Import Market Analysis (Value & Volume) 2025 & 2033
- Figure 56: Asia Pacific Fertilizer Industry in Africa Revenue (Million), by Export Market Analysis (Value & Volume) 2025 & 2033
- Figure 57: Asia Pacific Fertilizer Industry in Africa Revenue Share (%), by Export Market Analysis (Value & Volume) 2025 & 2033
- Figure 58: Asia Pacific Fertilizer Industry in Africa Revenue (Million), by Price Trend Analysis 2025 & 2033
- Figure 59: Asia Pacific Fertilizer Industry in Africa Revenue Share (%), by Price Trend Analysis 2025 & 2033
- Figure 60: Asia Pacific Fertilizer Industry in Africa Revenue (Million), by Country 2025 & 2033
- Figure 61: Asia Pacific Fertilizer Industry in Africa Revenue Share (%), by Country 2025 & 2033
List of Tables
- Table 1: Global Fertilizer Industry in Africa Revenue Million Forecast, by Production Analysis 2020 & 2033
- Table 2: Global Fertilizer Industry in Africa Revenue Million Forecast, by Consumption Analysis 2020 & 2033
- Table 3: Global Fertilizer Industry in Africa Revenue Million Forecast, by Import Market Analysis (Value & Volume) 2020 & 2033
- Table 4: Global Fertilizer Industry in Africa Revenue Million Forecast, by Export Market Analysis (Value & Volume) 2020 & 2033
- Table 5: Global Fertilizer Industry in Africa Revenue Million Forecast, by Price Trend Analysis 2020 & 2033
- Table 6: Global Fertilizer Industry in Africa Revenue Million Forecast, by Region 2020 & 2033
- Table 7: Global Fertilizer Industry in Africa Revenue Million Forecast, by Production Analysis 2020 & 2033
- Table 8: Global Fertilizer Industry in Africa Revenue Million Forecast, by Consumption Analysis 2020 & 2033
- Table 9: Global Fertilizer Industry in Africa Revenue Million Forecast, by Import Market Analysis (Value & Volume) 2020 & 2033
- Table 10: Global Fertilizer Industry in Africa Revenue Million Forecast, by Export Market Analysis (Value & Volume) 2020 & 2033
- Table 11: Global Fertilizer Industry in Africa Revenue Million Forecast, by Price Trend Analysis 2020 & 2033
- Table 12: Global Fertilizer Industry in Africa Revenue Million Forecast, by Country 2020 & 2033
- Table 13: United States Fertilizer Industry in Africa Revenue (Million) Forecast, by Application 2020 & 2033
- Table 14: Canada Fertilizer Industry in Africa Revenue (Million) Forecast, by Application 2020 & 2033
- Table 15: Mexico Fertilizer Industry in Africa Revenue (Million) Forecast, by Application 2020 & 2033
- Table 16: Global Fertilizer Industry in Africa Revenue Million Forecast, by Production Analysis 2020 & 2033
- Table 17: Global Fertilizer Industry in Africa Revenue Million Forecast, by Consumption Analysis 2020 & 2033
- Table 18: Global Fertilizer Industry in Africa Revenue Million Forecast, by Import Market Analysis (Value & Volume) 2020 & 2033
- Table 19: Global Fertilizer Industry in Africa Revenue Million Forecast, by Export Market Analysis (Value & Volume) 2020 & 2033
- Table 20: Global Fertilizer Industry in Africa Revenue Million Forecast, by Price Trend Analysis 2020 & 2033
- Table 21: Global Fertilizer Industry in Africa Revenue Million Forecast, by Country 2020 & 2033
- Table 22: Brazil Fertilizer Industry in Africa Revenue (Million) Forecast, by Application 2020 & 2033
- Table 23: Argentina Fertilizer Industry in Africa Revenue (Million) Forecast, by Application 2020 & 2033
- Table 24: Rest of South America Fertilizer Industry in Africa Revenue (Million) Forecast, by Application 2020 & 2033
- Table 25: Global Fertilizer Industry in Africa Revenue Million Forecast, by Production Analysis 2020 & 2033
- Table 26: Global Fertilizer Industry in Africa Revenue Million Forecast, by Consumption Analysis 2020 & 2033
- Table 27: Global Fertilizer Industry in Africa Revenue Million Forecast, by Import Market Analysis (Value & Volume) 2020 & 2033
- Table 28: Global Fertilizer Industry in Africa Revenue Million Forecast, by Export Market Analysis (Value & Volume) 2020 & 2033
- Table 29: Global Fertilizer Industry in Africa Revenue Million Forecast, by Price Trend Analysis 2020 & 2033
- Table 30: Global Fertilizer Industry in Africa Revenue Million Forecast, by Country 2020 & 2033
- Table 31: United Kingdom Fertilizer Industry in Africa Revenue (Million) Forecast, by Application 2020 & 2033
- Table 32: Germany Fertilizer Industry in Africa Revenue (Million) Forecast, by Application 2020 & 2033
- Table 33: France Fertilizer Industry in Africa Revenue (Million) Forecast, by Application 2020 & 2033
- Table 34: Italy Fertilizer Industry in Africa Revenue (Million) Forecast, by Application 2020 & 2033
- Table 35: Spain Fertilizer Industry in Africa Revenue (Million) Forecast, by Application 2020 & 2033
- Table 36: Russia Fertilizer Industry in Africa Revenue (Million) Forecast, by Application 2020 & 2033
- Table 37: Benelux Fertilizer Industry in Africa Revenue (Million) Forecast, by Application 2020 & 2033
- Table 38: Nordics Fertilizer Industry in Africa Revenue (Million) Forecast, by Application 2020 & 2033
- Table 39: Rest of Europe Fertilizer Industry in Africa Revenue (Million) Forecast, by Application 2020 & 2033
- Table 40: Global Fertilizer Industry in Africa Revenue Million Forecast, by Production Analysis 2020 & 2033
- Table 41: Global Fertilizer Industry in Africa Revenue Million Forecast, by Consumption Analysis 2020 & 2033
- Table 42: Global Fertilizer Industry in Africa Revenue Million Forecast, by Import Market Analysis (Value & Volume) 2020 & 2033
- Table 43: Global Fertilizer Industry in Africa Revenue Million Forecast, by Export Market Analysis (Value & Volume) 2020 & 2033
- Table 44: Global Fertilizer Industry in Africa Revenue Million Forecast, by Price Trend Analysis 2020 & 2033
- Table 45: Global Fertilizer Industry in Africa Revenue Million Forecast, by Country 2020 & 2033
- Table 46: Turkey Fertilizer Industry in Africa Revenue (Million) Forecast, by Application 2020 & 2033
- Table 47: Israel Fertilizer Industry in Africa Revenue (Million) Forecast, by Application 2020 & 2033
- Table 48: GCC Fertilizer Industry in Africa Revenue (Million) Forecast, by Application 2020 & 2033
- Table 49: North Africa Fertilizer Industry in Africa Revenue (Million) Forecast, by Application 2020 & 2033
- Table 50: South Africa Fertilizer Industry in Africa Revenue (Million) Forecast, by Application 2020 & 2033
- Table 51: Rest of Middle East & Africa Fertilizer Industry in Africa Revenue (Million) Forecast, by Application 2020 & 2033
- Table 52: Global Fertilizer Industry in Africa Revenue Million Forecast, by Production Analysis 2020 & 2033
- Table 53: Global Fertilizer Industry in Africa Revenue Million Forecast, by Consumption Analysis 2020 & 2033
- Table 54: Global Fertilizer Industry in Africa Revenue Million Forecast, by Import Market Analysis (Value & Volume) 2020 & 2033
- Table 55: Global Fertilizer Industry in Africa Revenue Million Forecast, by Export Market Analysis (Value & Volume) 2020 & 2033
- Table 56: Global Fertilizer Industry in Africa Revenue Million Forecast, by Price Trend Analysis 2020 & 2033
- Table 57: Global Fertilizer Industry in Africa Revenue Million Forecast, by Country 2020 & 2033
- Table 58: China Fertilizer Industry in Africa Revenue (Million) Forecast, by Application 2020 & 2033
- Table 59: India Fertilizer Industry in Africa Revenue (Million) Forecast, by Application 2020 & 2033
- Table 60: Japan Fertilizer Industry in Africa Revenue (Million) Forecast, by Application 2020 & 2033
- Table 61: South Korea Fertilizer Industry in Africa Revenue (Million) Forecast, by Application 2020 & 2033
- Table 62: ASEAN Fertilizer Industry in Africa Revenue (Million) Forecast, by Application 2020 & 2033
- Table 63: Oceania Fertilizer Industry in Africa Revenue (Million) Forecast, by Application 2020 & 2033
- Table 64: Rest of Asia Pacific Fertilizer Industry in Africa Revenue (Million) Forecast, by Application 2020 & 2033
Frequently Asked Questions
1. What is the projected Compound Annual Growth Rate (CAGR) of the Fertilizer Industry in Africa?
The projected CAGR is approximately 9.02%.
2. Which companies are prominent players in the Fertilizer Industry in Africa?
Key companies in the market include Haifa Group, Foskor, Gavilon South Africa (MacroSource LLC), K+S Aktiengesellschaft, Yara International AS, UPL Limited, ICL Group Ltd, Kynoch Fertilizer.
3. What are the main segments of the Fertilizer Industry in Africa?
The market segments include Production Analysis, Consumption Analysis, Import Market Analysis (Value & Volume), Export Market Analysis (Value & Volume), Price Trend Analysis.
4. Can you provide details about the market size?
The market size is estimated to be USD XX Million as of 2022.
5. What are some drivers contributing to market growth?
Need for Custom Product Development; Use of CROs for Regulatory Services.
6. What are the notable trends driving market growth?
OTHER KEY INDUSTRY TRENDS COVERED IN THE REPORT.
7. Are there any restraints impacting market growth?
Data and Cyber Security Concerns; Lack of Experts and Professionals in this Industry.
8. Can you provide examples of recent developments in the market?
April 2023: K+S has acquired a 75% share of the fertilizer business of South African trading company Industrial Commodities Holdings (Pty) Ltd (ICH). In addition to expanding the core business, K+S is strengthening its operations in southern and eastern Africa as a result of this acquisition. The newly acquired fertilizer business in the future to be operated in a joint venture, under the name of FertivPty Ltd.January 2023: ICL has entered into a strategic partnership agreement with General Mills, in which it will be the supplier of strategic specialty phosphate solutions to General Mills. The long-term agreement will also focus on international expansion.May 2022: ICL launched three new NPK formulations of Solinure, a product with increased trace elements to optimize yields.
9. What pricing options are available for accessing the report?
Pricing options include single-user, multi-user, and enterprise licenses priced at USD 3800, USD 4500, and USD 5800 respectively.
10. Is the market size provided in terms of value or volume?
The market size is provided in terms of value, measured in Million.
11. Are there any specific market keywords associated with the report?
Yes, the market keyword associated with the report is "Fertilizer Industry in Africa," which aids in identifying and referencing the specific market segment covered.
12. How do I determine which pricing option suits my needs best?
The pricing options vary based on user requirements and access needs. Individual users may opt for single-user licenses, while businesses requiring broader access may choose multi-user or enterprise licenses for cost-effective access to the report.
13. Are there any additional resources or data provided in the Fertilizer Industry in Africa report?
While the report offers comprehensive insights, it's advisable to review the specific contents or supplementary materials provided to ascertain if additional resources or data are available.
14. How can I stay updated on further developments or reports in the Fertilizer Industry in Africa?
To stay informed about further developments, trends, and reports in the Fertilizer Industry in Africa, consider subscribing to industry newsletters, following relevant companies and organizations, or regularly checking reputable industry news sources and publications.
Methodology
Step 1 - Identification of Relevant Samples Size from Population Database


Step 2 - Approaches for Defining Global Market Size (Value, Volume* & Price*)

Note*: In applicable scenarios
Step 3 - Data Sources
Primary Research
- Web Analytics
- Survey Reports
- Research Institute
- Latest Research Reports
- Opinion Leaders
Secondary Research
- Annual Reports
- White Paper
- Latest Press Release
- Industry Association
- Paid Database
- Investor Presentations

Step 4 - Data Triangulation
Involves using different sources of information in order to increase the validity of a study
These sources are likely to be stakeholders in a program - participants, other researchers, program staff, other community members, and so on.
Then we put all data in single framework & apply various statistical tools to find out the dynamic on the market.
During the analysis stage, feedback from the stakeholder groups would be compared to determine areas of agreement as well as areas of divergence