

Key Insights
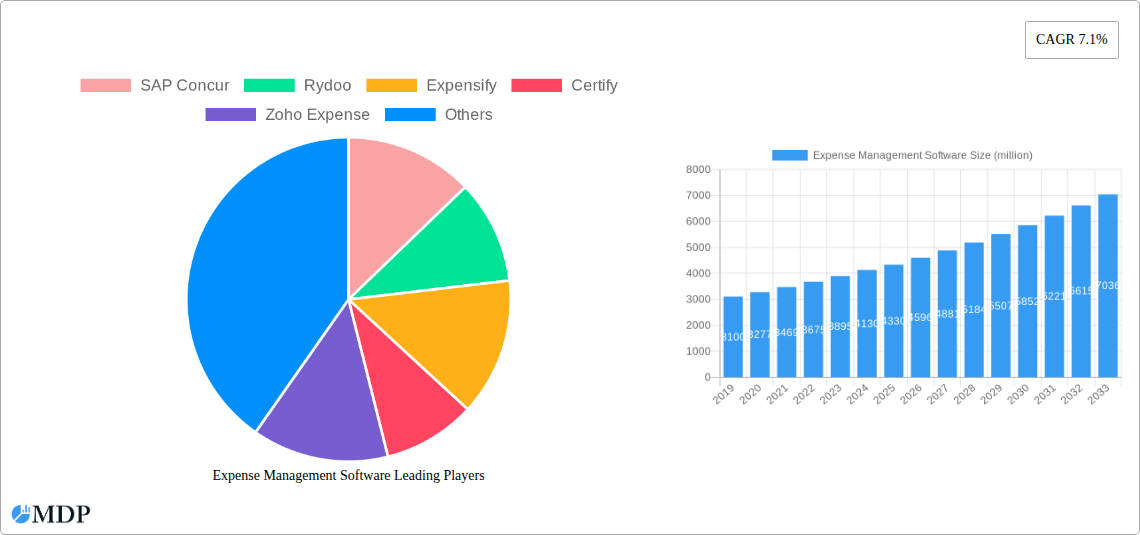
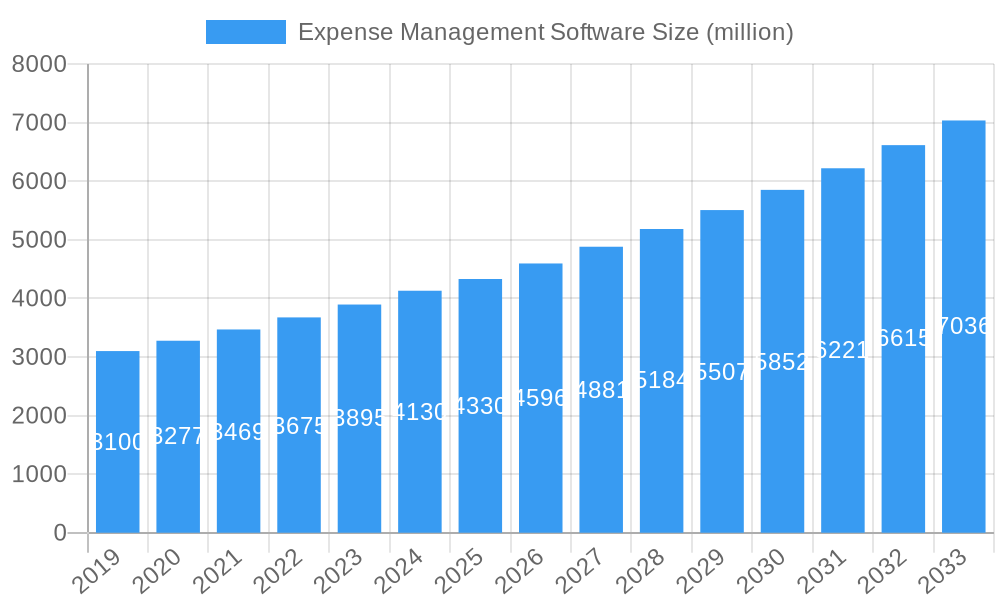
The global Expense Management Software market is poised for robust growth, projected to reach a significant valuation by 2025, driven by an estimated 7.1% Compound Annual Growth Rate (CAGR). This expansion is fueled by the increasing need for businesses of all sizes to streamline financial operations, enhance compliance, and gain better visibility into spending patterns. The adoption of cloud-based solutions is a dominant trend, offering scalability, accessibility, and cost-effectiveness, especially for Small and Medium-sized Enterprises (SMEs) seeking to optimize their resource allocation. Large enterprises, while already significant users, are increasingly looking for sophisticated functionalities to manage complex travel and expense policies, integrate with existing ERP systems, and automate tedious manual processes. The shift towards digital transformation across industries is a primary catalyst, encouraging organizations to invest in software that improves efficiency, reduces errors, and provides real-time financial insights.
Expense Management Software Market Size (In Billion)
Key drivers for this market surge include the growing regulatory landscape mandating stringent financial reporting and the demand for enhanced employee productivity through simplified expense reporting and reimbursement processes. While the market benefits from widespread digital adoption, potential restraints might arise from the initial implementation costs and the need for adequate employee training, particularly for smaller businesses with limited IT resources. However, the long-term benefits of improved financial control, reduced fraud, and data-driven decision-making are compelling many organizations to overcome these initial hurdles. The competitive landscape is dynamic, featuring a mix of established players and innovative startups, all vying to capture market share by offering feature-rich, user-friendly, and integrated expense management solutions. The continuous evolution of technology, including AI and machine learning, is expected to further enhance the capabilities of these platforms, offering predictive analytics and even more automated expense management.
Expense Management Software Company Market Share
The global expense management software market is characterized by a dynamic interplay of innovation, consolidation, and evolving end-user demands. Our comprehensive report delves deep into the market's concentration, identifying key players and their respective market shares, projected to reach over $50,000 million by 2033. Innovation drivers, fueled by advancements in AI, machine learning, and mobile technology, are continuously pushing the boundaries of efficiency and automation in expense reporting and reimbursement processes. Regulatory frameworks, particularly around data privacy and financial compliance, are shaping product development and market entry strategies. Product substitutes, ranging from manual spreadsheets to integrated ERP systems, are being increasingly outpaced by the specialized functionalities and cost-effectiveness of dedicated expense management solutions. End-user trends, such as the demand for seamless user experiences, real-time insights, and integrated travel and expense management, are paramount. Mergers and acquisitions (M&A) activities are a significant indicator of market maturity and strategic positioning, with an estimated over 50 major deals recorded during the historical period (2019-2024), consolidating market share and expanding product portfolios.
Expense Management Software Industry Trends & Analysis: Navigating the Growth Trajectory
The expense management software industry is poised for robust growth, projected to witness a Compound Annual Growth Rate (CAGR) of approximately 12.5% during the forecast period (2025-2033). This expansion is driven by a confluence of factors, including the increasing adoption of cloud-based solutions, the growing need for automated financial processes, and the rising complexity of business travel and expense policies. Technological disruptions are at the forefront, with AI-powered receipt scanning, intelligent policy enforcement, and predictive analytics revolutionizing how organizations manage their expenditures. Consumer preferences are leaning towards user-friendly, mobile-first platforms that offer real-time visibility and instant reimbursement capabilities, thereby enhancing employee satisfaction and reducing administrative burden. Competitive dynamics are intensifying, with established players like SAP Concur, Rydoo, and Expensify constantly innovating to stay ahead, while new entrants like Pleo and Happay are carving out niches with specialized offerings. Market penetration is steadily increasing across all business segments, as organizations recognize the significant ROI achievable through efficient expense management. The shift from traditional, manual methods to sophisticated, digital solutions is a defining trend, leading to an estimated market value surpassing $50,000 million by the end of the study period.
Leading Markets & Segments in Expense Management Software: Global Dominance and Targeted Solutions
The global expense management software market is demonstrating significant dominance in North America, driven by its advanced technological infrastructure, strong regulatory environment, and high concentration of large enterprises actively seeking efficiency gains. Within this region, the Large Enterprise segment stands out, accounting for over 60% of the market share. This dominance is fueled by the immense volume of expenses these organizations manage, the stringent compliance requirements they face, and their capacity to invest in comprehensive, integrated solutions. Economic policies that encourage digital transformation and innovation further bolster this segment's growth.
The Cloud Based type segment also holds a commanding position, projected to capture over 75% of the market by 2033. This widespread adoption is attributed to the scalability, accessibility, and cost-effectiveness of cloud solutions, which cater to businesses of all sizes. Key drivers for cloud-based adoption include:
- Enhanced Accessibility: Employees can submit expenses from anywhere, anytime, on any device.
- Scalability and Flexibility: Businesses can easily scale their usage up or down based on their evolving needs.
- Reduced IT Burden: Cloud providers manage infrastructure, updates, and maintenance, lowering operational costs.
- Real-time Data Synchronization: Instantaneous updates ensure accurate reporting and faster approvals.
While SMEs represent a growing segment, particularly in emerging economies, large enterprises continue to set the pace for adoption and feature innovation. The demand for sophisticated analytics, robust integration capabilities with existing ERP and HR systems, and advanced fraud detection mechanisms are key differentiating factors for solutions targeting this segment.
Expense Management Software Product Developments: Innovating for Efficiency and Insight
Product developments in expense management software are rapidly advancing, driven by the imperative for greater automation, enhanced user experience, and deeper analytical capabilities. Innovations are focusing on AI-powered receipt processing that accurately extracts data with minimal human intervention, intelligent policy enforcement engines that proactively flag non-compliant expenses, and seamless integrations with travel booking platforms and corporate credit cards. Competitive advantages are being built around intuitive mobile applications, real-time spend visibility dashboards, and robust analytics that provide actionable insights into spending patterns. The integration of machine learning for predictive budgeting and fraud detection is also a key area of focus, ensuring that expense management software not only streamlines processes but also contributes strategically to financial governance.
Key Drivers of Expense Management Software Growth: Fueling the Market Expansion
The growth of the expense management software market is propelled by several key drivers. Technologically, the proliferation of mobile devices and the advancements in AI and machine learning are enabling more efficient and accurate expense capture and processing. Economically, businesses are increasingly recognizing the significant cost savings and productivity gains achievable through automated expense management, leading to a strong ROI justification for software adoption. Regulatory factors, such as evolving compliance requirements and the need for transparent financial reporting, also mandate the implementation of robust expense management solutions. The increasing trend of remote and hybrid workforces further necessitates digital tools that facilitate seamless expense reporting regardless of an employee's location.
Challenges in the Expense Management Software Market: Navigating Obstacles to Adoption
Despite its robust growth, the expense management software market faces certain challenges. Regulatory hurdles, particularly in ensuring data privacy and compliance across diverse international jurisdictions, can be complex to navigate. Supply chain issues, while less direct, can impact the broader economic climate, influencing IT budget allocations for software investments. Competitive pressures are intense, with a crowded market requiring continuous innovation and differentiation. Furthermore, a significant challenge remains the inertia of traditional, manual processes within some organizations, requiring substantial change management efforts to achieve widespread adoption and realize the full benefits of expense management software. Overcoming these barriers requires clear communication of value proposition and tailored solutions.
Emerging Opportunities in Expense Management Software: Charting the Path to Future Growth
Emerging opportunities in the expense management software market are abundant, fueled by ongoing technological breakthroughs and evolving business needs. The integration of advanced AI and machine learning offers the potential for predictive analytics that can forecast spending trends and optimize budgets, moving beyond reactive expense management. Strategic partnerships between expense management providers and financial institutions, travel management companies, and HR software vendors are creating more comprehensive and integrated solutions, enhancing value for end-users. Furthermore, market expansion into emerging economies, where digital transformation is gaining momentum, presents significant untapped potential. The increasing demand for sustainable travel and expense reporting also opens new avenues for specialized features and reporting capabilities.
Leading Players in the Expense Management Software Sector
- SAP Concur
- Rydoo
- Expensify
- Certify
- Zoho Expense
- Abacus
- Paylocity
- BigTime
- Paycom
- Workday
- Nexonia
- Chrome River EXPENSE
- Pleo
- Replicon
- Paychex Flex
- Avaza
- MileIQ
- Deem
- TravelBank
- Timesheets.com
- NetSuite's OpenAir
- Happay
Key Milestones in Expense Management Software Industry
- 2019: Increased adoption of AI for automated receipt data extraction, significantly improving accuracy and reducing manual input.
- 2020: Surge in demand for cloud-based solutions and mobile-first platforms due to the global shift towards remote work.
- 2021: Major players like SAP Concur and Expensify enhance their platforms with advanced analytics and real-time reporting features.
- 2022: Growing focus on integrating expense management with broader financial planning and analysis (FP&A) tools.
- 2023: Emergence of solutions focusing on sustainability in business travel and expense reporting.
- 2024: Increased M&A activity as larger companies acquire innovative startups to expand their feature sets and market reach.
Strategic Outlook for Expense Management Software Market
The strategic outlook for the expense management software market is exceptionally bright, driven by continuous technological innovation and the persistent need for operational efficiency. Future growth accelerators will include the deeper integration of AI for predictive analytics and intelligent automation, offering businesses not just data, but actionable insights to control spending and optimize financial processes. The expansion of integrated travel and expense management platforms, providing a seamless end-to-end experience for employees and administrators alike, will be a key differentiator. Furthermore, the increasing adoption of these solutions in emerging markets, coupled with a growing emphasis on compliance and fraud prevention, will solidify the market's upward trajectory, ensuring sustained demand and innovation.
Expense Management Software Segmentation
-
1. Application
- 1.1. Large Enterprises
- 1.2. SMEs
-
2. Types
- 2.1. Cloud Based
- 2.2. Web Based
Expense Management Software Segmentation By Geography
-
1. North America
- 1.1. United States
- 1.2. Canada
- 1.3. Mexico
-
2. South America
- 2.1. Brazil
- 2.2. Argentina
- 2.3. Rest of South America
-
3. Europe
- 3.1. United Kingdom
- 3.2. Germany
- 3.3. France
- 3.4. Italy
- 3.5. Spain
- 3.6. Russia
- 3.7. Benelux
- 3.8. Nordics
- 3.9. Rest of Europe
-
4. Middle East & Africa
- 4.1. Turkey
- 4.2. Israel
- 4.3. GCC
- 4.4. North Africa
- 4.5. South Africa
- 4.6. Rest of Middle East & Africa
-
5. Asia Pacific
- 5.1. China
- 5.2. India
- 5.3. Japan
- 5.4. South Korea
- 5.5. ASEAN
- 5.6. Oceania
- 5.7. Rest of Asia Pacific
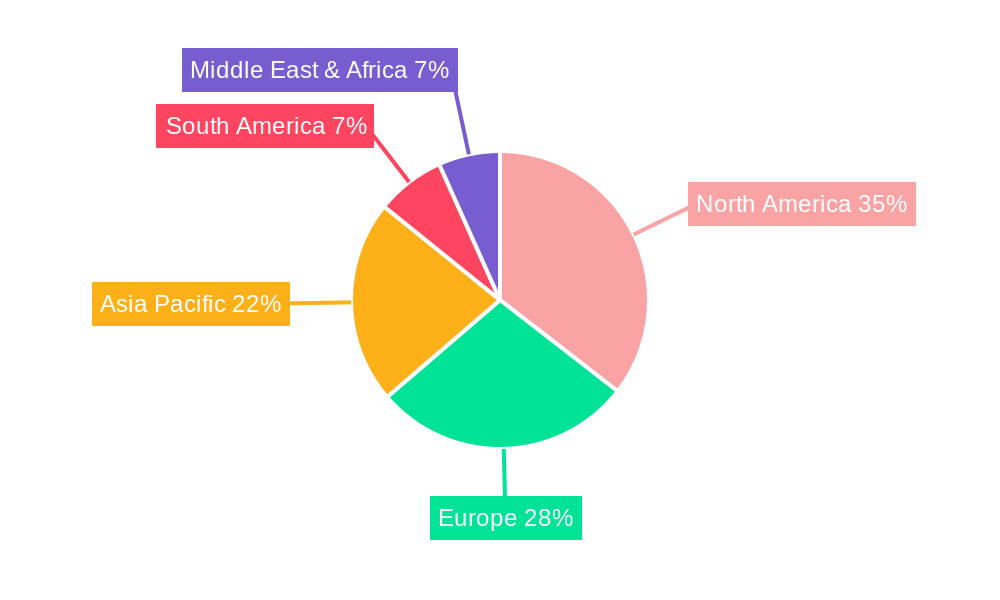
Expense Management Software Regional Market Share
Geographic Coverage of Expense Management Software
Expense Management Software REPORT HIGHLIGHTS
| Aspects | Details |
|---|---|
| Study Period | 2020-2034 |
| Base Year | 2025 |
| Estimated Year | 2026 |
| Forecast Period | 2026-2034 |
| Historical Period | 2020-2025 |
| Growth Rate | CAGR of 7.1% from 2020-2034 |
| Segmentation |
|
Table of Contents
- 1. Introduction
- 1.1. Research Scope
- 1.2. Market Segmentation
- 1.3. Research Objective
- 1.4. Definitions and Assumptions
- 2. Executive Summary
- 2.1. Market Snapshot
- 3. Market Dynamics
- 3.1. Market Drivers
- 3.2. Market Restrains
- 3.3. Market Trends
- 3.4. Market Opportunities
- 4. Market Factor Analysis
- 4.1. Porters Five Forces
- 4.1.1. Bargaining Power of Suppliers
- 4.1.2. Bargaining Power of Buyers
- 4.1.3. Threat of New Entrants
- 4.1.4. Threat of Substitutes
- 4.1.5. Competitive Rivalry
- 4.2. PESTEL analysis
- 4.3. BCG Analysis
- 4.3.1. Stars (High Growth, High Market Share)
- 4.3.2. Cash Cows (Low Growth, High Market Share)
- 4.3.3. Question Mark (High Growth, Low Market Share)
- 4.3.4. Dogs (Low Growth, Low Market Share)
- 4.4. Ansoff Matrix Analysis
- 4.5. Supply Chain Analysis
- 4.6. Regulatory Landscape
- 4.7. Current Market Potential and Opportunity Assessment (TAM–SAM–SOM Framework)
- 4.8. MDP Analyst Note
- 4.1. Porters Five Forces
- 5. Market Analysis, Insights and Forecast 2021-2033
- 5.1. Market Analysis, Insights and Forecast - by Application
- 5.1.1. Large Enterprises
- 5.1.2. SMEs
- 5.2. Market Analysis, Insights and Forecast - by Types
- 5.2.1. Cloud Based
- 5.2.2. Web Based
- 5.3. Market Analysis, Insights and Forecast - by Region
- 5.3.1. North America
- 5.3.2. South America
- 5.3.3. Europe
- 5.3.4. Middle East & Africa
- 5.3.5. Asia Pacific
- 5.1. Market Analysis, Insights and Forecast - by Application
- 6. Global Expense Management Software Analysis, Insights and Forecast, 2021-2033
- 6.1. Market Analysis, Insights and Forecast - by Application
- 6.1.1. Large Enterprises
- 6.1.2. SMEs
- 6.2. Market Analysis, Insights and Forecast - by Types
- 6.2.1. Cloud Based
- 6.2.2. Web Based
- 6.1. Market Analysis, Insights and Forecast - by Application
- 7. North America Expense Management Software Analysis, Insights and Forecast, 2020-2032
- 7.1. Market Analysis, Insights and Forecast - by Application
- 7.1.1. Large Enterprises
- 7.1.2. SMEs
- 7.2. Market Analysis, Insights and Forecast - by Types
- 7.2.1. Cloud Based
- 7.2.2. Web Based
- 7.1. Market Analysis, Insights and Forecast - by Application
- 8. South America Expense Management Software Analysis, Insights and Forecast, 2020-2032
- 8.1. Market Analysis, Insights and Forecast - by Application
- 8.1.1. Large Enterprises
- 8.1.2. SMEs
- 8.2. Market Analysis, Insights and Forecast - by Types
- 8.2.1. Cloud Based
- 8.2.2. Web Based
- 8.1. Market Analysis, Insights and Forecast - by Application
- 9. Europe Expense Management Software Analysis, Insights and Forecast, 2020-2032
- 9.1. Market Analysis, Insights and Forecast - by Application
- 9.1.1. Large Enterprises
- 9.1.2. SMEs
- 9.2. Market Analysis, Insights and Forecast - by Types
- 9.2.1. Cloud Based
- 9.2.2. Web Based
- 9.1. Market Analysis, Insights and Forecast - by Application
- 10. Middle East & Africa Expense Management Software Analysis, Insights and Forecast, 2020-2032
- 10.1. Market Analysis, Insights and Forecast - by Application
- 10.1.1. Large Enterprises
- 10.1.2. SMEs
- 10.2. Market Analysis, Insights and Forecast - by Types
- 10.2.1. Cloud Based
- 10.2.2. Web Based
- 10.1. Market Analysis, Insights and Forecast - by Application
- 11. Asia Pacific Expense Management Software Analysis, Insights and Forecast, 2020-2032
- 11.1. Market Analysis, Insights and Forecast - by Application
- 11.1.1. Large Enterprises
- 11.1.2. SMEs
- 11.2. Market Analysis, Insights and Forecast - by Types
- 11.2.1. Cloud Based
- 11.2.2. Web Based
- 11.1. Market Analysis, Insights and Forecast - by Application
- 12. Competitive Analysis
- 12.1. Company Profiles
- 12.1.1 SAP Concur
- 12.1.1.1. Company Overview
- 12.1.1.2. Products
- 12.1.1.3. Company Financials
- 12.1.1.4. SWOT Analysis
- 12.1.2 Rydoo
- 12.1.2.1. Company Overview
- 12.1.2.2. Products
- 12.1.2.3. Company Financials
- 12.1.2.4. SWOT Analysis
- 12.1.3 Expensify
- 12.1.3.1. Company Overview
- 12.1.3.2. Products
- 12.1.3.3. Company Financials
- 12.1.3.4. SWOT Analysis
- 12.1.4 Certify
- 12.1.4.1. Company Overview
- 12.1.4.2. Products
- 12.1.4.3. Company Financials
- 12.1.4.4. SWOT Analysis
- 12.1.5 Zoho Expense
- 12.1.5.1. Company Overview
- 12.1.5.2. Products
- 12.1.5.3. Company Financials
- 12.1.5.4. SWOT Analysis
- 12.1.6 Abacus
- 12.1.6.1. Company Overview
- 12.1.6.2. Products
- 12.1.6.3. Company Financials
- 12.1.6.4. SWOT Analysis
- 12.1.7 Paylocity
- 12.1.7.1. Company Overview
- 12.1.7.2. Products
- 12.1.7.3. Company Financials
- 12.1.7.4. SWOT Analysis
- 12.1.8 BigTime
- 12.1.8.1. Company Overview
- 12.1.8.2. Products
- 12.1.8.3. Company Financials
- 12.1.8.4. SWOT Analysis
- 12.1.9 Paycom
- 12.1.9.1. Company Overview
- 12.1.9.2. Products
- 12.1.9.3. Company Financials
- 12.1.9.4. SWOT Analysis
- 12.1.10 Workday
- 12.1.10.1. Company Overview
- 12.1.10.2. Products
- 12.1.10.3. Company Financials
- 12.1.10.4. SWOT Analysis
- 12.1.11 Nexonia
- 12.1.11.1. Company Overview
- 12.1.11.2. Products
- 12.1.11.3. Company Financials
- 12.1.11.4. SWOT Analysis
- 12.1.12 Chrome River EXPENSE
- 12.1.12.1. Company Overview
- 12.1.12.2. Products
- 12.1.12.3. Company Financials
- 12.1.12.4. SWOT Analysis
- 12.1.13 Pleo
- 12.1.13.1. Company Overview
- 12.1.13.2. Products
- 12.1.13.3. Company Financials
- 12.1.13.4. SWOT Analysis
- 12.1.14 Replicon
- 12.1.14.1. Company Overview
- 12.1.14.2. Products
- 12.1.14.3. Company Financials
- 12.1.14.4. SWOT Analysis
- 12.1.15 Paychex Flex
- 12.1.15.1. Company Overview
- 12.1.15.2. Products
- 12.1.15.3. Company Financials
- 12.1.15.4. SWOT Analysis
- 12.1.16 Avaza
- 12.1.16.1. Company Overview
- 12.1.16.2. Products
- 12.1.16.3. Company Financials
- 12.1.16.4. SWOT Analysis
- 12.1.17 MileIQ
- 12.1.17.1. Company Overview
- 12.1.17.2. Products
- 12.1.17.3. Company Financials
- 12.1.17.4. SWOT Analysis
- 12.1.18 Deem
- 12.1.18.1. Company Overview
- 12.1.18.2. Products
- 12.1.18.3. Company Financials
- 12.1.18.4. SWOT Analysis
- 12.1.19 TravelBank
- 12.1.19.1. Company Overview
- 12.1.19.2. Products
- 12.1.19.3. Company Financials
- 12.1.19.4. SWOT Analysis
- 12.1.20 Timesheets.com
- 12.1.20.1. Company Overview
- 12.1.20.2. Products
- 12.1.20.3. Company Financials
- 12.1.20.4. SWOT Analysis
- 12.1.21 NetSuite's OpenAir
- 12.1.21.1. Company Overview
- 12.1.21.2. Products
- 12.1.21.3. Company Financials
- 12.1.21.4. SWOT Analysis
- 12.1.22 Happay
- 12.1.22.1. Company Overview
- 12.1.22.2. Products
- 12.1.22.3. Company Financials
- 12.1.22.4. SWOT Analysis
- 12.1.1 SAP Concur
- 12.2. Market Entropy
- 12.2.1 Company's Key Areas Served
- 12.2.2 Recent Developments
- 12.3. Company Market Share Analysis 2025
- 12.3.1 Top 5 Companies Market Share Analysis
- 12.3.2 Top 3 Companies Market Share Analysis
- 12.4. List of Potential Customers
- 13. Research Methodology
List of Figures
- Figure 1: Global Expense Management Software Revenue Breakdown (million, %) by Region 2025 & 2033
- Figure 2: North America Expense Management Software Revenue (million), by Application 2025 & 2033
- Figure 3: North America Expense Management Software Revenue Share (%), by Application 2025 & 2033
- Figure 4: North America Expense Management Software Revenue (million), by Types 2025 & 2033
- Figure 5: North America Expense Management Software Revenue Share (%), by Types 2025 & 2033
- Figure 6: North America Expense Management Software Revenue (million), by Country 2025 & 2033
- Figure 7: North America Expense Management Software Revenue Share (%), by Country 2025 & 2033
- Figure 8: South America Expense Management Software Revenue (million), by Application 2025 & 2033
- Figure 9: South America Expense Management Software Revenue Share (%), by Application 2025 & 2033
- Figure 10: South America Expense Management Software Revenue (million), by Types 2025 & 2033
- Figure 11: South America Expense Management Software Revenue Share (%), by Types 2025 & 2033
- Figure 12: South America Expense Management Software Revenue (million), by Country 2025 & 2033
- Figure 13: South America Expense Management Software Revenue Share (%), by Country 2025 & 2033
- Figure 14: Europe Expense Management Software Revenue (million), by Application 2025 & 2033
- Figure 15: Europe Expense Management Software Revenue Share (%), by Application 2025 & 2033
- Figure 16: Europe Expense Management Software Revenue (million), by Types 2025 & 2033
- Figure 17: Europe Expense Management Software Revenue Share (%), by Types 2025 & 2033
- Figure 18: Europe Expense Management Software Revenue (million), by Country 2025 & 2033
- Figure 19: Europe Expense Management Software Revenue Share (%), by Country 2025 & 2033
- Figure 20: Middle East & Africa Expense Management Software Revenue (million), by Application 2025 & 2033
- Figure 21: Middle East & Africa Expense Management Software Revenue Share (%), by Application 2025 & 2033
- Figure 22: Middle East & Africa Expense Management Software Revenue (million), by Types 2025 & 2033
- Figure 23: Middle East & Africa Expense Management Software Revenue Share (%), by Types 2025 & 2033
- Figure 24: Middle East & Africa Expense Management Software Revenue (million), by Country 2025 & 2033
- Figure 25: Middle East & Africa Expense Management Software Revenue Share (%), by Country 2025 & 2033
- Figure 26: Asia Pacific Expense Management Software Revenue (million), by Application 2025 & 2033
- Figure 27: Asia Pacific Expense Management Software Revenue Share (%), by Application 2025 & 2033
- Figure 28: Asia Pacific Expense Management Software Revenue (million), by Types 2025 & 2033
- Figure 29: Asia Pacific Expense Management Software Revenue Share (%), by Types 2025 & 2033
- Figure 30: Asia Pacific Expense Management Software Revenue (million), by Country 2025 & 2033
- Figure 31: Asia Pacific Expense Management Software Revenue Share (%), by Country 2025 & 2033
List of Tables
- Table 1: Global Expense Management Software Revenue million Forecast, by Application 2020 & 2033
- Table 2: Global Expense Management Software Revenue million Forecast, by Types 2020 & 2033
- Table 3: Global Expense Management Software Revenue million Forecast, by Region 2020 & 2033
- Table 4: Global Expense Management Software Revenue million Forecast, by Application 2020 & 2033
- Table 5: Global Expense Management Software Revenue million Forecast, by Types 2020 & 2033
- Table 6: Global Expense Management Software Revenue million Forecast, by Country 2020 & 2033
- Table 7: United States Expense Management Software Revenue (million) Forecast, by Application 2020 & 2033
- Table 8: Canada Expense Management Software Revenue (million) Forecast, by Application 2020 & 2033
- Table 9: Mexico Expense Management Software Revenue (million) Forecast, by Application 2020 & 2033
- Table 10: Global Expense Management Software Revenue million Forecast, by Application 2020 & 2033
- Table 11: Global Expense Management Software Revenue million Forecast, by Types 2020 & 2033
- Table 12: Global Expense Management Software Revenue million Forecast, by Country 2020 & 2033
- Table 13: Brazil Expense Management Software Revenue (million) Forecast, by Application 2020 & 2033
- Table 14: Argentina Expense Management Software Revenue (million) Forecast, by Application 2020 & 2033
- Table 15: Rest of South America Expense Management Software Revenue (million) Forecast, by Application 2020 & 2033
- Table 16: Global Expense Management Software Revenue million Forecast, by Application 2020 & 2033
- Table 17: Global Expense Management Software Revenue million Forecast, by Types 2020 & 2033
- Table 18: Global Expense Management Software Revenue million Forecast, by Country 2020 & 2033
- Table 19: United Kingdom Expense Management Software Revenue (million) Forecast, by Application 2020 & 2033
- Table 20: Germany Expense Management Software Revenue (million) Forecast, by Application 2020 & 2033
- Table 21: France Expense Management Software Revenue (million) Forecast, by Application 2020 & 2033
- Table 22: Italy Expense Management Software Revenue (million) Forecast, by Application 2020 & 2033
- Table 23: Spain Expense Management Software Revenue (million) Forecast, by Application 2020 & 2033
- Table 24: Russia Expense Management Software Revenue (million) Forecast, by Application 2020 & 2033
- Table 25: Benelux Expense Management Software Revenue (million) Forecast, by Application 2020 & 2033
- Table 26: Nordics Expense Management Software Revenue (million) Forecast, by Application 2020 & 2033
- Table 27: Rest of Europe Expense Management Software Revenue (million) Forecast, by Application 2020 & 2033
- Table 28: Global Expense Management Software Revenue million Forecast, by Application 2020 & 2033
- Table 29: Global Expense Management Software Revenue million Forecast, by Types 2020 & 2033
- Table 30: Global Expense Management Software Revenue million Forecast, by Country 2020 & 2033
- Table 31: Turkey Expense Management Software Revenue (million) Forecast, by Application 2020 & 2033
- Table 32: Israel Expense Management Software Revenue (million) Forecast, by Application 2020 & 2033
- Table 33: GCC Expense Management Software Revenue (million) Forecast, by Application 2020 & 2033
- Table 34: North Africa Expense Management Software Revenue (million) Forecast, by Application 2020 & 2033
- Table 35: South Africa Expense Management Software Revenue (million) Forecast, by Application 2020 & 2033
- Table 36: Rest of Middle East & Africa Expense Management Software Revenue (million) Forecast, by Application 2020 & 2033
- Table 37: Global Expense Management Software Revenue million Forecast, by Application 2020 & 2033
- Table 38: Global Expense Management Software Revenue million Forecast, by Types 2020 & 2033
- Table 39: Global Expense Management Software Revenue million Forecast, by Country 2020 & 2033
- Table 40: China Expense Management Software Revenue (million) Forecast, by Application 2020 & 2033
- Table 41: India Expense Management Software Revenue (million) Forecast, by Application 2020 & 2033
- Table 42: Japan Expense Management Software Revenue (million) Forecast, by Application 2020 & 2033
- Table 43: South Korea Expense Management Software Revenue (million) Forecast, by Application 2020 & 2033
- Table 44: ASEAN Expense Management Software Revenue (million) Forecast, by Application 2020 & 2033
- Table 45: Oceania Expense Management Software Revenue (million) Forecast, by Application 2020 & 2033
- Table 46: Rest of Asia Pacific Expense Management Software Revenue (million) Forecast, by Application 2020 & 2033
Frequently Asked Questions
1. What is the projected Compound Annual Growth Rate (CAGR) of the Expense Management Software?
The projected CAGR is approximately 7.1%.
2. Which companies are prominent players in the Expense Management Software?
Key companies in the market include SAP Concur, Rydoo, Expensify, Certify, Zoho Expense, Abacus, Paylocity, BigTime, Paycom, Workday, Nexonia, Chrome River EXPENSE, Pleo, Replicon, Paychex Flex, Avaza, MileIQ, Deem, TravelBank, Timesheets.com, NetSuite's OpenAir, Happay.
3. What are the main segments of the Expense Management Software?
The market segments include Application, Types.
4. Can you provide details about the market size?
The market size is estimated to be USD 4330 million as of 2022.
5. What are some drivers contributing to market growth?
N/A
6. What are the notable trends driving market growth?
N/A
7. Are there any restraints impacting market growth?
N/A
8. Can you provide examples of recent developments in the market?
N/A
9. What pricing options are available for accessing the report?
Pricing options include single-user, multi-user, and enterprise licenses priced at USD 2900.00, USD 4350.00, and USD 5800.00 respectively.
10. Is the market size provided in terms of value or volume?
The market size is provided in terms of value, measured in million.
11. Are there any specific market keywords associated with the report?
Yes, the market keyword associated with the report is "Expense Management Software," which aids in identifying and referencing the specific market segment covered.
12. How do I determine which pricing option suits my needs best?
The pricing options vary based on user requirements and access needs. Individual users may opt for single-user licenses, while businesses requiring broader access may choose multi-user or enterprise licenses for cost-effective access to the report.
13. Are there any additional resources or data provided in the Expense Management Software report?
While the report offers comprehensive insights, it's advisable to review the specific contents or supplementary materials provided to ascertain if additional resources or data are available.
14. How can I stay updated on further developments or reports in the Expense Management Software?
To stay informed about further developments, trends, and reports in the Expense Management Software, consider subscribing to industry newsletters, following relevant companies and organizations, or regularly checking reputable industry news sources and publications.
Methodology
Step 1 - Identification of Relevant Samples Size from Population Database


Step 2 - Approaches for Defining Global Market Size (Value, Volume* & Price*)

Note*: In applicable scenarios
Step 3 - Data Sources
Primary Research
- Web Analytics
- Survey Reports
- Research Institute
- Latest Research Reports
- Opinion Leaders
Secondary Research
- Annual Reports
- White Paper
- Latest Press Release
- Industry Association
- Paid Database
- Investor Presentations

Step 4 - Data Triangulation
Involves using different sources of information in order to increase the validity of a study
These sources are likely to be stakeholders in a program - participants, other researchers, program staff, other community members, and so on.
Then we put all data in single framework & apply various statistical tools to find out the dynamic on the market.
During the analysis stage, feedback from the stakeholder groups would be compared to determine areas of agreement as well as areas of divergence