

Key Insights
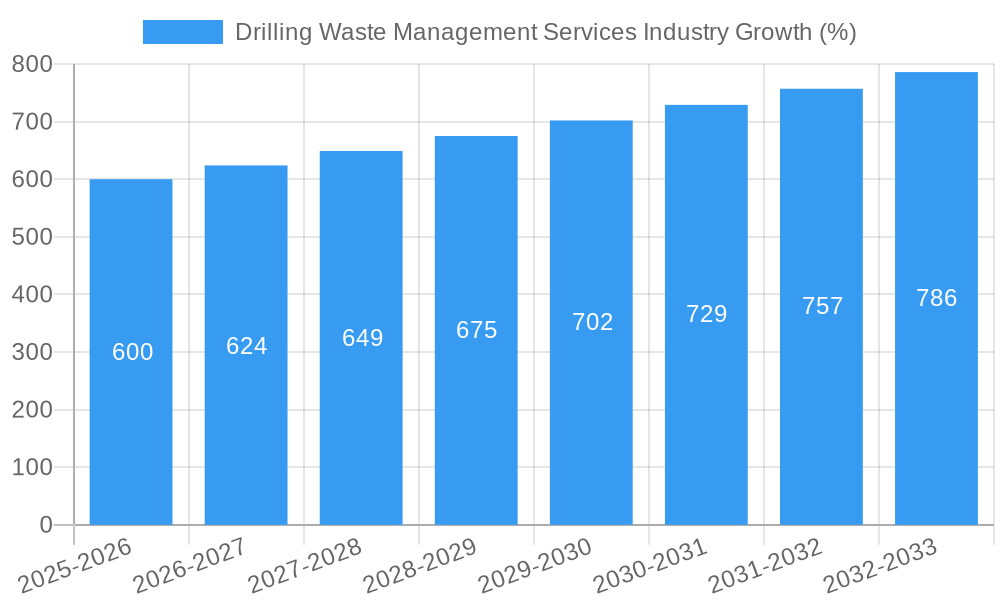
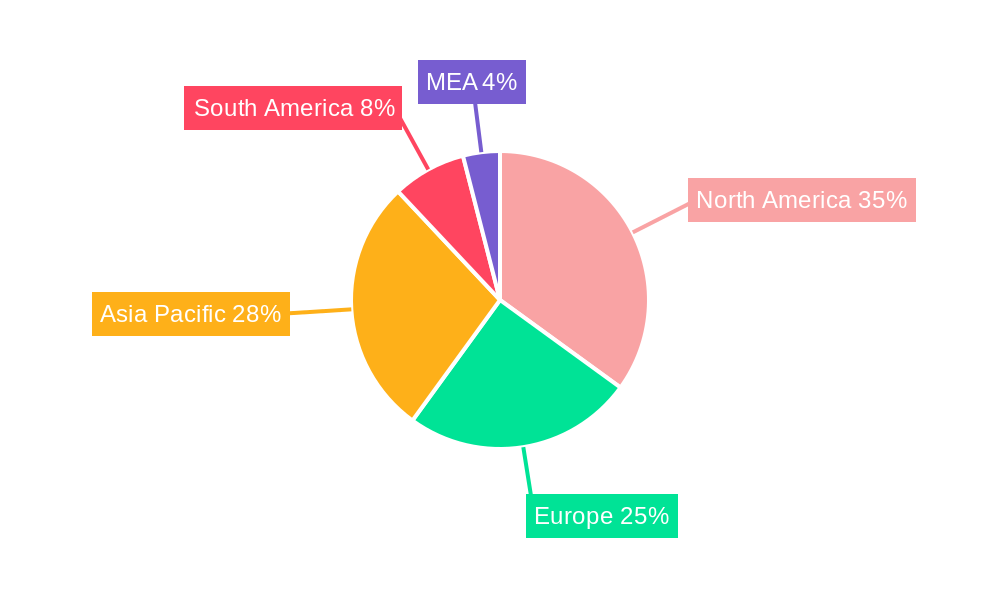
The global drilling waste management services market is experiencing robust growth, driven by increasing oil and gas exploration and production activities worldwide. A compound annual growth rate (CAGR) exceeding 4% indicates a significant expansion projected through 2033. This growth is fueled by stringent environmental regulations mandating responsible waste disposal, rising demand for efficient and eco-friendly waste management solutions, and the increasing complexity of drilling operations in challenging environments like deepwater and unconventional resource plays. The market is segmented by service type (solid control, containment & handling, and others) and location of deployment (onshore and offshore). The offshore segment is expected to exhibit faster growth due to the higher volume of waste generated in these operations and the greater need for specialized handling. Major players like Schlumberger, Baker Hughes, and Halliburton are driving innovation in this sector, developing advanced technologies for waste reduction, recycling, and responsible disposal. The North American market currently holds a significant share, largely due to established oil and gas infrastructure and stringent environmental regulations. However, rapidly developing economies in Asia-Pacific and the Middle East and Africa are projected to witness substantial growth in the coming years.
While the market presents significant opportunities, challenges remain. Fluctuations in oil and gas prices can significantly impact investment in drilling activities, thereby affecting demand for waste management services. The high capital expenditure required for advanced waste management technologies can also pose a barrier to entry for smaller companies. Furthermore, ensuring consistent compliance with evolving environmental regulations across different regions presents operational complexities for service providers. Despite these challenges, the long-term outlook for the drilling waste management services market remains positive, fueled by sustained demand for energy, increasing environmental awareness, and technological advancements that improve efficiency and reduce environmental impact. The market is expected to see continued consolidation, with larger players acquiring smaller companies to expand their service offerings and geographical reach.
Drilling Waste Management Services Industry Report: 2019-2033 Forecast
This comprehensive report provides a detailed analysis of the global Drilling Waste Management Services industry, offering invaluable insights for stakeholders, investors, and industry professionals. The study covers the period 2019-2033, with a focus on the 2025-2033 forecast period and a base year of 2025. The market is valued at xx Million in 2025 and is projected to reach xx Million by 2033, exhibiting a CAGR of xx%.
Drilling Waste Management Services Industry Market Dynamics & Concentration
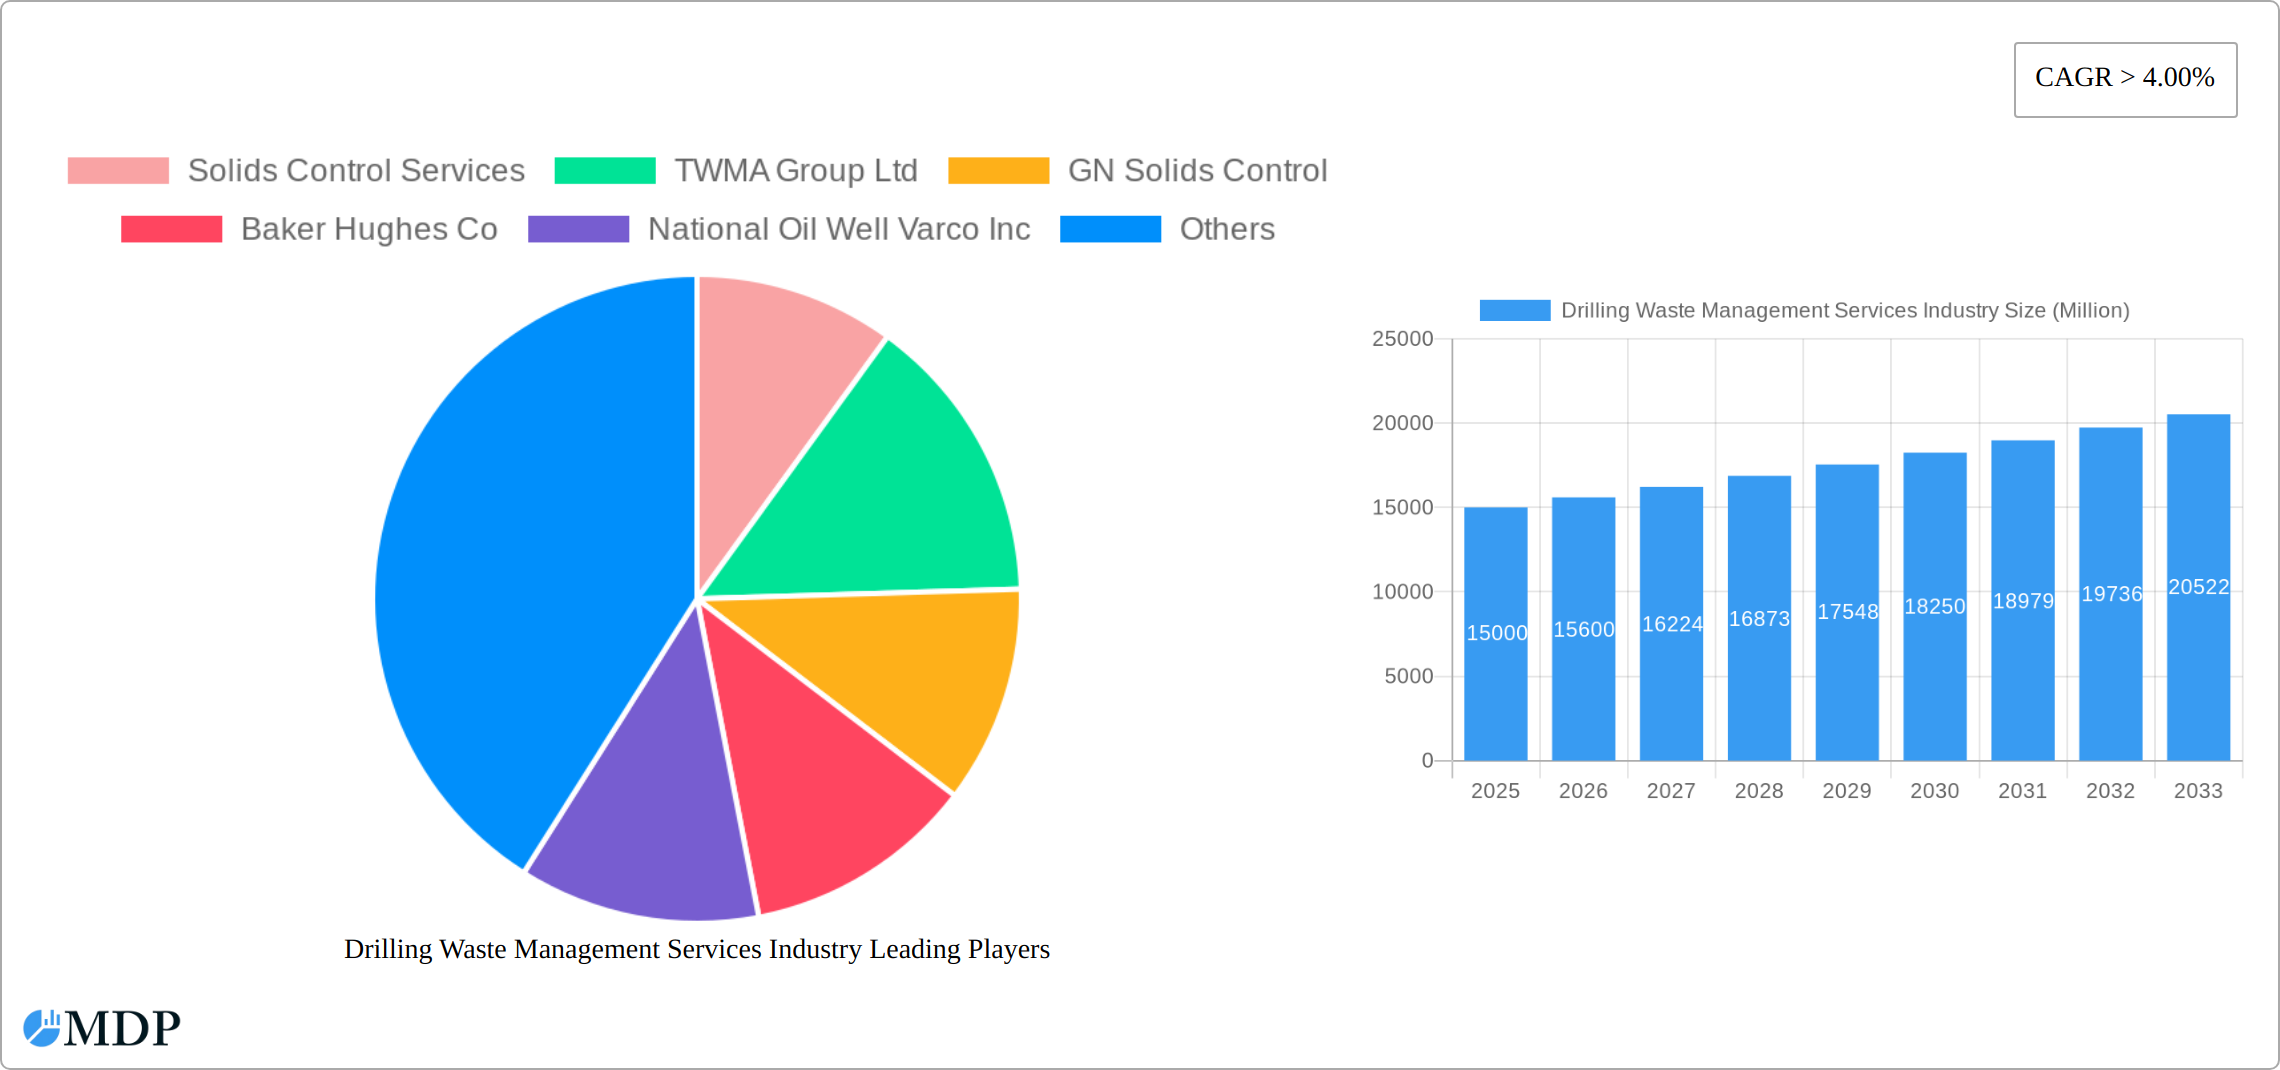
The global drilling waste management services market is characterized by a moderately concentrated landscape, with several major players holding significant market share. Companies like Solids Control Services, TWMA Group Ltd, GN Solids Control, Baker Hughes Co, National Oil Well Varco Inc, Schlumberger Ltd, Eco-Logic Environmental Engineering Inc, Halliburton Company, Weatherford International PLC, and SAR AS compete intensely, driving innovation and influencing market prices. Market concentration is further impacted by mergers and acquisitions (M&A) activities, with an estimated xx M&A deals recorded between 2019 and 2024. The largest players collectively hold approximately xx% of the market share in 2025.
- Market Concentration: Moderately concentrated, with top players holding xx% market share.
- Innovation Drivers: Stringent environmental regulations, technological advancements in waste treatment, and the need for efficient and cost-effective solutions.
- Regulatory Frameworks: Varying environmental regulations across different regions significantly impact operational costs and market entry barriers.
- Product Substitutes: Limited substitutes exist, but advancements in alternative technologies could pose a future threat.
- End-User Trends: Growing demand for sustainable practices and reduced environmental impact from the oil and gas industry is a major driver.
- M&A Activities: xx M&A deals between 2019 and 2024 indicate consolidation and expansion within the market.
Drilling Waste Management Services Industry Industry Trends & Analysis
The drilling waste management services market is experiencing robust growth driven by several factors. The increasing global demand for energy, coupled with stringent environmental regulations, necessitates efficient and environmentally responsible waste management solutions. Technological advancements in solid control, containment, and handling technologies are leading to improved efficiency and reduced environmental footprint. The market is also witnessing a shift towards more sustainable and eco-friendly practices, creating opportunities for companies offering innovative solutions. The market is expected to experience a Compound Annual Growth Rate (CAGR) of xx% during the forecast period (2025-2033), driven by a xx% market penetration increase by 2033 in key regions. Competitive dynamics are shaping the market through strategic partnerships, technological innovation, and aggressive pricing strategies. The emergence of digital technologies for data monitoring and optimization is further enhancing efficiency and reducing operational costs.
Leading Markets & Segments in Drilling Waste Management Services Industry
The onshore segment currently dominates the market, driven by the higher concentration of drilling activities in onshore regions. However, the offshore segment is projected to witness significant growth during the forecast period due to increased exploration and production activities in offshore locations. Geographically, North America and the Middle East are the leading markets, fueled by extensive oil and gas exploration and production activities, and supportive government policies.
- Dominant Region: North America
- Dominant Segment: Onshore, Solid Control Services
- Key Drivers (Onshore): Extensive oil and gas activity, readily available infrastructure.
- Key Drivers (Offshore): Growing deepwater exploration, government incentives for offshore energy production.
- Key Drivers (Solid Control): Increasing focus on minimizing environmental impact, technological advancements.
- Key Drivers (Containment & Handling): Stringent regulations regarding waste storage and transportation.
- Key Drivers (Others): Growing demand for specialized services like waste recycling and remediation.
Drilling Waste Management Services Industry Product Developments
Recent product innovations focus on improving efficiency, reducing environmental impact, and enhancing safety. Advances in solid control equipment, automated systems, and waste recycling technologies are enhancing operational efficiency and minimizing environmental risks. New products are designed with a focus on modularity and scalability to cater to various drilling operations and locations. These developments are improving the market fit by addressing specific industry challenges and increasing operational efficiency and reducing environmental liabilities.
Key Drivers of Drilling Waste Management Services Industry Growth
The industry's growth is propelled by several key factors:
- Stringent Environmental Regulations: Increasingly stringent regulations globally mandate efficient waste management.
- Technological Advancements: Innovations in waste treatment and disposal technologies are improving efficiency and reducing costs.
- Growing Energy Demand: Global energy demand drives increased oil and gas exploration, thus increasing waste generation.
Challenges in the Drilling Waste Management Services Industry Market
The industry faces several challenges:
- Regulatory Hurdles: Varying and complex regulations across different jurisdictions increase operational costs and complexity.
- Supply Chain Issues: Fluctuations in the price and availability of materials and equipment can disrupt operations.
- Competitive Pressures: Intense competition among numerous players necessitates continuous innovation and cost optimization.
Emerging Opportunities in Drilling Waste Management Services Industry
The market presents significant growth opportunities:
- Technological Breakthroughs: Advancements in artificial intelligence, automation, and data analytics are creating opportunities for efficiency gains and cost reductions.
- Strategic Partnerships: Collaboration among service providers, technology developers, and oil and gas companies can create innovative solutions.
- Market Expansion: Untapped potential exists in emerging markets with growing oil and gas exploration activities.
Leading Players in the Drilling Waste Management Services Industry Sector
- Solids Control Services
- TWMA Group Ltd
- GN Solids Control
- Baker Hughes Co
- National Oil Well Varco Inc
- Schlumberger Ltd
- Eco-Logic Environmental Engineering Inc
- Halliburton Company
- Weatherford International PLC
- SAR AS
Key Milestones in Drilling Waste Management Services Industry Industry
- 2020: Introduction of a new, environmentally friendly waste treatment technology by Company X.
- 2022: Merger between Company Y and Company Z, leading to expanded market share.
- 2023: Launch of an automated waste handling system by Company A, significantly improving efficiency.
Strategic Outlook for Drilling Waste Management Services Industry Market
The future of the drilling waste management services market is promising. Continued technological innovation, strategic partnerships, and expansion into new markets will drive growth. Companies that prioritize sustainability, efficiency, and technological advancements are expected to gain a competitive edge. The market's potential is substantial, with significant opportunities for growth and expansion in both developed and emerging economies.
Drilling Waste Management Services Industry Segmentation
-
1. Service
- 1.1. Solid Control
- 1.2. Containment & Handling
- 1.3. Others
-
2. Location of Deployment
- 2.1. Onshore
- 2.2. Offshore
Drilling Waste Management Services Industry Segmentation By Geography
- 1. North America
- 2. Europe
- 3. Asia Pacific
- 4. South America
- 5. Middle East and Africa
Drilling Waste Management Services Industry REPORT HIGHLIGHTS
| Aspects | Details |
|---|---|
| Study Period | 2019-2033 |
| Base Year | 2024 |
| Estimated Year | 2025 |
| Forecast Period | 2025-2033 |
| Historical Period | 2019-2024 |
| Growth Rate | CAGR of > 4.00% from 2019-2033 |
| Segmentation |
|
Table of Contents
- 1. Introduction
- 1.1. Research Scope
- 1.2. Market Segmentation
- 1.3. Research Methodology
- 1.4. Definitions and Assumptions
- 2. Executive Summary
- 2.1. Introduction
- 3. Market Dynamics
- 3.1. Introduction
- 3.2. Market Drivers
- 3.2.1. 4.; Presence of Strict Government Regulations to Control Air Pollution
- 3.3. Market Restrains
- 3.3.1. 4.; Increasing Adoption of Renewable Energy
- 3.4. Market Trends
- 3.4.1. Offshore Oil & Gas to Dominate the Market
- 4. Market Factor Analysis
- 4.1. Porters Five Forces
- 4.2. Supply/Value Chain
- 4.3. PESTEL analysis
- 4.4. Market Entropy
- 4.5. Patent/Trademark Analysis
- 5. Global Drilling Waste Management Services Industry Analysis, Insights and Forecast, 2019-2031
- 5.1. Market Analysis, Insights and Forecast - by Service
- 5.1.1. Solid Control
- 5.1.2. Containment & Handling
- 5.1.3. Others
- 5.2. Market Analysis, Insights and Forecast - by Location of Deployment
- 5.2.1. Onshore
- 5.2.2. Offshore
- 5.3. Market Analysis, Insights and Forecast - by Region
- 5.3.1. North America
- 5.3.2. Europe
- 5.3.3. Asia Pacific
- 5.3.4. South America
- 5.3.5. Middle East and Africa
- 5.1. Market Analysis, Insights and Forecast - by Service
- 6. North America Drilling Waste Management Services Industry Analysis, Insights and Forecast, 2019-2031
- 6.1. Market Analysis, Insights and Forecast - by Service
- 6.1.1. Solid Control
- 6.1.2. Containment & Handling
- 6.1.3. Others
- 6.2. Market Analysis, Insights and Forecast - by Location of Deployment
- 6.2.1. Onshore
- 6.2.2. Offshore
- 6.1. Market Analysis, Insights and Forecast - by Service
- 7. Europe Drilling Waste Management Services Industry Analysis, Insights and Forecast, 2019-2031
- 7.1. Market Analysis, Insights and Forecast - by Service
- 7.1.1. Solid Control
- 7.1.2. Containment & Handling
- 7.1.3. Others
- 7.2. Market Analysis, Insights and Forecast - by Location of Deployment
- 7.2.1. Onshore
- 7.2.2. Offshore
- 7.1. Market Analysis, Insights and Forecast - by Service
- 8. Asia Pacific Drilling Waste Management Services Industry Analysis, Insights and Forecast, 2019-2031
- 8.1. Market Analysis, Insights and Forecast - by Service
- 8.1.1. Solid Control
- 8.1.2. Containment & Handling
- 8.1.3. Others
- 8.2. Market Analysis, Insights and Forecast - by Location of Deployment
- 8.2.1. Onshore
- 8.2.2. Offshore
- 8.1. Market Analysis, Insights and Forecast - by Service
- 9. South America Drilling Waste Management Services Industry Analysis, Insights and Forecast, 2019-2031
- 9.1. Market Analysis, Insights and Forecast - by Service
- 9.1.1. Solid Control
- 9.1.2. Containment & Handling
- 9.1.3. Others
- 9.2. Market Analysis, Insights and Forecast - by Location of Deployment
- 9.2.1. Onshore
- 9.2.2. Offshore
- 9.1. Market Analysis, Insights and Forecast - by Service
- 10. Middle East and Africa Drilling Waste Management Services Industry Analysis, Insights and Forecast, 2019-2031
- 10.1. Market Analysis, Insights and Forecast - by Service
- 10.1.1. Solid Control
- 10.1.2. Containment & Handling
- 10.1.3. Others
- 10.2. Market Analysis, Insights and Forecast - by Location of Deployment
- 10.2.1. Onshore
- 10.2.2. Offshore
- 10.1. Market Analysis, Insights and Forecast - by Service
- 11. North America Drilling Waste Management Services Industry Analysis, Insights and Forecast, 2019-2031
- 11.1. Market Analysis, Insights and Forecast - By Country/Sub-region
- 11.1.1 United States
- 11.1.2 Canada
- 11.1.3 Mexico
- 12. Europe Drilling Waste Management Services Industry Analysis, Insights and Forecast, 2019-2031
- 12.1. Market Analysis, Insights and Forecast - By Country/Sub-region
- 12.1.1 Germany
- 12.1.2 United Kingdom
- 12.1.3 France
- 12.1.4 Spain
- 12.1.5 Italy
- 12.1.6 Spain
- 12.1.7 Belgium
- 12.1.8 Netherland
- 12.1.9 Nordics
- 12.1.10 Rest of Europe
- 13. Asia Pacific Drilling Waste Management Services Industry Analysis, Insights and Forecast, 2019-2031
- 13.1. Market Analysis, Insights and Forecast - By Country/Sub-region
- 13.1.1 China
- 13.1.2 Japan
- 13.1.3 India
- 13.1.4 South Korea
- 13.1.5 Southeast Asia
- 13.1.6 Australia
- 13.1.7 Indonesia
- 13.1.8 Phillipes
- 13.1.9 Singapore
- 13.1.10 Thailandc
- 13.1.11 Rest of Asia Pacific
- 14. South America Drilling Waste Management Services Industry Analysis, Insights and Forecast, 2019-2031
- 14.1. Market Analysis, Insights and Forecast - By Country/Sub-region
- 14.1.1 Brazil
- 14.1.2 Argentina
- 14.1.3 Peru
- 14.1.4 Chile
- 14.1.5 Colombia
- 14.1.6 Ecuador
- 14.1.7 Venezuela
- 14.1.8 Rest of South America
- 15. North America Drilling Waste Management Services Industry Analysis, Insights and Forecast, 2019-2031
- 15.1. Market Analysis, Insights and Forecast - By Country/Sub-region
- 15.1.1 United States
- 15.1.2 Canada
- 15.1.3 Mexico
- 16. MEA Drilling Waste Management Services Industry Analysis, Insights and Forecast, 2019-2031
- 16.1. Market Analysis, Insights and Forecast - By Country/Sub-region
- 16.1.1 United Arab Emirates
- 16.1.2 Saudi Arabia
- 16.1.3 South Africa
- 16.1.4 Rest of Middle East and Africa
- 17. Competitive Analysis
- 17.1. Global Market Share Analysis 2024
- 17.2. Company Profiles
- 17.2.1 Solids Control Services
- 17.2.1.1. Overview
- 17.2.1.2. Products
- 17.2.1.3. SWOT Analysis
- 17.2.1.4. Recent Developments
- 17.2.1.5. Financials (Based on Availability)
- 17.2.2 TWMA Group Ltd
- 17.2.2.1. Overview
- 17.2.2.2. Products
- 17.2.2.3. SWOT Analysis
- 17.2.2.4. Recent Developments
- 17.2.2.5. Financials (Based on Availability)
- 17.2.3 GN Solids Control
- 17.2.3.1. Overview
- 17.2.3.2. Products
- 17.2.3.3. SWOT Analysis
- 17.2.3.4. Recent Developments
- 17.2.3.5. Financials (Based on Availability)
- 17.2.4 Baker Hughes Co
- 17.2.4.1. Overview
- 17.2.4.2. Products
- 17.2.4.3. SWOT Analysis
- 17.2.4.4. Recent Developments
- 17.2.4.5. Financials (Based on Availability)
- 17.2.5 National Oil Well Varco Inc
- 17.2.5.1. Overview
- 17.2.5.2. Products
- 17.2.5.3. SWOT Analysis
- 17.2.5.4. Recent Developments
- 17.2.5.5. Financials (Based on Availability)
- 17.2.6 Schlumberger Ltd
- 17.2.6.1. Overview
- 17.2.6.2. Products
- 17.2.6.3. SWOT Analysis
- 17.2.6.4. Recent Developments
- 17.2.6.5. Financials (Based on Availability)
- 17.2.7 Eco-Logic Environmental Engineering Inc
- 17.2.7.1. Overview
- 17.2.7.2. Products
- 17.2.7.3. SWOT Analysis
- 17.2.7.4. Recent Developments
- 17.2.7.5. Financials (Based on Availability)
- 17.2.8 Halliburton Company
- 17.2.8.1. Overview
- 17.2.8.2. Products
- 17.2.8.3. SWOT Analysis
- 17.2.8.4. Recent Developments
- 17.2.8.5. Financials (Based on Availability)
- 17.2.9 Weatherford International PLC*List Not Exhaustive
- 17.2.9.1. Overview
- 17.2.9.2. Products
- 17.2.9.3. SWOT Analysis
- 17.2.9.4. Recent Developments
- 17.2.9.5. Financials (Based on Availability)
- 17.2.10 SAR AS
- 17.2.10.1. Overview
- 17.2.10.2. Products
- 17.2.10.3. SWOT Analysis
- 17.2.10.4. Recent Developments
- 17.2.10.5. Financials (Based on Availability)
- 17.2.1 Solids Control Services
List of Figures
- Figure 1: Global Drilling Waste Management Services Industry Revenue Breakdown (Million, %) by Region 2024 & 2032
- Figure 2: North America Drilling Waste Management Services Industry Revenue (Million), by Country 2024 & 2032
- Figure 3: North America Drilling Waste Management Services Industry Revenue Share (%), by Country 2024 & 2032
- Figure 4: Europe Drilling Waste Management Services Industry Revenue (Million), by Country 2024 & 2032
- Figure 5: Europe Drilling Waste Management Services Industry Revenue Share (%), by Country 2024 & 2032
- Figure 6: Asia Pacific Drilling Waste Management Services Industry Revenue (Million), by Country 2024 & 2032
- Figure 7: Asia Pacific Drilling Waste Management Services Industry Revenue Share (%), by Country 2024 & 2032
- Figure 8: South America Drilling Waste Management Services Industry Revenue (Million), by Country 2024 & 2032
- Figure 9: South America Drilling Waste Management Services Industry Revenue Share (%), by Country 2024 & 2032
- Figure 10: North America Drilling Waste Management Services Industry Revenue (Million), by Country 2024 & 2032
- Figure 11: North America Drilling Waste Management Services Industry Revenue Share (%), by Country 2024 & 2032
- Figure 12: MEA Drilling Waste Management Services Industry Revenue (Million), by Country 2024 & 2032
- Figure 13: MEA Drilling Waste Management Services Industry Revenue Share (%), by Country 2024 & 2032
- Figure 14: North America Drilling Waste Management Services Industry Revenue (Million), by Service 2024 & 2032
- Figure 15: North America Drilling Waste Management Services Industry Revenue Share (%), by Service 2024 & 2032
- Figure 16: North America Drilling Waste Management Services Industry Revenue (Million), by Location of Deployment 2024 & 2032
- Figure 17: North America Drilling Waste Management Services Industry Revenue Share (%), by Location of Deployment 2024 & 2032
- Figure 18: North America Drilling Waste Management Services Industry Revenue (Million), by Country 2024 & 2032
- Figure 19: North America Drilling Waste Management Services Industry Revenue Share (%), by Country 2024 & 2032
- Figure 20: Europe Drilling Waste Management Services Industry Revenue (Million), by Service 2024 & 2032
- Figure 21: Europe Drilling Waste Management Services Industry Revenue Share (%), by Service 2024 & 2032
- Figure 22: Europe Drilling Waste Management Services Industry Revenue (Million), by Location of Deployment 2024 & 2032
- Figure 23: Europe Drilling Waste Management Services Industry Revenue Share (%), by Location of Deployment 2024 & 2032
- Figure 24: Europe Drilling Waste Management Services Industry Revenue (Million), by Country 2024 & 2032
- Figure 25: Europe Drilling Waste Management Services Industry Revenue Share (%), by Country 2024 & 2032
- Figure 26: Asia Pacific Drilling Waste Management Services Industry Revenue (Million), by Service 2024 & 2032
- Figure 27: Asia Pacific Drilling Waste Management Services Industry Revenue Share (%), by Service 2024 & 2032
- Figure 28: Asia Pacific Drilling Waste Management Services Industry Revenue (Million), by Location of Deployment 2024 & 2032
- Figure 29: Asia Pacific Drilling Waste Management Services Industry Revenue Share (%), by Location of Deployment 2024 & 2032
- Figure 30: Asia Pacific Drilling Waste Management Services Industry Revenue (Million), by Country 2024 & 2032
- Figure 31: Asia Pacific Drilling Waste Management Services Industry Revenue Share (%), by Country 2024 & 2032
- Figure 32: South America Drilling Waste Management Services Industry Revenue (Million), by Service 2024 & 2032
- Figure 33: South America Drilling Waste Management Services Industry Revenue Share (%), by Service 2024 & 2032
- Figure 34: South America Drilling Waste Management Services Industry Revenue (Million), by Location of Deployment 2024 & 2032
- Figure 35: South America Drilling Waste Management Services Industry Revenue Share (%), by Location of Deployment 2024 & 2032
- Figure 36: South America Drilling Waste Management Services Industry Revenue (Million), by Country 2024 & 2032
- Figure 37: South America Drilling Waste Management Services Industry Revenue Share (%), by Country 2024 & 2032
- Figure 38: Middle East and Africa Drilling Waste Management Services Industry Revenue (Million), by Service 2024 & 2032
- Figure 39: Middle East and Africa Drilling Waste Management Services Industry Revenue Share (%), by Service 2024 & 2032
- Figure 40: Middle East and Africa Drilling Waste Management Services Industry Revenue (Million), by Location of Deployment 2024 & 2032
- Figure 41: Middle East and Africa Drilling Waste Management Services Industry Revenue Share (%), by Location of Deployment 2024 & 2032
- Figure 42: Middle East and Africa Drilling Waste Management Services Industry Revenue (Million), by Country 2024 & 2032
- Figure 43: Middle East and Africa Drilling Waste Management Services Industry Revenue Share (%), by Country 2024 & 2032
List of Tables
- Table 1: Global Drilling Waste Management Services Industry Revenue Million Forecast, by Region 2019 & 2032
- Table 2: Global Drilling Waste Management Services Industry Revenue Million Forecast, by Service 2019 & 2032
- Table 3: Global Drilling Waste Management Services Industry Revenue Million Forecast, by Location of Deployment 2019 & 2032
- Table 4: Global Drilling Waste Management Services Industry Revenue Million Forecast, by Region 2019 & 2032
- Table 5: Global Drilling Waste Management Services Industry Revenue Million Forecast, by Country 2019 & 2032
- Table 6: United States Drilling Waste Management Services Industry Revenue (Million) Forecast, by Application 2019 & 2032
- Table 7: Canada Drilling Waste Management Services Industry Revenue (Million) Forecast, by Application 2019 & 2032
- Table 8: Mexico Drilling Waste Management Services Industry Revenue (Million) Forecast, by Application 2019 & 2032
- Table 9: Global Drilling Waste Management Services Industry Revenue Million Forecast, by Country 2019 & 2032
- Table 10: Germany Drilling Waste Management Services Industry Revenue (Million) Forecast, by Application 2019 & 2032
- Table 11: United Kingdom Drilling Waste Management Services Industry Revenue (Million) Forecast, by Application 2019 & 2032
- Table 12: France Drilling Waste Management Services Industry Revenue (Million) Forecast, by Application 2019 & 2032
- Table 13: Spain Drilling Waste Management Services Industry Revenue (Million) Forecast, by Application 2019 & 2032
- Table 14: Italy Drilling Waste Management Services Industry Revenue (Million) Forecast, by Application 2019 & 2032
- Table 15: Spain Drilling Waste Management Services Industry Revenue (Million) Forecast, by Application 2019 & 2032
- Table 16: Belgium Drilling Waste Management Services Industry Revenue (Million) Forecast, by Application 2019 & 2032
- Table 17: Netherland Drilling Waste Management Services Industry Revenue (Million) Forecast, by Application 2019 & 2032
- Table 18: Nordics Drilling Waste Management Services Industry Revenue (Million) Forecast, by Application 2019 & 2032
- Table 19: Rest of Europe Drilling Waste Management Services Industry Revenue (Million) Forecast, by Application 2019 & 2032
- Table 20: Global Drilling Waste Management Services Industry Revenue Million Forecast, by Country 2019 & 2032
- Table 21: China Drilling Waste Management Services Industry Revenue (Million) Forecast, by Application 2019 & 2032
- Table 22: Japan Drilling Waste Management Services Industry Revenue (Million) Forecast, by Application 2019 & 2032
- Table 23: India Drilling Waste Management Services Industry Revenue (Million) Forecast, by Application 2019 & 2032
- Table 24: South Korea Drilling Waste Management Services Industry Revenue (Million) Forecast, by Application 2019 & 2032
- Table 25: Southeast Asia Drilling Waste Management Services Industry Revenue (Million) Forecast, by Application 2019 & 2032
- Table 26: Australia Drilling Waste Management Services Industry Revenue (Million) Forecast, by Application 2019 & 2032
- Table 27: Indonesia Drilling Waste Management Services Industry Revenue (Million) Forecast, by Application 2019 & 2032
- Table 28: Phillipes Drilling Waste Management Services Industry Revenue (Million) Forecast, by Application 2019 & 2032
- Table 29: Singapore Drilling Waste Management Services Industry Revenue (Million) Forecast, by Application 2019 & 2032
- Table 30: Thailandc Drilling Waste Management Services Industry Revenue (Million) Forecast, by Application 2019 & 2032
- Table 31: Rest of Asia Pacific Drilling Waste Management Services Industry Revenue (Million) Forecast, by Application 2019 & 2032
- Table 32: Global Drilling Waste Management Services Industry Revenue Million Forecast, by Country 2019 & 2032
- Table 33: Brazil Drilling Waste Management Services Industry Revenue (Million) Forecast, by Application 2019 & 2032
- Table 34: Argentina Drilling Waste Management Services Industry Revenue (Million) Forecast, by Application 2019 & 2032
- Table 35: Peru Drilling Waste Management Services Industry Revenue (Million) Forecast, by Application 2019 & 2032
- Table 36: Chile Drilling Waste Management Services Industry Revenue (Million) Forecast, by Application 2019 & 2032
- Table 37: Colombia Drilling Waste Management Services Industry Revenue (Million) Forecast, by Application 2019 & 2032
- Table 38: Ecuador Drilling Waste Management Services Industry Revenue (Million) Forecast, by Application 2019 & 2032
- Table 39: Venezuela Drilling Waste Management Services Industry Revenue (Million) Forecast, by Application 2019 & 2032
- Table 40: Rest of South America Drilling Waste Management Services Industry Revenue (Million) Forecast, by Application 2019 & 2032
- Table 41: Global Drilling Waste Management Services Industry Revenue Million Forecast, by Country 2019 & 2032
- Table 42: United States Drilling Waste Management Services Industry Revenue (Million) Forecast, by Application 2019 & 2032
- Table 43: Canada Drilling Waste Management Services Industry Revenue (Million) Forecast, by Application 2019 & 2032
- Table 44: Mexico Drilling Waste Management Services Industry Revenue (Million) Forecast, by Application 2019 & 2032
- Table 45: Global Drilling Waste Management Services Industry Revenue Million Forecast, by Country 2019 & 2032
- Table 46: United Arab Emirates Drilling Waste Management Services Industry Revenue (Million) Forecast, by Application 2019 & 2032
- Table 47: Saudi Arabia Drilling Waste Management Services Industry Revenue (Million) Forecast, by Application 2019 & 2032
- Table 48: South Africa Drilling Waste Management Services Industry Revenue (Million) Forecast, by Application 2019 & 2032
- Table 49: Rest of Middle East and Africa Drilling Waste Management Services Industry Revenue (Million) Forecast, by Application 2019 & 2032
- Table 50: Global Drilling Waste Management Services Industry Revenue Million Forecast, by Service 2019 & 2032
- Table 51: Global Drilling Waste Management Services Industry Revenue Million Forecast, by Location of Deployment 2019 & 2032
- Table 52: Global Drilling Waste Management Services Industry Revenue Million Forecast, by Country 2019 & 2032
- Table 53: Global Drilling Waste Management Services Industry Revenue Million Forecast, by Service 2019 & 2032
- Table 54: Global Drilling Waste Management Services Industry Revenue Million Forecast, by Location of Deployment 2019 & 2032
- Table 55: Global Drilling Waste Management Services Industry Revenue Million Forecast, by Country 2019 & 2032
- Table 56: Global Drilling Waste Management Services Industry Revenue Million Forecast, by Service 2019 & 2032
- Table 57: Global Drilling Waste Management Services Industry Revenue Million Forecast, by Location of Deployment 2019 & 2032
- Table 58: Global Drilling Waste Management Services Industry Revenue Million Forecast, by Country 2019 & 2032
- Table 59: Global Drilling Waste Management Services Industry Revenue Million Forecast, by Service 2019 & 2032
- Table 60: Global Drilling Waste Management Services Industry Revenue Million Forecast, by Location of Deployment 2019 & 2032
- Table 61: Global Drilling Waste Management Services Industry Revenue Million Forecast, by Country 2019 & 2032
- Table 62: Global Drilling Waste Management Services Industry Revenue Million Forecast, by Service 2019 & 2032
- Table 63: Global Drilling Waste Management Services Industry Revenue Million Forecast, by Location of Deployment 2019 & 2032
- Table 64: Global Drilling Waste Management Services Industry Revenue Million Forecast, by Country 2019 & 2032
Frequently Asked Questions
1. What is the projected Compound Annual Growth Rate (CAGR) of the Drilling Waste Management Services Industry?
The projected CAGR is approximately > 4.00%.
2. Which companies are prominent players in the Drilling Waste Management Services Industry?
Key companies in the market include Solids Control Services, TWMA Group Ltd, GN Solids Control, Baker Hughes Co, National Oil Well Varco Inc, Schlumberger Ltd, Eco-Logic Environmental Engineering Inc, Halliburton Company, Weatherford International PLC*List Not Exhaustive, SAR AS.
3. What are the main segments of the Drilling Waste Management Services Industry?
The market segments include Service, Location of Deployment.
4. Can you provide details about the market size?
The market size is estimated to be USD XX Million as of 2022.
5. What are some drivers contributing to market growth?
4.; Presence of Strict Government Regulations to Control Air Pollution.
6. What are the notable trends driving market growth?
Offshore Oil & Gas to Dominate the Market.
7. Are there any restraints impacting market growth?
4.; Increasing Adoption of Renewable Energy.
8. Can you provide examples of recent developments in the market?
N/A
9. What pricing options are available for accessing the report?
Pricing options include single-user, multi-user, and enterprise licenses priced at USD 4750, USD 5250, and USD 8750 respectively.
10. Is the market size provided in terms of value or volume?
The market size is provided in terms of value, measured in Million.
11. Are there any specific market keywords associated with the report?
Yes, the market keyword associated with the report is "Drilling Waste Management Services Industry," which aids in identifying and referencing the specific market segment covered.
12. How do I determine which pricing option suits my needs best?
The pricing options vary based on user requirements and access needs. Individual users may opt for single-user licenses, while businesses requiring broader access may choose multi-user or enterprise licenses for cost-effective access to the report.
13. Are there any additional resources or data provided in the Drilling Waste Management Services Industry report?
While the report offers comprehensive insights, it's advisable to review the specific contents or supplementary materials provided to ascertain if additional resources or data are available.
14. How can I stay updated on further developments or reports in the Drilling Waste Management Services Industry?
To stay informed about further developments, trends, and reports in the Drilling Waste Management Services Industry, consider subscribing to industry newsletters, following relevant companies and organizations, or regularly checking reputable industry news sources and publications.
Methodology
Step 1 - Identification of Relevant Samples Size from Population Database


Step 2 - Approaches for Defining Global Market Size (Value, Volume* & Price*)

Note*: In applicable scenarios
Step 3 - Data Sources
Primary Research
- Web Analytics
- Survey Reports
- Research Institute
- Latest Research Reports
- Opinion Leaders
Secondary Research
- Annual Reports
- White Paper
- Latest Press Release
- Industry Association
- Paid Database
- Investor Presentations

Step 4 - Data Triangulation
Involves using different sources of information in order to increase the validity of a study
These sources are likely to be stakeholders in a program - participants, other researchers, program staff, other community members, and so on.
Then we put all data in single framework & apply various statistical tools to find out the dynamic on the market.
During the analysis stage, feedback from the stakeholder groups would be compared to determine areas of agreement as well as areas of divergence
