

Key Insights
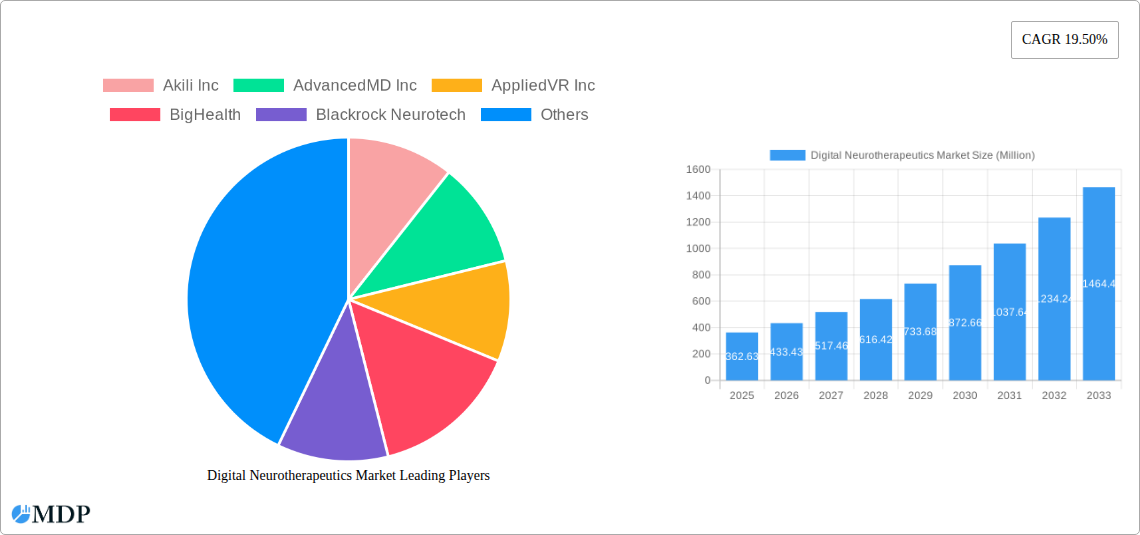
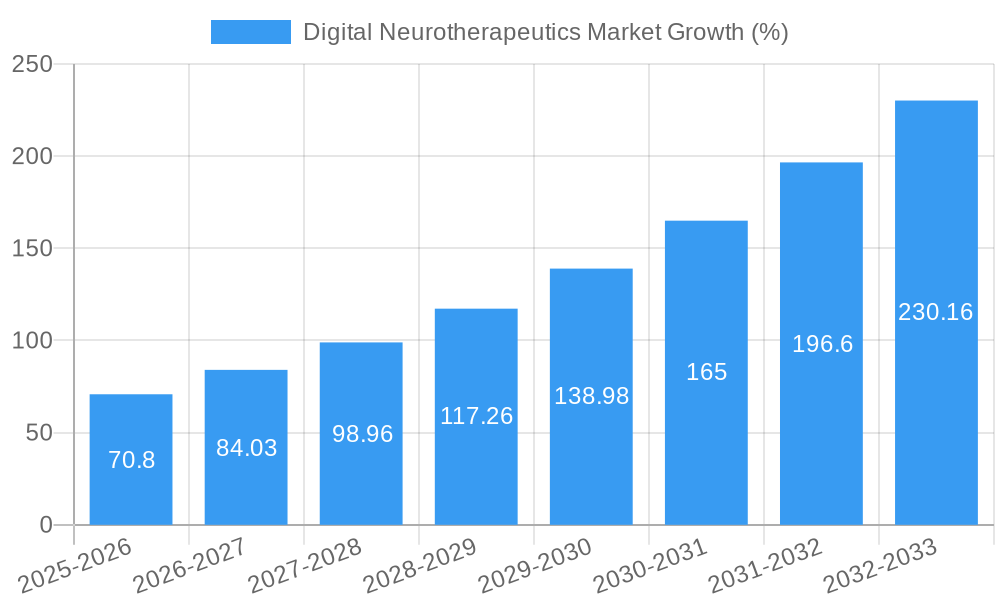
The digital neurotherapeutics market is experiencing robust growth, projected to reach \$362.63 million in 2025 and exhibiting a Compound Annual Growth Rate (CAGR) of 19.50% from 2025 to 2033. This expansion is fueled by several key factors. The rising prevalence of neurological and mental health disorders globally, coupled with the increasing adoption of telehealth and remote patient monitoring, is significantly driving market demand. Furthermore, advancements in technology, such as artificial intelligence (AI) and virtual reality (VR), are enabling the development of more effective and personalized digital therapeutic interventions. The integration of these technologies into existing healthcare systems is streamlining access to care and improving treatment outcomes, thereby further fueling market growth. The market's segmentation likely includes various therapeutic areas (e.g., depression, anxiety, stroke rehabilitation), delivery methods (e.g., mobile apps, VR/AR platforms), and patient populations (e.g., children, adults, elderly). Companies like Akili Inc, AppliedVR Inc, and BigHealth are leading the innovation, driving the development and adoption of these digital solutions. However, challenges remain, including regulatory hurdles for approval and reimbursement, data privacy concerns, and the need to address potential disparities in access to technology across different socioeconomic groups.
The forecast period of 2025-2033 anticipates continued market expansion, driven by ongoing technological advancements and increased awareness of the benefits of digital neurotherapeutics. The market's success will hinge on addressing challenges related to efficacy validation, ensuring patient safety and data security, and fostering greater collaboration between technology developers, clinicians, and regulatory bodies. Strategic partnerships and acquisitions within the industry are likely to intensify as larger healthcare companies seek to integrate digital neurotherapeutics into their existing service portfolios. The potential for personalized and preventative care through digital interventions will further propel market growth, making this sector a promising area for both investment and healthcare innovation.
Digital Neurotherapeutics Market: A Comprehensive Report (2019-2033)
This comprehensive report provides an in-depth analysis of the Digital Neurotherapeutics Market, offering valuable insights for industry stakeholders, investors, and researchers. With a study period spanning 2019-2033, a base year of 2025, and a forecast period of 2025-2033, this report utilizes extensive data analysis and market research to present a clear picture of the current state and future trajectory of this rapidly evolving sector. The report covers key market segments, leading players including Akili Inc, AdvancedMD Inc, AppliedVR Inc, BigHealth, Blackrock Neurotech, Cognivive Inc, Neofect Co Ltd, Omada Health Inc, Neurotherapeutic Pediatric Therapies Inc, and Mindmaze (list not exhaustive), and significant industry developments. The total market value is predicted to reach xx Million by 2033, exhibiting a CAGR of xx% during the forecast period.
Digital Neurotherapeutics Market Market Dynamics & Concentration
The Digital Neurotherapeutics Market is characterized by a moderately concentrated landscape with several key players holding significant market share. The market share held by the top five companies is estimated at xx%, with Akili Inc and AppliedVR Inc exhibiting strong growth in recent years. Market concentration is influenced by factors including regulatory approvals, technological innovation, and the ability to secure strategic partnerships. Innovation is a key driver, with companies continuously developing new digital therapeutics to address a wider range of neurological disorders. Stringent regulatory frameworks, however, pose challenges, particularly concerning data privacy and efficacy validation. Product substitutes, such as traditional therapies, exert competitive pressure. End-user trends are shifting towards personalized and at-home neurorehabilitation solutions, fueling demand for user-friendly and effective digital therapeutics. The market has witnessed a moderate level of M&A activity in recent years, with an estimated xx M&A deals concluded between 2019 and 2024.
- Market Concentration: Top 5 players hold xx% market share (2025 Estimate).
- Innovation Drivers: Development of AI-powered diagnostics, personalized treatment plans, and integration with wearable sensors.
- Regulatory Frameworks: Stringent regulations impacting data privacy and clinical validation of digital therapeutics.
- Product Substitutes: Traditional pharmacological and physical therapies compete for market share.
- End-User Trends: Growing preference for at-home and personalized neurorehabilitation solutions.
- M&A Activity: Approximately xx M&A deals between 2019 and 2024.
Digital Neurotherapeutics Market Industry Trends & Analysis
The Digital Neurotherapeutics Market is experiencing robust growth driven by several key factors. The rising prevalence of neurological disorders globally is a primary growth driver, creating a significant unmet need for effective and accessible treatment options. Technological advancements, particularly in artificial intelligence (AI), machine learning (ML), and virtual reality (VR), are fueling innovation and enabling the development of more sophisticated and personalized digital therapeutics. Consumer preferences are shifting towards convenient, cost-effective, and accessible healthcare solutions, making digital therapeutics increasingly attractive. Competitive dynamics are intense, with established players and new entrants vying for market share through product innovation, strategic partnerships, and acquisitions. The market exhibits strong growth potential, with a projected CAGR of xx% from 2025 to 2033. Market penetration is increasing steadily as digital therapeutics are increasingly incorporated into clinical practice and covered by insurance providers. The global market size is estimated to reach xx Million by 2033.
Leading Markets & Segments in Digital Neurotherapeutics Market
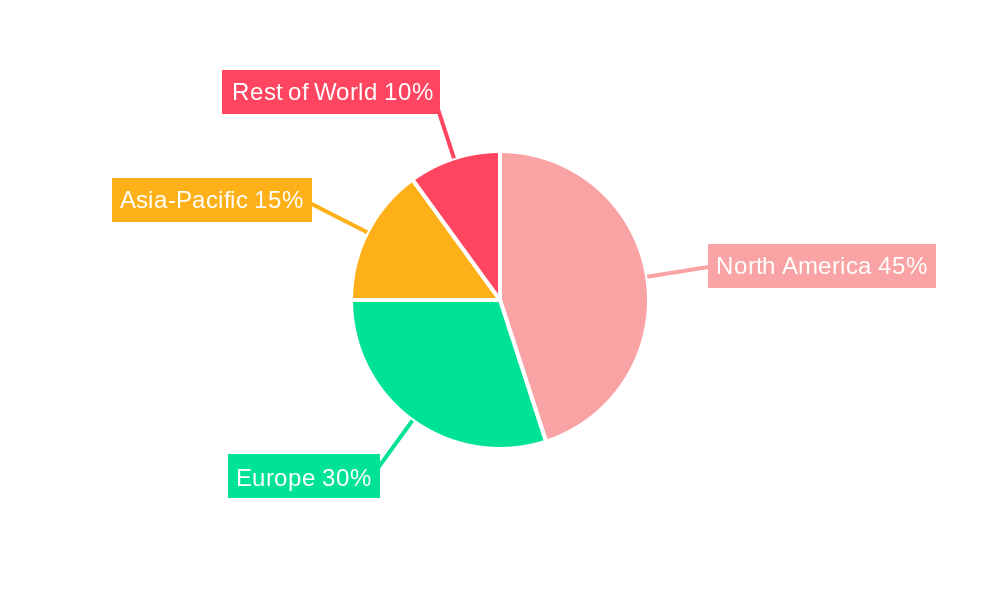
The North American region currently holds the largest market share in the digital neurotherapeutics market. This dominance is primarily attributed to the region's well-developed healthcare infrastructure, high adoption of digital health technologies, and favorable regulatory environment for digital therapeutics. Within North America, the United States accounts for the majority of market revenue, driven by factors such as high prevalence of neurological disorders, strong funding for research and development, and widespread insurance coverage for digital health solutions.
- Key Drivers for North American Dominance:
- Advanced healthcare infrastructure and high technological adoption.
- Favorable regulatory environment and strong funding for research.
- High prevalence of neurological disorders and widespread insurance coverage.
Digital Neurotherapeutics Market Product Developments
Recent product developments in the digital neurotherapeutics market reflect a strong focus on personalized treatment plans, AI-powered diagnostics, and integration with wearable sensors. Companies are developing innovative digital therapeutics for a range of neurological conditions, including stroke rehabilitation, attention-deficit/hyperactivity disorder (ADHD), and anxiety disorders. The focus is on creating user-friendly, engaging, and evidence-based digital therapeutics that can deliver tangible clinical outcomes. These improvements have contributed significantly to increased market adoption and positive clinical trial results, further strengthening market growth.
Key Drivers of Digital Neurotherapeutics Market Growth
Several factors are driving the growth of the digital neurotherapeutics market. Technological advancements, particularly in AI and VR, are enabling the development of highly effective and personalized treatments. Economic factors, such as rising healthcare costs and the increasing demand for cost-effective treatments, are also contributing to market growth. Favorable regulatory policies are creating a supportive environment for the development and adoption of digital therapeutics. For example, the FDA's increased focus on digital therapeutics has streamlined the approval process.
Challenges in the Digital Neurotherapeutics Market Market
The Digital Neurotherapeutics Market faces several challenges, including stringent regulatory hurdles, which can delay product launches and increase development costs. Supply chain issues related to the procurement of components for digital devices can disrupt production and increase prices. Intense competition amongst established players and new entrants puts pressure on profit margins and necessitates continuous innovation. These factors, combined, can create significant challenges for sustained market growth. The estimated impact of these challenges on market growth is approximately a xx% reduction in the overall projected market value during the forecast period.
Emerging Opportunities in Digital Neurotherapeutics Market
Technological breakthroughs, such as advancements in brain-computer interfaces and personalized medicine, present significant opportunities for long-term growth. Strategic partnerships between technology companies and healthcare providers can accelerate the adoption of digital therapeutics. Expansion into emerging markets with high prevalence of neurological disorders, alongside improved access to digital technologies, further presents significant market potential. The market is poised for significant expansion and the development of innovative treatment paradigms.
Leading Players in the Digital Neurotherapeutics Market Sector
- Akili Inc
- AdvancedMD Inc
- AppliedVR Inc
- BigHealth
- Blackrock Neurotech
- Cognivive Inc
- Neofect Co Ltd
- Omada Health Inc
- Neurotherapeutic Pediatric Therapies Inc
- Mindmaze
Key Milestones in Digital Neurotherapeutics Market Industry
- October 2023: MedRhythms launched InTandem (MR-001), a prescription neurorehabilitation system for stroke patients, improving access to at-home therapy.
- February 2024: The University of London launched the iTalkBetter app, providing speech therapy for aphasia patients. This expands treatment access and demonstrates growing innovation in digital therapeutic applications.
Strategic Outlook for Digital Neurotherapeutics Market Market
The Digital Neurotherapeutics Market holds immense potential for future growth. Strategic partnerships, focused on research and development, will drive innovation. Expansion into underserved markets and the integration of new technologies will be crucial for capturing market share. Companies focusing on personalized treatments and seamless integration with existing healthcare systems will be best positioned for success. The market's trajectory suggests a bright future driven by technological innovation and increasing demand for effective neurorehabilitation solutions.
Digital Neurotherapeutics Market Segmentation
-
1. Component
- 1.1. Software
- 1.2. Hardware
- 1.3. Services
-
2. Indication
- 2.1. Alzheimer’s Disease
- 2.2. Parkinson’s Disease
- 2.3. Multiple Sclerosis
- 2.4. Epilepsy
- 2.5. Other Indications
-
3. End User
- 3.1. Patients
- 3.2. Providers
- 3.3. Payers
- 3.4. Other End Users
Digital Neurotherapeutics Market Segmentation By Geography
-
1. North America
- 1.1. United States
- 1.2. Canada
- 1.3. Mexico
-
2. Europe
- 2.1. Germany
- 2.2. United Kingdom
- 2.3. France
- 2.4. Italy
- 2.5. Spain
- 2.6. Rest of Europe
-
3. Asia Pacific
- 3.1. China
- 3.2. Japan
- 3.3. India
- 3.4. Australia
- 3.5. South Korea
- 3.6. Rest of Asia Pacific
-
4. Middle East and Africa
- 4.1. GCC
- 4.2. South Africa
- 4.3. Rest of Middle East and Africa
-
5. South America
- 5.1. Brazil
- 5.2. Argentina
- 5.3. Rest of South America
Digital Neurotherapeutics Market REPORT HIGHLIGHTS
| Aspects | Details |
|---|---|
| Study Period | 2019-2033 |
| Base Year | 2024 |
| Estimated Year | 2025 |
| Forecast Period | 2025-2033 |
| Historical Period | 2019-2024 |
| Growth Rate | CAGR of 19.50% from 2019-2033 |
| Segmentation |
|
Table of Contents
- 1. Introduction
- 1.1. Research Scope
- 1.2. Market Segmentation
- 1.3. Research Methodology
- 1.4. Definitions and Assumptions
- 2. Executive Summary
- 2.1. Introduction
- 3. Market Dynamics
- 3.1. Introduction
- 3.2. Market Drivers
- 3.2.1. Rising Prevalence of Neurological Disorders; Growing Adoption of Digital Technology in Neurology Care
- 3.3. Market Restrains
- 3.3.1. Rising Prevalence of Neurological Disorders; Growing Adoption of Digital Technology in Neurology Care
- 3.4. Market Trends
- 3.4.1. The Multiple Sclerosis Segment is Expected to Hold Significant Market Share Over the Forecast Period
- 4. Market Factor Analysis
- 4.1. Porters Five Forces
- 4.2. Supply/Value Chain
- 4.3. PESTEL analysis
- 4.4. Market Entropy
- 4.5. Patent/Trademark Analysis
- 5. Global Digital Neurotherapeutics Market Analysis, Insights and Forecast, 2019-2031
- 5.1. Market Analysis, Insights and Forecast - by Component
- 5.1.1. Software
- 5.1.2. Hardware
- 5.1.3. Services
- 5.2. Market Analysis, Insights and Forecast - by Indication
- 5.2.1. Alzheimer’s Disease
- 5.2.2. Parkinson’s Disease
- 5.2.3. Multiple Sclerosis
- 5.2.4. Epilepsy
- 5.2.5. Other Indications
- 5.3. Market Analysis, Insights and Forecast - by End User
- 5.3.1. Patients
- 5.3.2. Providers
- 5.3.3. Payers
- 5.3.4. Other End Users
- 5.4. Market Analysis, Insights and Forecast - by Region
- 5.4.1. North America
- 5.4.2. Europe
- 5.4.3. Asia Pacific
- 5.4.4. Middle East and Africa
- 5.4.5. South America
- 5.1. Market Analysis, Insights and Forecast - by Component
- 6. North America Digital Neurotherapeutics Market Analysis, Insights and Forecast, 2019-2031
- 6.1. Market Analysis, Insights and Forecast - by Component
- 6.1.1. Software
- 6.1.2. Hardware
- 6.1.3. Services
- 6.2. Market Analysis, Insights and Forecast - by Indication
- 6.2.1. Alzheimer’s Disease
- 6.2.2. Parkinson’s Disease
- 6.2.3. Multiple Sclerosis
- 6.2.4. Epilepsy
- 6.2.5. Other Indications
- 6.3. Market Analysis, Insights and Forecast - by End User
- 6.3.1. Patients
- 6.3.2. Providers
- 6.3.3. Payers
- 6.3.4. Other End Users
- 6.1. Market Analysis, Insights and Forecast - by Component
- 7. Europe Digital Neurotherapeutics Market Analysis, Insights and Forecast, 2019-2031
- 7.1. Market Analysis, Insights and Forecast - by Component
- 7.1.1. Software
- 7.1.2. Hardware
- 7.1.3. Services
- 7.2. Market Analysis, Insights and Forecast - by Indication
- 7.2.1. Alzheimer’s Disease
- 7.2.2. Parkinson’s Disease
- 7.2.3. Multiple Sclerosis
- 7.2.4. Epilepsy
- 7.2.5. Other Indications
- 7.3. Market Analysis, Insights and Forecast - by End User
- 7.3.1. Patients
- 7.3.2. Providers
- 7.3.3. Payers
- 7.3.4. Other End Users
- 7.1. Market Analysis, Insights and Forecast - by Component
- 8. Asia Pacific Digital Neurotherapeutics Market Analysis, Insights and Forecast, 2019-2031
- 8.1. Market Analysis, Insights and Forecast - by Component
- 8.1.1. Software
- 8.1.2. Hardware
- 8.1.3. Services
- 8.2. Market Analysis, Insights and Forecast - by Indication
- 8.2.1. Alzheimer’s Disease
- 8.2.2. Parkinson’s Disease
- 8.2.3. Multiple Sclerosis
- 8.2.4. Epilepsy
- 8.2.5. Other Indications
- 8.3. Market Analysis, Insights and Forecast - by End User
- 8.3.1. Patients
- 8.3.2. Providers
- 8.3.3. Payers
- 8.3.4. Other End Users
- 8.1. Market Analysis, Insights and Forecast - by Component
- 9. Middle East and Africa Digital Neurotherapeutics Market Analysis, Insights and Forecast, 2019-2031
- 9.1. Market Analysis, Insights and Forecast - by Component
- 9.1.1. Software
- 9.1.2. Hardware
- 9.1.3. Services
- 9.2. Market Analysis, Insights and Forecast - by Indication
- 9.2.1. Alzheimer’s Disease
- 9.2.2. Parkinson’s Disease
- 9.2.3. Multiple Sclerosis
- 9.2.4. Epilepsy
- 9.2.5. Other Indications
- 9.3. Market Analysis, Insights and Forecast - by End User
- 9.3.1. Patients
- 9.3.2. Providers
- 9.3.3. Payers
- 9.3.4. Other End Users
- 9.1. Market Analysis, Insights and Forecast - by Component
- 10. South America Digital Neurotherapeutics Market Analysis, Insights and Forecast, 2019-2031
- 10.1. Market Analysis, Insights and Forecast - by Component
- 10.1.1. Software
- 10.1.2. Hardware
- 10.1.3. Services
- 10.2. Market Analysis, Insights and Forecast - by Indication
- 10.2.1. Alzheimer’s Disease
- 10.2.2. Parkinson’s Disease
- 10.2.3. Multiple Sclerosis
- 10.2.4. Epilepsy
- 10.2.5. Other Indications
- 10.3. Market Analysis, Insights and Forecast - by End User
- 10.3.1. Patients
- 10.3.2. Providers
- 10.3.3. Payers
- 10.3.4. Other End Users
- 10.1. Market Analysis, Insights and Forecast - by Component
- 11. Competitive Analysis
- 11.1. Global Market Share Analysis 2024
- 11.2. Company Profiles
- 11.2.1 Akili Inc
- 11.2.1.1. Overview
- 11.2.1.2. Products
- 11.2.1.3. SWOT Analysis
- 11.2.1.4. Recent Developments
- 11.2.1.5. Financials (Based on Availability)
- 11.2.2 AdvancedMD Inc
- 11.2.2.1. Overview
- 11.2.2.2. Products
- 11.2.2.3. SWOT Analysis
- 11.2.2.4. Recent Developments
- 11.2.2.5. Financials (Based on Availability)
- 11.2.3 AppliedVR Inc
- 11.2.3.1. Overview
- 11.2.3.2. Products
- 11.2.3.3. SWOT Analysis
- 11.2.3.4. Recent Developments
- 11.2.3.5. Financials (Based on Availability)
- 11.2.4 BigHealth
- 11.2.4.1. Overview
- 11.2.4.2. Products
- 11.2.4.3. SWOT Analysis
- 11.2.4.4. Recent Developments
- 11.2.4.5. Financials (Based on Availability)
- 11.2.5 Blackrock Neurotech
- 11.2.5.1. Overview
- 11.2.5.2. Products
- 11.2.5.3. SWOT Analysis
- 11.2.5.4. Recent Developments
- 11.2.5.5. Financials (Based on Availability)
- 11.2.6 Cognivive Inc
- 11.2.6.1. Overview
- 11.2.6.2. Products
- 11.2.6.3. SWOT Analysis
- 11.2.6.4. Recent Developments
- 11.2.6.5. Financials (Based on Availability)
- 11.2.7 Neofect Co Ltd
- 11.2.7.1. Overview
- 11.2.7.2. Products
- 11.2.7.3. SWOT Analysis
- 11.2.7.4. Recent Developments
- 11.2.7.5. Financials (Based on Availability)
- 11.2.8 Omada Health Inc
- 11.2.8.1. Overview
- 11.2.8.2. Products
- 11.2.8.3. SWOT Analysis
- 11.2.8.4. Recent Developments
- 11.2.8.5. Financials (Based on Availability)
- 11.2.9 Neurotherapeutic Pediatric Therapies Inc
- 11.2.9.1. Overview
- 11.2.9.2. Products
- 11.2.9.3. SWOT Analysis
- 11.2.9.4. Recent Developments
- 11.2.9.5. Financials (Based on Availability)
- 11.2.10 Mindmaze*List Not Exhaustive
- 11.2.10.1. Overview
- 11.2.10.2. Products
- 11.2.10.3. SWOT Analysis
- 11.2.10.4. Recent Developments
- 11.2.10.5. Financials (Based on Availability)
- 11.2.1 Akili Inc
List of Figures
- Figure 1: Global Digital Neurotherapeutics Market Revenue Breakdown (Million, %) by Region 2024 & 2032
- Figure 2: Global Digital Neurotherapeutics Market Volume Breakdown (Million, %) by Region 2024 & 2032
- Figure 3: North America Digital Neurotherapeutics Market Revenue (Million), by Component 2024 & 2032
- Figure 4: North America Digital Neurotherapeutics Market Volume (Million), by Component 2024 & 2032
- Figure 5: North America Digital Neurotherapeutics Market Revenue Share (%), by Component 2024 & 2032
- Figure 6: North America Digital Neurotherapeutics Market Volume Share (%), by Component 2024 & 2032
- Figure 7: North America Digital Neurotherapeutics Market Revenue (Million), by Indication 2024 & 2032
- Figure 8: North America Digital Neurotherapeutics Market Volume (Million), by Indication 2024 & 2032
- Figure 9: North America Digital Neurotherapeutics Market Revenue Share (%), by Indication 2024 & 2032
- Figure 10: North America Digital Neurotherapeutics Market Volume Share (%), by Indication 2024 & 2032
- Figure 11: North America Digital Neurotherapeutics Market Revenue (Million), by End User 2024 & 2032
- Figure 12: North America Digital Neurotherapeutics Market Volume (Million), by End User 2024 & 2032
- Figure 13: North America Digital Neurotherapeutics Market Revenue Share (%), by End User 2024 & 2032
- Figure 14: North America Digital Neurotherapeutics Market Volume Share (%), by End User 2024 & 2032
- Figure 15: North America Digital Neurotherapeutics Market Revenue (Million), by Country 2024 & 2032
- Figure 16: North America Digital Neurotherapeutics Market Volume (Million), by Country 2024 & 2032
- Figure 17: North America Digital Neurotherapeutics Market Revenue Share (%), by Country 2024 & 2032
- Figure 18: North America Digital Neurotherapeutics Market Volume Share (%), by Country 2024 & 2032
- Figure 19: Europe Digital Neurotherapeutics Market Revenue (Million), by Component 2024 & 2032
- Figure 20: Europe Digital Neurotherapeutics Market Volume (Million), by Component 2024 & 2032
- Figure 21: Europe Digital Neurotherapeutics Market Revenue Share (%), by Component 2024 & 2032
- Figure 22: Europe Digital Neurotherapeutics Market Volume Share (%), by Component 2024 & 2032
- Figure 23: Europe Digital Neurotherapeutics Market Revenue (Million), by Indication 2024 & 2032
- Figure 24: Europe Digital Neurotherapeutics Market Volume (Million), by Indication 2024 & 2032
- Figure 25: Europe Digital Neurotherapeutics Market Revenue Share (%), by Indication 2024 & 2032
- Figure 26: Europe Digital Neurotherapeutics Market Volume Share (%), by Indication 2024 & 2032
- Figure 27: Europe Digital Neurotherapeutics Market Revenue (Million), by End User 2024 & 2032
- Figure 28: Europe Digital Neurotherapeutics Market Volume (Million), by End User 2024 & 2032
- Figure 29: Europe Digital Neurotherapeutics Market Revenue Share (%), by End User 2024 & 2032
- Figure 30: Europe Digital Neurotherapeutics Market Volume Share (%), by End User 2024 & 2032
- Figure 31: Europe Digital Neurotherapeutics Market Revenue (Million), by Country 2024 & 2032
- Figure 32: Europe Digital Neurotherapeutics Market Volume (Million), by Country 2024 & 2032
- Figure 33: Europe Digital Neurotherapeutics Market Revenue Share (%), by Country 2024 & 2032
- Figure 34: Europe Digital Neurotherapeutics Market Volume Share (%), by Country 2024 & 2032
- Figure 35: Asia Pacific Digital Neurotherapeutics Market Revenue (Million), by Component 2024 & 2032
- Figure 36: Asia Pacific Digital Neurotherapeutics Market Volume (Million), by Component 2024 & 2032
- Figure 37: Asia Pacific Digital Neurotherapeutics Market Revenue Share (%), by Component 2024 & 2032
- Figure 38: Asia Pacific Digital Neurotherapeutics Market Volume Share (%), by Component 2024 & 2032
- Figure 39: Asia Pacific Digital Neurotherapeutics Market Revenue (Million), by Indication 2024 & 2032
- Figure 40: Asia Pacific Digital Neurotherapeutics Market Volume (Million), by Indication 2024 & 2032
- Figure 41: Asia Pacific Digital Neurotherapeutics Market Revenue Share (%), by Indication 2024 & 2032
- Figure 42: Asia Pacific Digital Neurotherapeutics Market Volume Share (%), by Indication 2024 & 2032
- Figure 43: Asia Pacific Digital Neurotherapeutics Market Revenue (Million), by End User 2024 & 2032
- Figure 44: Asia Pacific Digital Neurotherapeutics Market Volume (Million), by End User 2024 & 2032
- Figure 45: Asia Pacific Digital Neurotherapeutics Market Revenue Share (%), by End User 2024 & 2032
- Figure 46: Asia Pacific Digital Neurotherapeutics Market Volume Share (%), by End User 2024 & 2032
- Figure 47: Asia Pacific Digital Neurotherapeutics Market Revenue (Million), by Country 2024 & 2032
- Figure 48: Asia Pacific Digital Neurotherapeutics Market Volume (Million), by Country 2024 & 2032
- Figure 49: Asia Pacific Digital Neurotherapeutics Market Revenue Share (%), by Country 2024 & 2032
- Figure 50: Asia Pacific Digital Neurotherapeutics Market Volume Share (%), by Country 2024 & 2032
- Figure 51: Middle East and Africa Digital Neurotherapeutics Market Revenue (Million), by Component 2024 & 2032
- Figure 52: Middle East and Africa Digital Neurotherapeutics Market Volume (Million), by Component 2024 & 2032
- Figure 53: Middle East and Africa Digital Neurotherapeutics Market Revenue Share (%), by Component 2024 & 2032
- Figure 54: Middle East and Africa Digital Neurotherapeutics Market Volume Share (%), by Component 2024 & 2032
- Figure 55: Middle East and Africa Digital Neurotherapeutics Market Revenue (Million), by Indication 2024 & 2032
- Figure 56: Middle East and Africa Digital Neurotherapeutics Market Volume (Million), by Indication 2024 & 2032
- Figure 57: Middle East and Africa Digital Neurotherapeutics Market Revenue Share (%), by Indication 2024 & 2032
- Figure 58: Middle East and Africa Digital Neurotherapeutics Market Volume Share (%), by Indication 2024 & 2032
- Figure 59: Middle East and Africa Digital Neurotherapeutics Market Revenue (Million), by End User 2024 & 2032
- Figure 60: Middle East and Africa Digital Neurotherapeutics Market Volume (Million), by End User 2024 & 2032
- Figure 61: Middle East and Africa Digital Neurotherapeutics Market Revenue Share (%), by End User 2024 & 2032
- Figure 62: Middle East and Africa Digital Neurotherapeutics Market Volume Share (%), by End User 2024 & 2032
- Figure 63: Middle East and Africa Digital Neurotherapeutics Market Revenue (Million), by Country 2024 & 2032
- Figure 64: Middle East and Africa Digital Neurotherapeutics Market Volume (Million), by Country 2024 & 2032
- Figure 65: Middle East and Africa Digital Neurotherapeutics Market Revenue Share (%), by Country 2024 & 2032
- Figure 66: Middle East and Africa Digital Neurotherapeutics Market Volume Share (%), by Country 2024 & 2032
- Figure 67: South America Digital Neurotherapeutics Market Revenue (Million), by Component 2024 & 2032
- Figure 68: South America Digital Neurotherapeutics Market Volume (Million), by Component 2024 & 2032
- Figure 69: South America Digital Neurotherapeutics Market Revenue Share (%), by Component 2024 & 2032
- Figure 70: South America Digital Neurotherapeutics Market Volume Share (%), by Component 2024 & 2032
- Figure 71: South America Digital Neurotherapeutics Market Revenue (Million), by Indication 2024 & 2032
- Figure 72: South America Digital Neurotherapeutics Market Volume (Million), by Indication 2024 & 2032
- Figure 73: South America Digital Neurotherapeutics Market Revenue Share (%), by Indication 2024 & 2032
- Figure 74: South America Digital Neurotherapeutics Market Volume Share (%), by Indication 2024 & 2032
- Figure 75: South America Digital Neurotherapeutics Market Revenue (Million), by End User 2024 & 2032
- Figure 76: South America Digital Neurotherapeutics Market Volume (Million), by End User 2024 & 2032
- Figure 77: South America Digital Neurotherapeutics Market Revenue Share (%), by End User 2024 & 2032
- Figure 78: South America Digital Neurotherapeutics Market Volume Share (%), by End User 2024 & 2032
- Figure 79: South America Digital Neurotherapeutics Market Revenue (Million), by Country 2024 & 2032
- Figure 80: South America Digital Neurotherapeutics Market Volume (Million), by Country 2024 & 2032
- Figure 81: South America Digital Neurotherapeutics Market Revenue Share (%), by Country 2024 & 2032
- Figure 82: South America Digital Neurotherapeutics Market Volume Share (%), by Country 2024 & 2032
List of Tables
- Table 1: Global Digital Neurotherapeutics Market Revenue Million Forecast, by Region 2019 & 2032
- Table 2: Global Digital Neurotherapeutics Market Volume Million Forecast, by Region 2019 & 2032
- Table 3: Global Digital Neurotherapeutics Market Revenue Million Forecast, by Component 2019 & 2032
- Table 4: Global Digital Neurotherapeutics Market Volume Million Forecast, by Component 2019 & 2032
- Table 5: Global Digital Neurotherapeutics Market Revenue Million Forecast, by Indication 2019 & 2032
- Table 6: Global Digital Neurotherapeutics Market Volume Million Forecast, by Indication 2019 & 2032
- Table 7: Global Digital Neurotherapeutics Market Revenue Million Forecast, by End User 2019 & 2032
- Table 8: Global Digital Neurotherapeutics Market Volume Million Forecast, by End User 2019 & 2032
- Table 9: Global Digital Neurotherapeutics Market Revenue Million Forecast, by Region 2019 & 2032
- Table 10: Global Digital Neurotherapeutics Market Volume Million Forecast, by Region 2019 & 2032
- Table 11: Global Digital Neurotherapeutics Market Revenue Million Forecast, by Component 2019 & 2032
- Table 12: Global Digital Neurotherapeutics Market Volume Million Forecast, by Component 2019 & 2032
- Table 13: Global Digital Neurotherapeutics Market Revenue Million Forecast, by Indication 2019 & 2032
- Table 14: Global Digital Neurotherapeutics Market Volume Million Forecast, by Indication 2019 & 2032
- Table 15: Global Digital Neurotherapeutics Market Revenue Million Forecast, by End User 2019 & 2032
- Table 16: Global Digital Neurotherapeutics Market Volume Million Forecast, by End User 2019 & 2032
- Table 17: Global Digital Neurotherapeutics Market Revenue Million Forecast, by Country 2019 & 2032
- Table 18: Global Digital Neurotherapeutics Market Volume Million Forecast, by Country 2019 & 2032
- Table 19: United States Digital Neurotherapeutics Market Revenue (Million) Forecast, by Application 2019 & 2032
- Table 20: United States Digital Neurotherapeutics Market Volume (Million) Forecast, by Application 2019 & 2032
- Table 21: Canada Digital Neurotherapeutics Market Revenue (Million) Forecast, by Application 2019 & 2032
- Table 22: Canada Digital Neurotherapeutics Market Volume (Million) Forecast, by Application 2019 & 2032
- Table 23: Mexico Digital Neurotherapeutics Market Revenue (Million) Forecast, by Application 2019 & 2032
- Table 24: Mexico Digital Neurotherapeutics Market Volume (Million) Forecast, by Application 2019 & 2032
- Table 25: Global Digital Neurotherapeutics Market Revenue Million Forecast, by Component 2019 & 2032
- Table 26: Global Digital Neurotherapeutics Market Volume Million Forecast, by Component 2019 & 2032
- Table 27: Global Digital Neurotherapeutics Market Revenue Million Forecast, by Indication 2019 & 2032
- Table 28: Global Digital Neurotherapeutics Market Volume Million Forecast, by Indication 2019 & 2032
- Table 29: Global Digital Neurotherapeutics Market Revenue Million Forecast, by End User 2019 & 2032
- Table 30: Global Digital Neurotherapeutics Market Volume Million Forecast, by End User 2019 & 2032
- Table 31: Global Digital Neurotherapeutics Market Revenue Million Forecast, by Country 2019 & 2032
- Table 32: Global Digital Neurotherapeutics Market Volume Million Forecast, by Country 2019 & 2032
- Table 33: Germany Digital Neurotherapeutics Market Revenue (Million) Forecast, by Application 2019 & 2032
- Table 34: Germany Digital Neurotherapeutics Market Volume (Million) Forecast, by Application 2019 & 2032
- Table 35: United Kingdom Digital Neurotherapeutics Market Revenue (Million) Forecast, by Application 2019 & 2032
- Table 36: United Kingdom Digital Neurotherapeutics Market Volume (Million) Forecast, by Application 2019 & 2032
- Table 37: France Digital Neurotherapeutics Market Revenue (Million) Forecast, by Application 2019 & 2032
- Table 38: France Digital Neurotherapeutics Market Volume (Million) Forecast, by Application 2019 & 2032
- Table 39: Italy Digital Neurotherapeutics Market Revenue (Million) Forecast, by Application 2019 & 2032
- Table 40: Italy Digital Neurotherapeutics Market Volume (Million) Forecast, by Application 2019 & 2032
- Table 41: Spain Digital Neurotherapeutics Market Revenue (Million) Forecast, by Application 2019 & 2032
- Table 42: Spain Digital Neurotherapeutics Market Volume (Million) Forecast, by Application 2019 & 2032
- Table 43: Rest of Europe Digital Neurotherapeutics Market Revenue (Million) Forecast, by Application 2019 & 2032
- Table 44: Rest of Europe Digital Neurotherapeutics Market Volume (Million) Forecast, by Application 2019 & 2032
- Table 45: Global Digital Neurotherapeutics Market Revenue Million Forecast, by Component 2019 & 2032
- Table 46: Global Digital Neurotherapeutics Market Volume Million Forecast, by Component 2019 & 2032
- Table 47: Global Digital Neurotherapeutics Market Revenue Million Forecast, by Indication 2019 & 2032
- Table 48: Global Digital Neurotherapeutics Market Volume Million Forecast, by Indication 2019 & 2032
- Table 49: Global Digital Neurotherapeutics Market Revenue Million Forecast, by End User 2019 & 2032
- Table 50: Global Digital Neurotherapeutics Market Volume Million Forecast, by End User 2019 & 2032
- Table 51: Global Digital Neurotherapeutics Market Revenue Million Forecast, by Country 2019 & 2032
- Table 52: Global Digital Neurotherapeutics Market Volume Million Forecast, by Country 2019 & 2032
- Table 53: China Digital Neurotherapeutics Market Revenue (Million) Forecast, by Application 2019 & 2032
- Table 54: China Digital Neurotherapeutics Market Volume (Million) Forecast, by Application 2019 & 2032
- Table 55: Japan Digital Neurotherapeutics Market Revenue (Million) Forecast, by Application 2019 & 2032
- Table 56: Japan Digital Neurotherapeutics Market Volume (Million) Forecast, by Application 2019 & 2032
- Table 57: India Digital Neurotherapeutics Market Revenue (Million) Forecast, by Application 2019 & 2032
- Table 58: India Digital Neurotherapeutics Market Volume (Million) Forecast, by Application 2019 & 2032
- Table 59: Australia Digital Neurotherapeutics Market Revenue (Million) Forecast, by Application 2019 & 2032
- Table 60: Australia Digital Neurotherapeutics Market Volume (Million) Forecast, by Application 2019 & 2032
- Table 61: South Korea Digital Neurotherapeutics Market Revenue (Million) Forecast, by Application 2019 & 2032
- Table 62: South Korea Digital Neurotherapeutics Market Volume (Million) Forecast, by Application 2019 & 2032
- Table 63: Rest of Asia Pacific Digital Neurotherapeutics Market Revenue (Million) Forecast, by Application 2019 & 2032
- Table 64: Rest of Asia Pacific Digital Neurotherapeutics Market Volume (Million) Forecast, by Application 2019 & 2032
- Table 65: Global Digital Neurotherapeutics Market Revenue Million Forecast, by Component 2019 & 2032
- Table 66: Global Digital Neurotherapeutics Market Volume Million Forecast, by Component 2019 & 2032
- Table 67: Global Digital Neurotherapeutics Market Revenue Million Forecast, by Indication 2019 & 2032
- Table 68: Global Digital Neurotherapeutics Market Volume Million Forecast, by Indication 2019 & 2032
- Table 69: Global Digital Neurotherapeutics Market Revenue Million Forecast, by End User 2019 & 2032
- Table 70: Global Digital Neurotherapeutics Market Volume Million Forecast, by End User 2019 & 2032
- Table 71: Global Digital Neurotherapeutics Market Revenue Million Forecast, by Country 2019 & 2032
- Table 72: Global Digital Neurotherapeutics Market Volume Million Forecast, by Country 2019 & 2032
- Table 73: GCC Digital Neurotherapeutics Market Revenue (Million) Forecast, by Application 2019 & 2032
- Table 74: GCC Digital Neurotherapeutics Market Volume (Million) Forecast, by Application 2019 & 2032
- Table 75: South Africa Digital Neurotherapeutics Market Revenue (Million) Forecast, by Application 2019 & 2032
- Table 76: South Africa Digital Neurotherapeutics Market Volume (Million) Forecast, by Application 2019 & 2032
- Table 77: Rest of Middle East and Africa Digital Neurotherapeutics Market Revenue (Million) Forecast, by Application 2019 & 2032
- Table 78: Rest of Middle East and Africa Digital Neurotherapeutics Market Volume (Million) Forecast, by Application 2019 & 2032
- Table 79: Global Digital Neurotherapeutics Market Revenue Million Forecast, by Component 2019 & 2032
- Table 80: Global Digital Neurotherapeutics Market Volume Million Forecast, by Component 2019 & 2032
- Table 81: Global Digital Neurotherapeutics Market Revenue Million Forecast, by Indication 2019 & 2032
- Table 82: Global Digital Neurotherapeutics Market Volume Million Forecast, by Indication 2019 & 2032
- Table 83: Global Digital Neurotherapeutics Market Revenue Million Forecast, by End User 2019 & 2032
- Table 84: Global Digital Neurotherapeutics Market Volume Million Forecast, by End User 2019 & 2032
- Table 85: Global Digital Neurotherapeutics Market Revenue Million Forecast, by Country 2019 & 2032
- Table 86: Global Digital Neurotherapeutics Market Volume Million Forecast, by Country 2019 & 2032
- Table 87: Brazil Digital Neurotherapeutics Market Revenue (Million) Forecast, by Application 2019 & 2032
- Table 88: Brazil Digital Neurotherapeutics Market Volume (Million) Forecast, by Application 2019 & 2032
- Table 89: Argentina Digital Neurotherapeutics Market Revenue (Million) Forecast, by Application 2019 & 2032
- Table 90: Argentina Digital Neurotherapeutics Market Volume (Million) Forecast, by Application 2019 & 2032
- Table 91: Rest of South America Digital Neurotherapeutics Market Revenue (Million) Forecast, by Application 2019 & 2032
- Table 92: Rest of South America Digital Neurotherapeutics Market Volume (Million) Forecast, by Application 2019 & 2032
Frequently Asked Questions
1. What is the projected Compound Annual Growth Rate (CAGR) of the Digital Neurotherapeutics Market?
The projected CAGR is approximately 19.50%.
2. Which companies are prominent players in the Digital Neurotherapeutics Market?
Key companies in the market include Akili Inc, AdvancedMD Inc, AppliedVR Inc, BigHealth, Blackrock Neurotech, Cognivive Inc, Neofect Co Ltd, Omada Health Inc, Neurotherapeutic Pediatric Therapies Inc, Mindmaze*List Not Exhaustive.
3. What are the main segments of the Digital Neurotherapeutics Market?
The market segments include Component, Indication, End User.
4. Can you provide details about the market size?
The market size is estimated to be USD 362.63 Million as of 2022.
5. What are some drivers contributing to market growth?
Rising Prevalence of Neurological Disorders; Growing Adoption of Digital Technology in Neurology Care.
6. What are the notable trends driving market growth?
The Multiple Sclerosis Segment is Expected to Hold Significant Market Share Over the Forecast Period.
7. Are there any restraints impacting market growth?
Rising Prevalence of Neurological Disorders; Growing Adoption of Digital Technology in Neurology Care.
8. Can you provide examples of recent developments in the market?
February 2024: The University of London's neurotherapeutics group launched the iTalkBetter app. This app provides speech therapy for people with language disorder aphasia, which has been found to improve their ability to talk significantly.
9. What pricing options are available for accessing the report?
Pricing options include single-user, multi-user, and enterprise licenses priced at USD 4750, USD 5250, and USD 8750 respectively.
10. Is the market size provided in terms of value or volume?
The market size is provided in terms of value, measured in Million and volume, measured in Million.
11. Are there any specific market keywords associated with the report?
Yes, the market keyword associated with the report is "Digital Neurotherapeutics Market," which aids in identifying and referencing the specific market segment covered.
12. How do I determine which pricing option suits my needs best?
The pricing options vary based on user requirements and access needs. Individual users may opt for single-user licenses, while businesses requiring broader access may choose multi-user or enterprise licenses for cost-effective access to the report.
13. Are there any additional resources or data provided in the Digital Neurotherapeutics Market report?
While the report offers comprehensive insights, it's advisable to review the specific contents or supplementary materials provided to ascertain if additional resources or data are available.
14. How can I stay updated on further developments or reports in the Digital Neurotherapeutics Market?
To stay informed about further developments, trends, and reports in the Digital Neurotherapeutics Market, consider subscribing to industry newsletters, following relevant companies and organizations, or regularly checking reputable industry news sources and publications.
Methodology
Step 1 - Identification of Relevant Samples Size from Population Database


Step 2 - Approaches for Defining Global Market Size (Value, Volume* & Price*)

Note*: In applicable scenarios
Step 3 - Data Sources
Primary Research
- Web Analytics
- Survey Reports
- Research Institute
- Latest Research Reports
- Opinion Leaders
Secondary Research
- Annual Reports
- White Paper
- Latest Press Release
- Industry Association
- Paid Database
- Investor Presentations

Step 4 - Data Triangulation
Involves using different sources of information in order to increase the validity of a study
These sources are likely to be stakeholders in a program - participants, other researchers, program staff, other community members, and so on.
Then we put all data in single framework & apply various statistical tools to find out the dynamic on the market.
During the analysis stage, feedback from the stakeholder groups would be compared to determine areas of agreement as well as areas of divergence
