

Key Insights
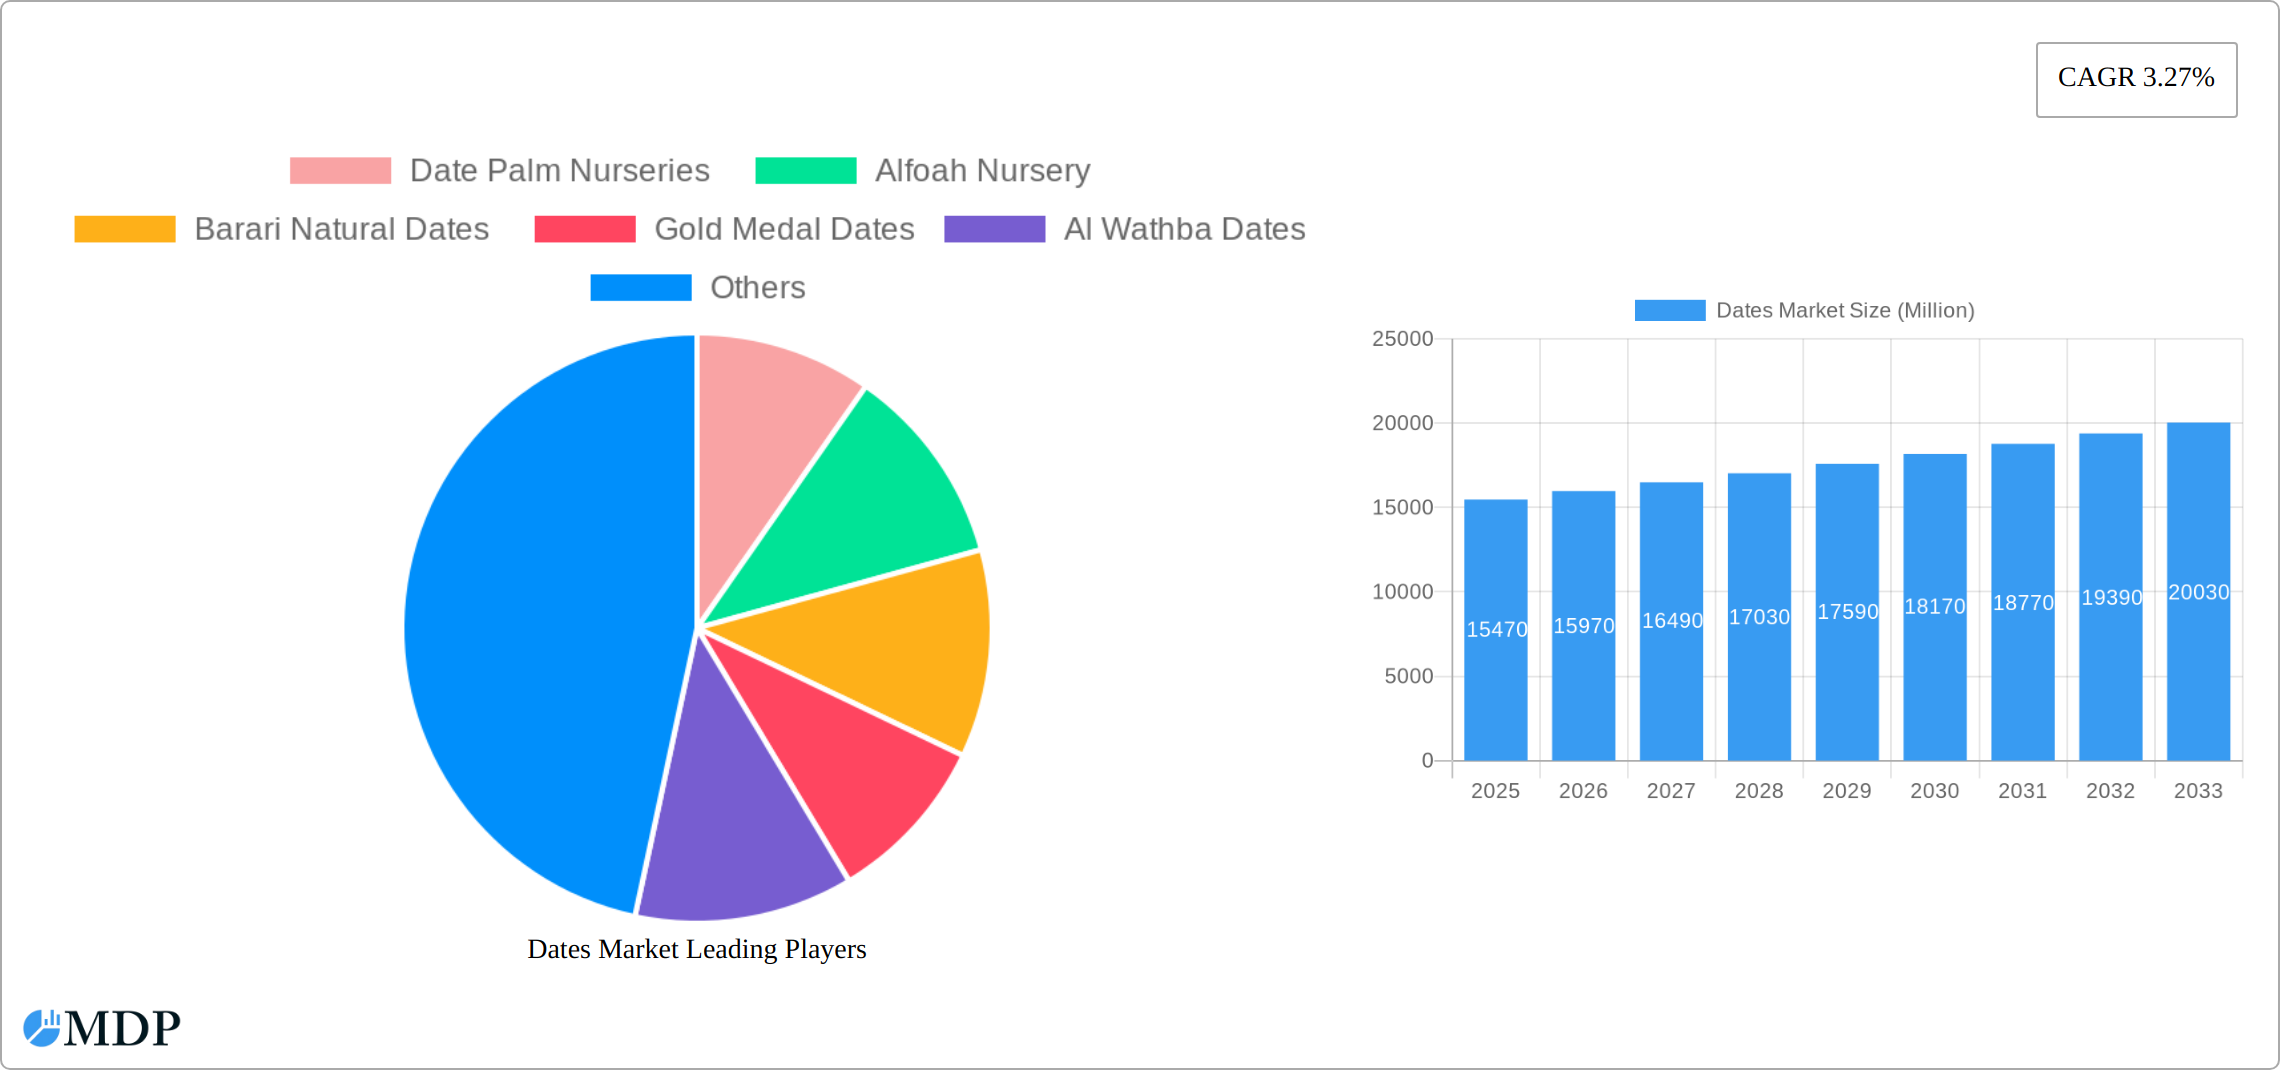
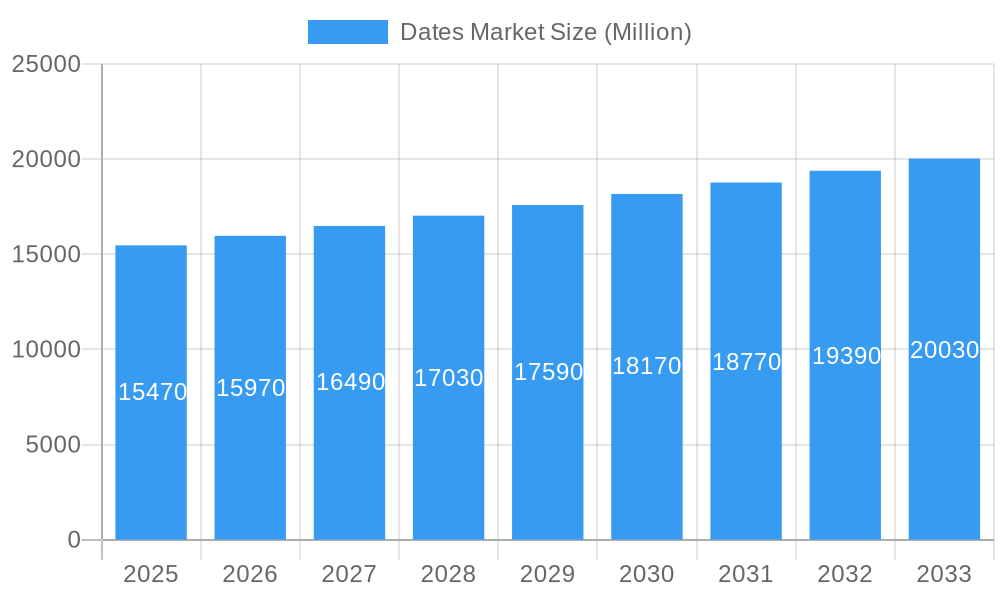
The global dates market, valued at $15.47 billion in 2025, is projected to experience steady growth, exhibiting a Compound Annual Growth Rate (CAGR) of 3.27% from 2025 to 2033. This growth is fueled by several key factors. Increasing consumer awareness of the health benefits associated with dates – a natural source of fiber, potassium, and antioxidants – is driving demand, particularly among health-conscious individuals. The rising popularity of dates in various food and beverage applications, including confectionery, energy bars, and smoothies, further contributes to market expansion. Furthermore, the growing global population and increasing disposable incomes in developing economies are creating a larger consumer base for this versatile fruit. While logistical challenges related to date harvesting and preservation might pose some restraints, ongoing innovation in processing and packaging technologies is mitigating these issues. The Medjool variety consistently holds a significant market share due to its superior taste and texture, while the growing demand for organic and sustainably sourced dates presents a lucrative segment for producers focusing on ethical and environmentally conscious practices. Regional growth patterns show a strong presence in the Middle East and Africa, the traditional heartland of date production, but increasing import and consumption in North America and Europe indicate promising avenues for market expansion in these regions.
Dates Market Market Size (In Billion)
The segmentation of the dates market reveals diverse opportunities. By type, Medjool and Deglet Noor varieties dominate due to their widespread acceptance and availability. However, other types like Khalas, Sayer, and Sukari are gaining traction as consumers explore a wider variety of flavors and textures. Application-wise, the food sector forms a major segment, followed by beverage and confectionery applications. The "other" segment encompasses various uses like animal feed and traditional medicine, highlighting the diverse applications of dates. The competitive landscape is characterized by a mix of established players, including large-scale producers and smaller, niche players focused on organic or specialty dates. Growth strategies among these companies often involve product diversification, expansion into new markets, and increased emphasis on branding and marketing efforts to leverage the growing consumer interest in healthy and natural foods.
Dates Market Company Market Share
Dates Market Report: A Comprehensive Analysis (2019-2033)
This comprehensive report provides an in-depth analysis of the global Dates Market, offering invaluable insights for industry stakeholders, investors, and businesses seeking to navigate this dynamic sector. With a study period spanning 2019-2033, a base year of 2025, and a forecast period of 2025-2033, this report leverages historical data (2019-2024) to project future market trends and growth opportunities. The report covers key market segments (Medjool, Deglet Noor, Khalas, Sayer, Sukari by type; Food, Beverage, Confectionery, Other by application), major players (including Date Palm Nurseries, Alfoah Nursery, Barari Natural Dates, Gold Medal Dates, and Al Wathba Dates), and significant industry developments. Expect detailed analysis of market size (in Millions), CAGR, market share, and key growth drivers, enabling informed decision-making in this lucrative market.
Dates Market Dynamics & Concentration
The global dates market exhibits a moderately concentrated structure, with a few large players commanding significant market share. However, the market also accommodates numerous smaller regional producers and specialized processors. Market concentration is influenced by factors such as economies of scale in production and processing, brand recognition, and access to distribution channels. The market share of the top 5 players is estimated at xx% in 2025.
- Innovation Drivers: Continuous innovation in cultivation techniques, processing technologies (e.g., improved preservation methods, value-added product development), and packaging solutions are driving market growth.
- Regulatory Frameworks: Government regulations concerning food safety, labeling, and trade significantly impact market operations. Variations in these regulations across different regions create complexities for international players.
- Product Substitutes: The market faces competition from other dried fruits and sweeteners, impacting demand depending on price fluctuations and consumer preferences.
- End-User Trends: Growing consumer awareness of health benefits and increasing demand for natural and organic products are major growth catalysts. The rise of veganism and flexitarianism further boosts demand.
- M&A Activities: The number of mergers and acquisitions in the dates market during the historical period (2019-2024) averaged xx deals per year. Consolidation is anticipated to continue, particularly among medium-sized companies seeking to expand their market reach and product portfolios.
Dates Market Industry Trends & Analysis
The global dates market is experiencing robust growth, driven by several factors. The compound annual growth rate (CAGR) is projected to be xx% during the forecast period (2025-2033). Market penetration is highest in regions with established date cultivation and strong cultural ties to the product. Technological advancements in irrigation and pest control are improving yields and enhancing the quality of dates.
Technological disruptions, such as the introduction of automated harvesting and processing equipment, are streamlining operations and reducing costs. Consumer preferences are shifting towards premium and specialized date varieties, creating opportunities for value-added products such as date syrups, date paste, and date-based confectionery. The competitive dynamics are characterized by both intense competition among established players and the emergence of new entrants driven by the market's growth potential.
Leading Markets & Segments in Dates Market
The Middle East and North Africa (MENA) region remains the global epicenter for date production and consumption, commanding approximately 70% of the market share in 2025. Within this region, Saudi Arabia and the United Arab Emirates are key players, but significant growth is also observed in other North African nations and parts of Asia. This expansion is driven by factors including rising disposable incomes, increased health awareness, and the diversification of culinary preferences.
By Type: Medjool dates maintain the largest market share due to their superior taste and texture, followed by Deglet Noor and Khalas varieties. The market is also witnessing increased interest in lesser-known, yet flavorful, varieties, further diversifying consumer choice.
By Application: The food industry remains the primary consumer of dates, followed by confectionery and beverage sectors. The "Other" category, encompassing applications in animal feed, cosmetics, and pharmaceuticals, highlights the remarkable versatility of dates and presents opportunities for future market expansion.
Key Drivers in Leading Regions:
- MENA: Long-standing cultivation expertise, a favorable climate, deep-rooted cultural significance, and government support for date palm cultivation contribute to the region's dominance.
- Other Regions: The rising global awareness of dates' nutritional benefits, coupled with increasing disposable incomes and import opportunities, fuels growth in these emerging markets. Furthermore, the increasing demand for natural and organic food products significantly contributes to market expansion.
Dates Market Product Developments
Recent product innovations are focused on extending shelf life, enhancing flavor profiles, and exploring novel applications. The introduction of date-based functional foods and beverages, tailored to meet specific health needs, has gained significant traction. Technological advancements, such as improved packaging materials (e.g., modified atmosphere packaging and sustainable alternatives) and processing techniques, are enhancing product preservation and quality. A noticeable trend is the increasing demand for organic and sustainably produced dates, reflecting growing consumer preference for ethically sourced and environmentally friendly products. These product innovations provide a significant competitive edge, attracting specific consumer segments and expanding market penetration.
Key Drivers of Dates Market Growth
The robust growth of the dates market is driven by several key factors:
- Rising health consciousness: Dates are a nutritional powerhouse, rich in vitamins, minerals, and fiber, driving their consumption as a healthy snack and ingredient in various food products.
- Expanding applications: Continuous innovation expands the applications of dates beyond traditional consumption, opening doors to new and diverse markets, such as the functional food and beverage sectors.
- Government initiatives: Government support and policies aimed at promoting date cultivation, research, and industry development significantly bolster market growth.
- Technological advancements: Improvements in cultivation techniques, processing methods, and preservation technologies enhance the sector's efficiency, quality, and profitability.
- Evolving Consumer Preferences: The shift towards healthier, natural, and sustainable food choices fuels demand for high-quality dates.
Challenges in the Dates Market Market
Several factors impede the dates market's growth:
- Seasonal variations: Date production is seasonal, leading to supply fluctuations and impacting price stability.
- Pest and disease control: Maintaining healthy date palm groves requires robust pest and disease management strategies.
- Competition from substitutes: Other dried fruits and sweeteners pose competitive challenges.
- Supply chain inefficiencies: Optimization is needed in logistical and transportation networks to reduce costs and waste.
Emerging Opportunities in Dates Market
Emerging opportunities stem from:
- Value-added products: Developing processed date products such as date syrup, flour, and energy bars holds significant potential.
- Strategic partnerships: Collaboration among producers, processors, and retailers can improve efficiency and market access.
- Market expansion: Targeting new consumer markets globally through effective marketing strategies and diversified distribution channels.
Leading Players in the Dates Market Sector
- Date Palm Nurseries
- Alfoah Nursery
- Barari Natural Dates
- Gold Medal Dates
- Al Wathba Dates
Key Milestones in Dates Market Industry
- October 2022: Morocco's ambitious strategy to double its date production by 2030 signals significant investment and expansion in the North African date market.
- April 2022: The launch of the 'Saudidates' platform revolutionized B2B trade in Saudi Arabian dates, enhancing market modernization and global accessibility.
- Ongoing Developments: Increased investment in research and development is leading to the development of new date-based products and improved cultivation methods, further solidifying the market's future.
Strategic Outlook for Dates Market Market
The dates market presents substantial growth potential fueled by surging demand, product diversification, and continuous technological advancements. Strategic opportunities include expanding into untapped geographic markets, creating value-added products, leveraging technological innovations to increase efficiency and sustainability, and building robust and resilient supply chains. A strong focus on sustainable production practices, coupled with meeting the growing consumer demand for natural and organic products, will be crucial for long-term success and market leadership in this dynamic sector.
Dates Market Segmentation
- 1. Production Analysis
- 2. Consumption Analysis
- 3. Import Market Analysis (Value & Volume)
- 4. Export Market Analysis (Value & Volume)
- 5. Price Trend Analysis
Dates Market Segmentation By Geography
-
1. North America
- 1.1. United States
- 1.2. Canada
-
2. Europe
- 2.1. Germany
- 2.2. United Kingdom
- 2.3. France
- 2.4. Netherlands
- 2.5. Italy
-
3. Asia Pacific
- 3.1. India
- 3.2. Indonesia
- 3.3. Malaysia
- 3.4. Pakistan
-
4. South America
- 4.1. Brazil
- 4.2. Argentina
-
5. Middle East and Africa
- 5.1. Unites Arab Emirates
- 5.2. Saudi Arabia
- 5.3. Oman
- 5.4. Egypt
- 5.5. Morocco
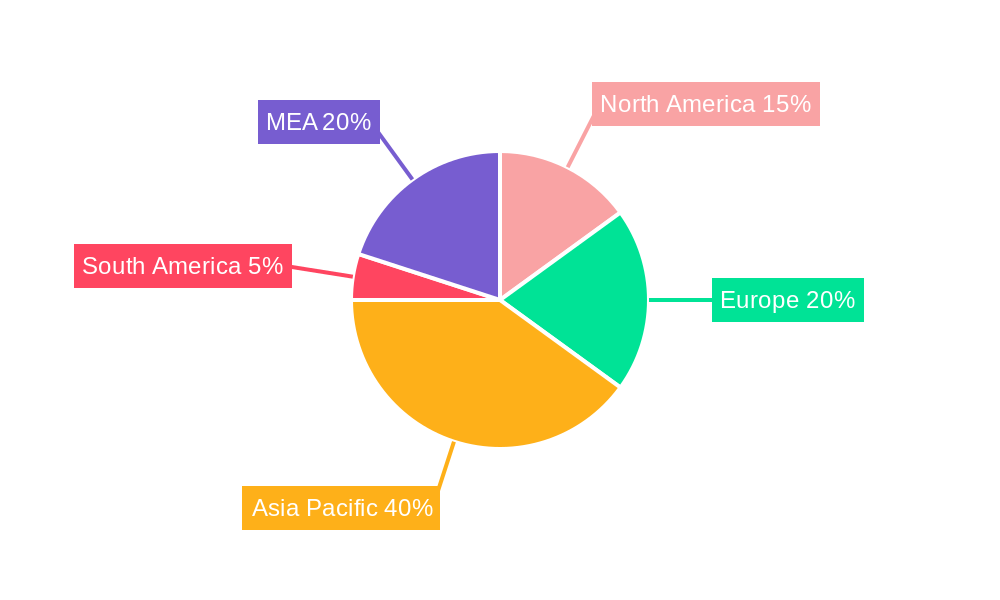
Dates Market Regional Market Share
Geographic Coverage of Dates Market
Dates Market REPORT HIGHLIGHTS
| Aspects | Details |
|---|---|
| Study Period | 2020-2034 |
| Base Year | 2025 |
| Estimated Year | 2026 |
| Forecast Period | 2026-2034 |
| Historical Period | 2020-2025 |
| Growth Rate | CAGR of 3.27% from 2020-2034 |
| Segmentation |
|
Table of Contents
- 1. Introduction
- 1.1. Research Scope
- 1.2. Market Segmentation
- 1.3. Research Objective
- 1.4. Definitions and Assumptions
- 2. Executive Summary
- 2.1. Market Snapshot
- 3. Market Dynamics
- 3.1. Market Drivers
- 3.2. Market Restrains
- 3.3. Market Trends
- 3.4. Market Opportunities
- 4. Market Factor Analysis
- 4.1. Porters Five Forces
- 4.1.1. Bargaining Power of Suppliers
- 4.1.2. Bargaining Power of Buyers
- 4.1.3. Threat of New Entrants
- 4.1.4. Threat of Substitutes
- 4.1.5. Competitive Rivalry
- 4.2. PESTEL analysis
- 4.3. BCG Analysis
- 4.3.1. Stars (High Growth, High Market Share)
- 4.3.2. Cash Cows (Low Growth, High Market Share)
- 4.3.3. Question Mark (High Growth, Low Market Share)
- 4.3.4. Dogs (Low Growth, Low Market Share)
- 4.4. Ansoff Matrix Analysis
- 4.5. Supply Chain Analysis
- 4.6. Regulatory Landscape
- 4.7. Current Market Potential and Opportunity Assessment (TAM–SAM–SOM Framework)
- 4.8. MDP Analyst Note
- 4.1. Porters Five Forces
- 5. Market Analysis, Insights and Forecast 2021-2033
- 5.1. Market Analysis, Insights and Forecast - by Production Analysis
- 5.2. Market Analysis, Insights and Forecast - by Consumption Analysis
- 5.3. Market Analysis, Insights and Forecast - by Import Market Analysis (Value & Volume)
- 5.4. Market Analysis, Insights and Forecast - by Export Market Analysis (Value & Volume)
- 5.5. Market Analysis, Insights and Forecast - by Price Trend Analysis
- 5.6. Market Analysis, Insights and Forecast - by Region
- 5.6.1. North America
- 5.6.2. Europe
- 5.6.3. Asia Pacific
- 5.6.4. South America
- 5.6.5. Middle East and Africa
- 6. Global Dates Market Analysis, Insights and Forecast, 2021-2033
- 6.1. Market Analysis, Insights and Forecast - by Production Analysis
- 6.2. Market Analysis, Insights and Forecast - by Consumption Analysis
- 6.3. Market Analysis, Insights and Forecast - by Import Market Analysis (Value & Volume)
- 6.4. Market Analysis, Insights and Forecast - by Export Market Analysis (Value & Volume)
- 6.5. Market Analysis, Insights and Forecast - by Price Trend Analysis
- 7. North America Dates Market Analysis, Insights and Forecast, 2020-2032
- 7.1. Market Analysis, Insights and Forecast - by Production Analysis
- 7.2. Market Analysis, Insights and Forecast - by Consumption Analysis
- 7.3. Market Analysis, Insights and Forecast - by Import Market Analysis (Value & Volume)
- 7.4. Market Analysis, Insights and Forecast - by Export Market Analysis (Value & Volume)
- 7.5. Market Analysis, Insights and Forecast - by Price Trend Analysis
- 8. Europe Dates Market Analysis, Insights and Forecast, 2020-2032
- 8.1. Market Analysis, Insights and Forecast - by Production Analysis
- 8.2. Market Analysis, Insights and Forecast - by Consumption Analysis
- 8.3. Market Analysis, Insights and Forecast - by Import Market Analysis (Value & Volume)
- 8.4. Market Analysis, Insights and Forecast - by Export Market Analysis (Value & Volume)
- 8.5. Market Analysis, Insights and Forecast - by Price Trend Analysis
- 9. Asia Pacific Dates Market Analysis, Insights and Forecast, 2020-2032
- 9.1. Market Analysis, Insights and Forecast - by Production Analysis
- 9.2. Market Analysis, Insights and Forecast - by Consumption Analysis
- 9.3. Market Analysis, Insights and Forecast - by Import Market Analysis (Value & Volume)
- 9.4. Market Analysis, Insights and Forecast - by Export Market Analysis (Value & Volume)
- 9.5. Market Analysis, Insights and Forecast - by Price Trend Analysis
- 10. South America Dates Market Analysis, Insights and Forecast, 2020-2032
- 10.1. Market Analysis, Insights and Forecast - by Production Analysis
- 10.2. Market Analysis, Insights and Forecast - by Consumption Analysis
- 10.3. Market Analysis, Insights and Forecast - by Import Market Analysis (Value & Volume)
- 10.4. Market Analysis, Insights and Forecast - by Export Market Analysis (Value & Volume)
- 10.5. Market Analysis, Insights and Forecast - by Price Trend Analysis
- 11. Middle East and Africa Dates Market Analysis, Insights and Forecast, 2020-2032
- 11.1. Market Analysis, Insights and Forecast - by Production Analysis
- 11.2. Market Analysis, Insights and Forecast - by Consumption Analysis
- 11.3. Market Analysis, Insights and Forecast - by Import Market Analysis (Value & Volume)
- 11.4. Market Analysis, Insights and Forecast - by Export Market Analysis (Value & Volume)
- 11.5. Market Analysis, Insights and Forecast - by Price Trend Analysis
- 12. Competitive Analysis
- 12.1. Company Profiles
- 12.1.1 Date Palm Nurseries
- 12.1.1.1. Company Overview
- 12.1.1.2. Products
- 12.1.1.3. Company Financials
- 12.1.1.4. SWOT Analysis
- 12.1.2 Alfoah Nursery
- 12.1.2.1. Company Overview
- 12.1.2.2. Products
- 12.1.2.3. Company Financials
- 12.1.2.4. SWOT Analysis
- 12.1.3 Barari Natural Dates
- 12.1.3.1. Company Overview
- 12.1.3.2. Products
- 12.1.3.3. Company Financials
- 12.1.3.4. SWOT Analysis
- 12.1.4 Gold Medal Dates
- 12.1.4.1. Company Overview
- 12.1.4.2. Products
- 12.1.4.3. Company Financials
- 12.1.4.4. SWOT Analysis
- 12.1.5 Al Wathba Dates
- 12.1.5.1. Company Overview
- 12.1.5.2. Products
- 12.1.5.3. Company Financials
- 12.1.5.4. SWOT Analysis
- 12.1.1 Date Palm Nurseries
- 12.2. Market Entropy
- 12.2.1 Company's Key Areas Served
- 12.2.2 Recent Developments
- 12.3. Company Market Share Analysis 2025
- 12.3.1 Top 5 Companies Market Share Analysis
- 12.3.2 Top 3 Companies Market Share Analysis
- 12.4. List of Potential Customers
- 13. Research Methodology
List of Figures
- Figure 1: Global Dates Market Revenue Breakdown (Million, %) by Region 2025 & 2033
- Figure 2: North America Dates Market Revenue (Million), by Production Analysis 2025 & 2033
- Figure 3: North America Dates Market Revenue Share (%), by Production Analysis 2025 & 2033
- Figure 4: North America Dates Market Revenue (Million), by Consumption Analysis 2025 & 2033
- Figure 5: North America Dates Market Revenue Share (%), by Consumption Analysis 2025 & 2033
- Figure 6: North America Dates Market Revenue (Million), by Import Market Analysis (Value & Volume) 2025 & 2033
- Figure 7: North America Dates Market Revenue Share (%), by Import Market Analysis (Value & Volume) 2025 & 2033
- Figure 8: North America Dates Market Revenue (Million), by Export Market Analysis (Value & Volume) 2025 & 2033
- Figure 9: North America Dates Market Revenue Share (%), by Export Market Analysis (Value & Volume) 2025 & 2033
- Figure 10: North America Dates Market Revenue (Million), by Price Trend Analysis 2025 & 2033
- Figure 11: North America Dates Market Revenue Share (%), by Price Trend Analysis 2025 & 2033
- Figure 12: North America Dates Market Revenue (Million), by Country 2025 & 2033
- Figure 13: North America Dates Market Revenue Share (%), by Country 2025 & 2033
- Figure 14: Europe Dates Market Revenue (Million), by Production Analysis 2025 & 2033
- Figure 15: Europe Dates Market Revenue Share (%), by Production Analysis 2025 & 2033
- Figure 16: Europe Dates Market Revenue (Million), by Consumption Analysis 2025 & 2033
- Figure 17: Europe Dates Market Revenue Share (%), by Consumption Analysis 2025 & 2033
- Figure 18: Europe Dates Market Revenue (Million), by Import Market Analysis (Value & Volume) 2025 & 2033
- Figure 19: Europe Dates Market Revenue Share (%), by Import Market Analysis (Value & Volume) 2025 & 2033
- Figure 20: Europe Dates Market Revenue (Million), by Export Market Analysis (Value & Volume) 2025 & 2033
- Figure 21: Europe Dates Market Revenue Share (%), by Export Market Analysis (Value & Volume) 2025 & 2033
- Figure 22: Europe Dates Market Revenue (Million), by Price Trend Analysis 2025 & 2033
- Figure 23: Europe Dates Market Revenue Share (%), by Price Trend Analysis 2025 & 2033
- Figure 24: Europe Dates Market Revenue (Million), by Country 2025 & 2033
- Figure 25: Europe Dates Market Revenue Share (%), by Country 2025 & 2033
- Figure 26: Asia Pacific Dates Market Revenue (Million), by Production Analysis 2025 & 2033
- Figure 27: Asia Pacific Dates Market Revenue Share (%), by Production Analysis 2025 & 2033
- Figure 28: Asia Pacific Dates Market Revenue (Million), by Consumption Analysis 2025 & 2033
- Figure 29: Asia Pacific Dates Market Revenue Share (%), by Consumption Analysis 2025 & 2033
- Figure 30: Asia Pacific Dates Market Revenue (Million), by Import Market Analysis (Value & Volume) 2025 & 2033
- Figure 31: Asia Pacific Dates Market Revenue Share (%), by Import Market Analysis (Value & Volume) 2025 & 2033
- Figure 32: Asia Pacific Dates Market Revenue (Million), by Export Market Analysis (Value & Volume) 2025 & 2033
- Figure 33: Asia Pacific Dates Market Revenue Share (%), by Export Market Analysis (Value & Volume) 2025 & 2033
- Figure 34: Asia Pacific Dates Market Revenue (Million), by Price Trend Analysis 2025 & 2033
- Figure 35: Asia Pacific Dates Market Revenue Share (%), by Price Trend Analysis 2025 & 2033
- Figure 36: Asia Pacific Dates Market Revenue (Million), by Country 2025 & 2033
- Figure 37: Asia Pacific Dates Market Revenue Share (%), by Country 2025 & 2033
- Figure 38: South America Dates Market Revenue (Million), by Production Analysis 2025 & 2033
- Figure 39: South America Dates Market Revenue Share (%), by Production Analysis 2025 & 2033
- Figure 40: South America Dates Market Revenue (Million), by Consumption Analysis 2025 & 2033
- Figure 41: South America Dates Market Revenue Share (%), by Consumption Analysis 2025 & 2033
- Figure 42: South America Dates Market Revenue (Million), by Import Market Analysis (Value & Volume) 2025 & 2033
- Figure 43: South America Dates Market Revenue Share (%), by Import Market Analysis (Value & Volume) 2025 & 2033
- Figure 44: South America Dates Market Revenue (Million), by Export Market Analysis (Value & Volume) 2025 & 2033
- Figure 45: South America Dates Market Revenue Share (%), by Export Market Analysis (Value & Volume) 2025 & 2033
- Figure 46: South America Dates Market Revenue (Million), by Price Trend Analysis 2025 & 2033
- Figure 47: South America Dates Market Revenue Share (%), by Price Trend Analysis 2025 & 2033
- Figure 48: South America Dates Market Revenue (Million), by Country 2025 & 2033
- Figure 49: South America Dates Market Revenue Share (%), by Country 2025 & 2033
- Figure 50: Middle East and Africa Dates Market Revenue (Million), by Production Analysis 2025 & 2033
- Figure 51: Middle East and Africa Dates Market Revenue Share (%), by Production Analysis 2025 & 2033
- Figure 52: Middle East and Africa Dates Market Revenue (Million), by Consumption Analysis 2025 & 2033
- Figure 53: Middle East and Africa Dates Market Revenue Share (%), by Consumption Analysis 2025 & 2033
- Figure 54: Middle East and Africa Dates Market Revenue (Million), by Import Market Analysis (Value & Volume) 2025 & 2033
- Figure 55: Middle East and Africa Dates Market Revenue Share (%), by Import Market Analysis (Value & Volume) 2025 & 2033
- Figure 56: Middle East and Africa Dates Market Revenue (Million), by Export Market Analysis (Value & Volume) 2025 & 2033
- Figure 57: Middle East and Africa Dates Market Revenue Share (%), by Export Market Analysis (Value & Volume) 2025 & 2033
- Figure 58: Middle East and Africa Dates Market Revenue (Million), by Price Trend Analysis 2025 & 2033
- Figure 59: Middle East and Africa Dates Market Revenue Share (%), by Price Trend Analysis 2025 & 2033
- Figure 60: Middle East and Africa Dates Market Revenue (Million), by Country 2025 & 2033
- Figure 61: Middle East and Africa Dates Market Revenue Share (%), by Country 2025 & 2033
List of Tables
- Table 1: Global Dates Market Revenue Million Forecast, by Production Analysis 2020 & 2033
- Table 2: Global Dates Market Revenue Million Forecast, by Consumption Analysis 2020 & 2033
- Table 3: Global Dates Market Revenue Million Forecast, by Import Market Analysis (Value & Volume) 2020 & 2033
- Table 4: Global Dates Market Revenue Million Forecast, by Export Market Analysis (Value & Volume) 2020 & 2033
- Table 5: Global Dates Market Revenue Million Forecast, by Price Trend Analysis 2020 & 2033
- Table 6: Global Dates Market Revenue Million Forecast, by Region 2020 & 2033
- Table 7: Global Dates Market Revenue Million Forecast, by Production Analysis 2020 & 2033
- Table 8: Global Dates Market Revenue Million Forecast, by Consumption Analysis 2020 & 2033
- Table 9: Global Dates Market Revenue Million Forecast, by Import Market Analysis (Value & Volume) 2020 & 2033
- Table 10: Global Dates Market Revenue Million Forecast, by Export Market Analysis (Value & Volume) 2020 & 2033
- Table 11: Global Dates Market Revenue Million Forecast, by Price Trend Analysis 2020 & 2033
- Table 12: Global Dates Market Revenue Million Forecast, by Country 2020 & 2033
- Table 13: United States Dates Market Revenue (Million) Forecast, by Application 2020 & 2033
- Table 14: Canada Dates Market Revenue (Million) Forecast, by Application 2020 & 2033
- Table 15: Global Dates Market Revenue Million Forecast, by Production Analysis 2020 & 2033
- Table 16: Global Dates Market Revenue Million Forecast, by Consumption Analysis 2020 & 2033
- Table 17: Global Dates Market Revenue Million Forecast, by Import Market Analysis (Value & Volume) 2020 & 2033
- Table 18: Global Dates Market Revenue Million Forecast, by Export Market Analysis (Value & Volume) 2020 & 2033
- Table 19: Global Dates Market Revenue Million Forecast, by Price Trend Analysis 2020 & 2033
- Table 20: Global Dates Market Revenue Million Forecast, by Country 2020 & 2033
- Table 21: Germany Dates Market Revenue (Million) Forecast, by Application 2020 & 2033
- Table 22: United Kingdom Dates Market Revenue (Million) Forecast, by Application 2020 & 2033
- Table 23: France Dates Market Revenue (Million) Forecast, by Application 2020 & 2033
- Table 24: Netherlands Dates Market Revenue (Million) Forecast, by Application 2020 & 2033
- Table 25: Italy Dates Market Revenue (Million) Forecast, by Application 2020 & 2033
- Table 26: Global Dates Market Revenue Million Forecast, by Production Analysis 2020 & 2033
- Table 27: Global Dates Market Revenue Million Forecast, by Consumption Analysis 2020 & 2033
- Table 28: Global Dates Market Revenue Million Forecast, by Import Market Analysis (Value & Volume) 2020 & 2033
- Table 29: Global Dates Market Revenue Million Forecast, by Export Market Analysis (Value & Volume) 2020 & 2033
- Table 30: Global Dates Market Revenue Million Forecast, by Price Trend Analysis 2020 & 2033
- Table 31: Global Dates Market Revenue Million Forecast, by Country 2020 & 2033
- Table 32: India Dates Market Revenue (Million) Forecast, by Application 2020 & 2033
- Table 33: Indonesia Dates Market Revenue (Million) Forecast, by Application 2020 & 2033
- Table 34: Malaysia Dates Market Revenue (Million) Forecast, by Application 2020 & 2033
- Table 35: Pakistan Dates Market Revenue (Million) Forecast, by Application 2020 & 2033
- Table 36: Global Dates Market Revenue Million Forecast, by Production Analysis 2020 & 2033
- Table 37: Global Dates Market Revenue Million Forecast, by Consumption Analysis 2020 & 2033
- Table 38: Global Dates Market Revenue Million Forecast, by Import Market Analysis (Value & Volume) 2020 & 2033
- Table 39: Global Dates Market Revenue Million Forecast, by Export Market Analysis (Value & Volume) 2020 & 2033
- Table 40: Global Dates Market Revenue Million Forecast, by Price Trend Analysis 2020 & 2033
- Table 41: Global Dates Market Revenue Million Forecast, by Country 2020 & 2033
- Table 42: Brazil Dates Market Revenue (Million) Forecast, by Application 2020 & 2033
- Table 43: Argentina Dates Market Revenue (Million) Forecast, by Application 2020 & 2033
- Table 44: Global Dates Market Revenue Million Forecast, by Production Analysis 2020 & 2033
- Table 45: Global Dates Market Revenue Million Forecast, by Consumption Analysis 2020 & 2033
- Table 46: Global Dates Market Revenue Million Forecast, by Import Market Analysis (Value & Volume) 2020 & 2033
- Table 47: Global Dates Market Revenue Million Forecast, by Export Market Analysis (Value & Volume) 2020 & 2033
- Table 48: Global Dates Market Revenue Million Forecast, by Price Trend Analysis 2020 & 2033
- Table 49: Global Dates Market Revenue Million Forecast, by Country 2020 & 2033
- Table 50: Unites Arab Emirates Dates Market Revenue (Million) Forecast, by Application 2020 & 2033
- Table 51: Saudi Arabia Dates Market Revenue (Million) Forecast, by Application 2020 & 2033
- Table 52: Oman Dates Market Revenue (Million) Forecast, by Application 2020 & 2033
- Table 53: Egypt Dates Market Revenue (Million) Forecast, by Application 2020 & 2033
- Table 54: Morocco Dates Market Revenue (Million) Forecast, by Application 2020 & 2033
Frequently Asked Questions
1. What is the projected Compound Annual Growth Rate (CAGR) of the Dates Market?
The projected CAGR is approximately 3.27%.
2. Which companies are prominent players in the Dates Market?
Key companies in the market include Date Palm Nurseries , Alfoah Nursery , Barari Natural Dates , Gold Medal Dates, Al Wathba Dates .
3. What are the main segments of the Dates Market?
The market segments include Production Analysis, Consumption Analysis, Import Market Analysis (Value & Volume), Export Market Analysis (Value & Volume), Price Trend Analysis.
4. Can you provide details about the market size?
The market size is estimated to be USD 15.47 Million as of 2022.
5. What are some drivers contributing to market growth?
Increasing Berry Consumption for Health Benefits; Increasing Adoption of High-Technology Farm Practices; Growing Usage of Berries in the Food and Beverage Industries.
6. What are the notable trends driving market growth?
Rising Awareness of Health Benefits of Dates is Driving the Market.
7. Are there any restraints impacting market growth?
High Production Cost Involved in Berry Production; Increasing Disease and Pest Infestations.
8. Can you provide examples of recent developments in the market?
October 2022: Morocco aims to double its dates production by 2030 to reach 300,000 tons per year, against 149,000 tons in 2021, according to data from the Ministry of Agriculture, Maritime Fisheries, Rural Development and Water and Forests. This goal will be achieved through the implementation of the new strategy Generation Green 2020-2030 for the development of the sector of date palm aims to continue the rehabilitation of the traditional palm grove and the extension of plantations outside the palm grove.
9. What pricing options are available for accessing the report?
Pricing options include single-user, multi-user, and enterprise licenses priced at USD 4750, USD 5250, and USD 8750 respectively.
10. Is the market size provided in terms of value or volume?
The market size is provided in terms of value, measured in Million.
11. Are there any specific market keywords associated with the report?
Yes, the market keyword associated with the report is "Dates Market," which aids in identifying and referencing the specific market segment covered.
12. How do I determine which pricing option suits my needs best?
The pricing options vary based on user requirements and access needs. Individual users may opt for single-user licenses, while businesses requiring broader access may choose multi-user or enterprise licenses for cost-effective access to the report.
13. Are there any additional resources or data provided in the Dates Market report?
While the report offers comprehensive insights, it's advisable to review the specific contents or supplementary materials provided to ascertain if additional resources or data are available.
14. How can I stay updated on further developments or reports in the Dates Market?
To stay informed about further developments, trends, and reports in the Dates Market, consider subscribing to industry newsletters, following relevant companies and organizations, or regularly checking reputable industry news sources and publications.
Methodology
Step 1 - Identification of Relevant Samples Size from Population Database


Step 2 - Approaches for Defining Global Market Size (Value, Volume* & Price*)

Note*: In applicable scenarios
Step 3 - Data Sources
Primary Research
- Web Analytics
- Survey Reports
- Research Institute
- Latest Research Reports
- Opinion Leaders
Secondary Research
- Annual Reports
- White Paper
- Latest Press Release
- Industry Association
- Paid Database
- Investor Presentations

Step 4 - Data Triangulation
Involves using different sources of information in order to increase the validity of a study
These sources are likely to be stakeholders in a program - participants, other researchers, program staff, other community members, and so on.
Then we put all data in single framework & apply various statistical tools to find out the dynamic on the market.
During the analysis stage, feedback from the stakeholder groups would be compared to determine areas of agreement as well as areas of divergence