

Key Insights
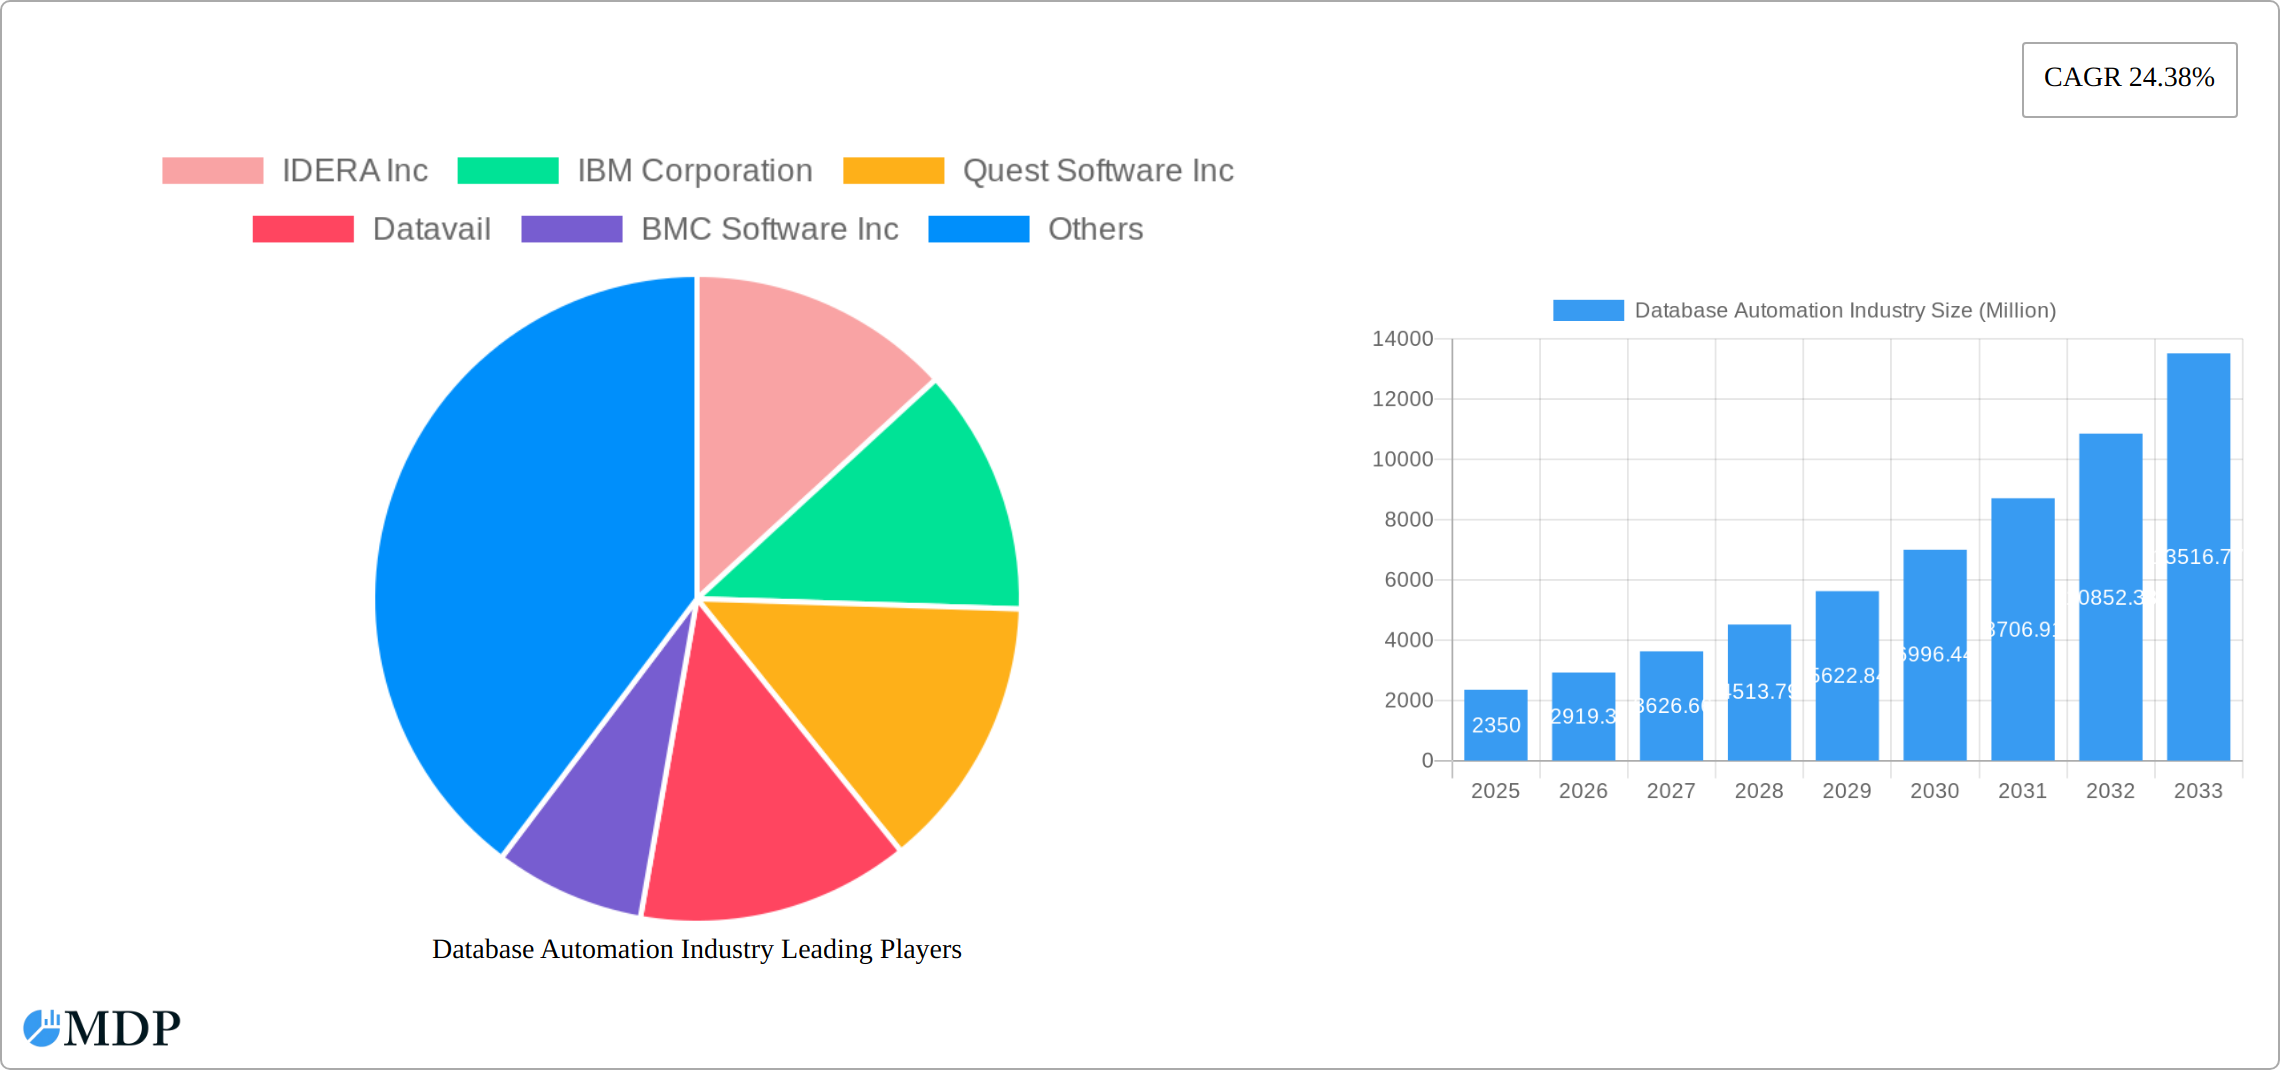
The Database Test Automation market is experiencing robust growth, projected to reach $2.35 billion in 2025 and maintain a Compound Annual Growth Rate (CAGR) of 24.38% from 2025 to 2033. This expansion is fueled by several key factors. The increasing complexity of database systems, coupled with the rising adoption of cloud-based deployments and agile development methodologies, necessitates efficient and reliable test automation solutions. Businesses across various sectors, including Banking, Financial Services and Insurance (BFSI), IT and Telecom, and E-commerce, are prioritizing automation to improve software quality, reduce testing time, and minimize costs associated with manual testing processes. The shift towards DevOps and continuous integration/continuous delivery (CI/CD) pipelines further accelerates the demand for automated database testing. Large enterprises are leading the adoption, followed by a growing segment of small and medium-sized enterprises (SMEs) recognizing the benefits of automation. The market is dominated by established players like IBM, Oracle, and SAP, alongside emerging specialized vendors offering innovative solutions. Competition is driving innovation, resulting in the development of more user-friendly, integrated, and intelligent test automation tools.
The significant growth is anticipated to continue throughout the forecast period, driven by ongoing digital transformation initiatives across industries and the increasing reliance on data-driven decision making. Growth will likely be particularly strong in regions like Asia-Pacific, driven by burgeoning technological adoption and economic expansion. However, factors such as the complexity of integrating automation into legacy systems and the need for skilled professionals to implement and maintain these solutions could pose challenges. The market's segmentation by component (solution vs. services), deployment mode (cloud vs. on-premises), and end-user industry allows for tailored solutions and strategic market penetration by vendors. Future trends point towards increased integration with AI and machine learning for intelligent test case generation and predictive analytics, furthering the market's expansion.
Database Automation Industry Market Report: 2019-2033
This comprehensive report provides a detailed analysis of the Database Automation industry, offering invaluable insights for stakeholders seeking to navigate this rapidly evolving market. With a study period spanning 2019-2033, a base year of 2025, and a forecast period of 2025-2033, this report examines market dynamics, leading players, and emerging trends. The report covers a market expected to reach xx Million by 2033, revealing significant growth opportunities and challenges.
Database Automation Industry Market Dynamics & Concentration
The Database Automation market is experiencing significant growth fueled by increasing data volumes, the need for improved data quality, and the rising adoption of cloud technologies. Market concentration is moderate, with several key players holding substantial market share, but a significant number of smaller companies also contributing. Key players include IDERA Inc, IBM Corporation, Quest Software Inc, Datavail, BMC Software Inc, Bryter US Inc, Amazon Web Services Inc, CA Technologies (Broadcom Inc), Oracle Corporation, and SAP SE. However, the market remains fragmented, with ongoing mergers and acquisitions (M&A) activity shaping the competitive landscape. The past five years have seen approximately xx M&A deals, resulting in a xx% market share concentration among the top 5 players by 2024. Innovation drivers include advancements in artificial intelligence (AI), machine learning (ML), and automation technologies. Regulatory frameworks, such as GDPR and CCPA, are influencing data management practices and driving demand for database automation solutions. Product substitutes, such as manual data management processes, are becoming less prevalent due to their inefficiency and cost. End-user trends favor cloud-based solutions, increasing scalability and flexibility.
- Market Share: Top 5 players hold approximately xx% of the market (2024).
- M&A Activity: Approximately xx deals in the past five years (2019-2024).
- Key Innovation Drivers: AI, ML, automation technologies.
- Regulatory Influences: GDPR, CCPA.
Database Automation Industry Industry Trends & Analysis
The Database Automation market is projected to witness a Compound Annual Growth Rate (CAGR) of xx% during the forecast period (2025-2033), driven by several key factors. The rising adoption of cloud computing is a major catalyst, enabling businesses to scale their database operations more efficiently and cost-effectively. Technological disruptions, such as the increasing adoption of serverless computing and the rise of data virtualization, are creating new opportunities for database automation vendors. Consumer preferences are shifting towards solutions that offer enhanced security, scalability, and ease of use. Competitive dynamics are intense, with established players and new entrants vying for market share through product innovation, strategic partnerships, and aggressive pricing strategies. Market penetration in key sectors like BFSI and IT & Telecom is high, exceeding xx% in 2024. This trend is expected to accelerate in other sectors like e-commerce, manufacturing, and government, driving further market growth.
Leading Markets & Segments in Database Automation Industry
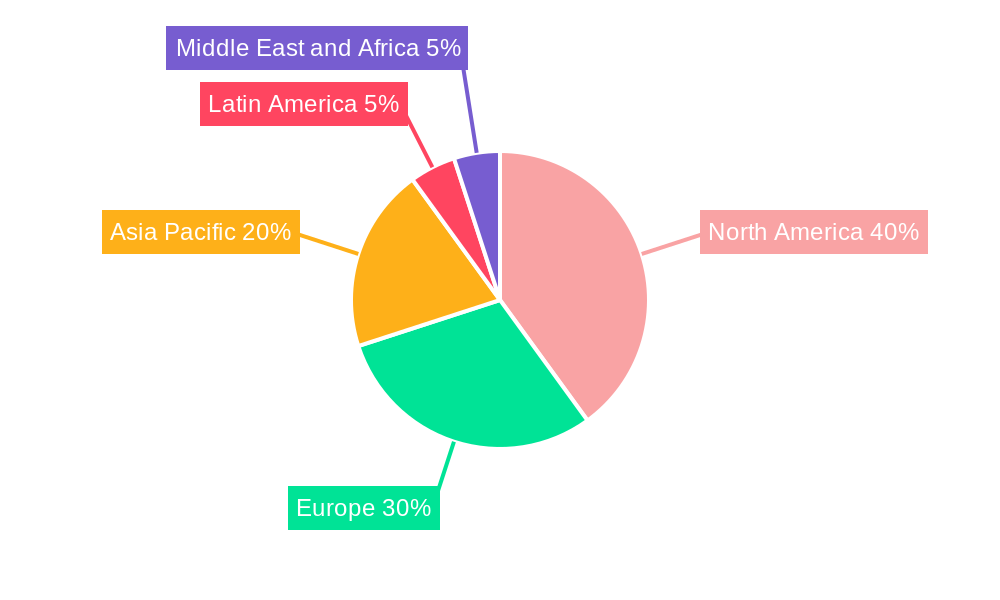
The North American region currently holds the largest market share in the Database Automation industry, driven by high adoption rates in the BFSI and IT & Telecom sectors. However, the Asia-Pacific region is expected to show the highest growth rate during the forecast period, fuelled by economic expansion and increasing digitalization.
- Dominant Region: North America
- Fastest-Growing Region: Asia-Pacific
- Leading Segments:
- Component: Solution segment dominates due to its comprehensive functionalities.
- Deployment Mode: Cloud deployment is experiencing rapid growth due to scalability and cost-effectiveness.
- Enterprise Size: Large Enterprises are the primary adopters due to their greater resources and complex data requirements.
- End-user Industry: BFSI and IT & Telecom are leading sectors due to their strict data governance regulations and high data volumes.
Key Drivers:
- North America: Strong IT infrastructure, high technological adoption, and large enterprise presence.
- Asia-Pacific: Rapid economic growth, increasing digitalization, and government initiatives supporting technology adoption.
Database Automation Industry Product Developments
Recent product innovations focus on incorporating AI/ML capabilities for enhanced data quality, improved automation workflows, and streamlined user experiences. These advancements cater to the growing demand for automated data validation, testing, and deployment across diverse database environments. Key competitive advantages include offering seamless integration with existing IT infrastructure, providing robust security features, and delivering scalable solutions tailored to specific business needs. The integration of serverless architecture and data virtualization offers key advantages in terms of efficiency and cost reduction.
Key Drivers of Database Automation Industry Growth
Several factors are driving the growth of the Database Automation industry. The exponential growth of data volumes necessitates efficient management tools, while increasing regulatory compliance requirements necessitate robust and automated data quality assurance. The ongoing shift to cloud-based environments is creating demand for cloud-native database automation solutions. Finally, advancements in AI and ML are enabling the development of sophisticated automation tools that can handle complex database tasks with high accuracy.
Challenges in the Database Automation Industry Market
The Database Automation market faces certain challenges. High initial investment costs for implementing automation solutions can deter some organizations, particularly SMEs. The complexity of integrating automation tools with existing legacy systems can also pose significant implementation hurdles. Furthermore, the scarcity of skilled professionals capable of developing and managing database automation solutions adds to the market's challenges. These factors limit the adoption rate to xx% in the SME sector in 2024.
Emerging Opportunities in Database Automation Industry
The Database Automation industry presents numerous opportunities for growth. The expansion into emerging markets, coupled with advancements in AI and ML technologies, will create new avenues for innovation. Strategic partnerships between automation vendors and cloud providers will further drive market growth. The development of specialized solutions for specific industries, such as healthcare and manufacturing, holds immense potential. The integration of blockchain technology for enhanced data security and integrity represents a promising emerging opportunity.
Leading Players in the Database Automation Industry Sector
- IDERA Inc
- IBM Corporation
- Quest Software Inc
- Datavail
- BMC Software Inc
- Bryter US Inc
- Amazon Web Services Inc
- CA Technologies (Broadcom Inc)
- Oracle Corporation
- SAP SE
Key Milestones in Database Automation Industry Industry
- June 2023: Aquatic Informatics launched HydroCorrect, an automated data validation tool leveraging machine learning to improve data quality and efficiency in water management.
- May 2023: data.world acquired Mighty Canary technology, integrating it into a new DataOps application to provide real-time data quality updates.
Strategic Outlook for Database Automation Industry Market
The Database Automation market is poised for continued robust growth, driven by ongoing technological advancements, increasing data volumes, and heightened regulatory scrutiny. Strategic partnerships, expansion into new markets, and the development of innovative solutions will be crucial for success in this dynamic market. The focus on AI-powered solutions and enhanced security features will drive further market expansion and increased adoption rates. The market is projected to reach xx Million by 2033, presenting significant opportunities for players willing to adapt to the evolving technological landscape.
Database Automation Industry Segmentation
-
1. Component
-
1.1. Solution
- 1.1.1. Database Patch and Release Automation
- 1.1.2. Application Release Automation
- 1.1.3. Database Test Automation
- 1.2. Services
-
1.1. Solution
-
2. Deployment Mode
- 2.1. Cloud
- 2.2. On-Premises
-
3. Enterprise Size
- 3.1. Large Enterprises
- 3.2. Small and Medium-Sized Enterprises
-
4. End-user Industry
- 4.1. Banking, Financial Services and Insurance (BFSI)
- 4.2. IT and Telecom
- 4.3. E-commerce and Retail
- 4.4. Manufacturing
- 4.5. Government and Defense
- 4.6. Others (Manufacturing, Media and Entertainment)
Database Automation Industry Segmentation By Geography
- 1. North America
- 2. Europe
- 3. Asia Pacific
- 4. Latin America
- 5. Middle East and Africa
Database Automation Industry REPORT HIGHLIGHTS
| Aspects | Details |
|---|---|
| Study Period | 2019-2033 |
| Base Year | 2024 |
| Estimated Year | 2025 |
| Forecast Period | 2025-2033 |
| Historical Period | 2019-2024 |
| Growth Rate | CAGR of 24.38% from 2019-2033 |
| Segmentation |
|
Table of Contents
- 1. Introduction
- 1.1. Research Scope
- 1.2. Market Segmentation
- 1.3. Research Methodology
- 1.4. Definitions and Assumptions
- 2. Executive Summary
- 2.1. Introduction
- 3. Market Dynamics
- 3.1. Introduction
- 3.2. Market Drivers
- 3.2.1. Continuously Growing Volumes of Data Across Verticals; Increasing Demand for Automating Repetitive Database Management Processes
- 3.3. Market Restrains
- 3.3.1. ; Managing Identities Across Multiple Operation Environments
- 3.4. Market Trends
- 3.4.1. IT and Telecommunication industry is Expected to Witness Significant Growth
- 4. Market Factor Analysis
- 4.1. Porters Five Forces
- 4.2. Supply/Value Chain
- 4.3. PESTEL analysis
- 4.4. Market Entropy
- 4.5. Patent/Trademark Analysis
- 5. Global Database Automation Industry Analysis, Insights and Forecast, 2019-2031
- 5.1. Market Analysis, Insights and Forecast - by Component
- 5.1.1. Solution
- 5.1.1.1. Database Patch and Release Automation
- 5.1.1.2. Application Release Automation
- 5.1.1.3. Database Test Automation
- 5.1.2. Services
- 5.1.1. Solution
- 5.2. Market Analysis, Insights and Forecast - by Deployment Mode
- 5.2.1. Cloud
- 5.2.2. On-Premises
- 5.3. Market Analysis, Insights and Forecast - by Enterprise Size
- 5.3.1. Large Enterprises
- 5.3.2. Small and Medium-Sized Enterprises
- 5.4. Market Analysis, Insights and Forecast - by End-user Industry
- 5.4.1. Banking, Financial Services and Insurance (BFSI)
- 5.4.2. IT and Telecom
- 5.4.3. E-commerce and Retail
- 5.4.4. Manufacturing
- 5.4.5. Government and Defense
- 5.4.6. Others (Manufacturing, Media and Entertainment)
- 5.5. Market Analysis, Insights and Forecast - by Region
- 5.5.1. North America
- 5.5.2. Europe
- 5.5.3. Asia Pacific
- 5.5.4. Latin America
- 5.5.5. Middle East and Africa
- 5.1. Market Analysis, Insights and Forecast - by Component
- 6. North America Database Automation Industry Analysis, Insights and Forecast, 2019-2031
- 6.1. Market Analysis, Insights and Forecast - by Component
- 6.1.1. Solution
- 6.1.1.1. Database Patch and Release Automation
- 6.1.1.2. Application Release Automation
- 6.1.1.3. Database Test Automation
- 6.1.2. Services
- 6.1.1. Solution
- 6.2. Market Analysis, Insights and Forecast - by Deployment Mode
- 6.2.1. Cloud
- 6.2.2. On-Premises
- 6.3. Market Analysis, Insights and Forecast - by Enterprise Size
- 6.3.1. Large Enterprises
- 6.3.2. Small and Medium-Sized Enterprises
- 6.4. Market Analysis, Insights and Forecast - by End-user Industry
- 6.4.1. Banking, Financial Services and Insurance (BFSI)
- 6.4.2. IT and Telecom
- 6.4.3. E-commerce and Retail
- 6.4.4. Manufacturing
- 6.4.5. Government and Defense
- 6.4.6. Others (Manufacturing, Media and Entertainment)
- 6.1. Market Analysis, Insights and Forecast - by Component
- 7. Europe Database Automation Industry Analysis, Insights and Forecast, 2019-2031
- 7.1. Market Analysis, Insights and Forecast - by Component
- 7.1.1. Solution
- 7.1.1.1. Database Patch and Release Automation
- 7.1.1.2. Application Release Automation
- 7.1.1.3. Database Test Automation
- 7.1.2. Services
- 7.1.1. Solution
- 7.2. Market Analysis, Insights and Forecast - by Deployment Mode
- 7.2.1. Cloud
- 7.2.2. On-Premises
- 7.3. Market Analysis, Insights and Forecast - by Enterprise Size
- 7.3.1. Large Enterprises
- 7.3.2. Small and Medium-Sized Enterprises
- 7.4. Market Analysis, Insights and Forecast - by End-user Industry
- 7.4.1. Banking, Financial Services and Insurance (BFSI)
- 7.4.2. IT and Telecom
- 7.4.3. E-commerce and Retail
- 7.4.4. Manufacturing
- 7.4.5. Government and Defense
- 7.4.6. Others (Manufacturing, Media and Entertainment)
- 7.1. Market Analysis, Insights and Forecast - by Component
- 8. Asia Pacific Database Automation Industry Analysis, Insights and Forecast, 2019-2031
- 8.1. Market Analysis, Insights and Forecast - by Component
- 8.1.1. Solution
- 8.1.1.1. Database Patch and Release Automation
- 8.1.1.2. Application Release Automation
- 8.1.1.3. Database Test Automation
- 8.1.2. Services
- 8.1.1. Solution
- 8.2. Market Analysis, Insights and Forecast - by Deployment Mode
- 8.2.1. Cloud
- 8.2.2. On-Premises
- 8.3. Market Analysis, Insights and Forecast - by Enterprise Size
- 8.3.1. Large Enterprises
- 8.3.2. Small and Medium-Sized Enterprises
- 8.4. Market Analysis, Insights and Forecast - by End-user Industry
- 8.4.1. Banking, Financial Services and Insurance (BFSI)
- 8.4.2. IT and Telecom
- 8.4.3. E-commerce and Retail
- 8.4.4. Manufacturing
- 8.4.5. Government and Defense
- 8.4.6. Others (Manufacturing, Media and Entertainment)
- 8.1. Market Analysis, Insights and Forecast - by Component
- 9. Latin America Database Automation Industry Analysis, Insights and Forecast, 2019-2031
- 9.1. Market Analysis, Insights and Forecast - by Component
- 9.1.1. Solution
- 9.1.1.1. Database Patch and Release Automation
- 9.1.1.2. Application Release Automation
- 9.1.1.3. Database Test Automation
- 9.1.2. Services
- 9.1.1. Solution
- 9.2. Market Analysis, Insights and Forecast - by Deployment Mode
- 9.2.1. Cloud
- 9.2.2. On-Premises
- 9.3. Market Analysis, Insights and Forecast - by Enterprise Size
- 9.3.1. Large Enterprises
- 9.3.2. Small and Medium-Sized Enterprises
- 9.4. Market Analysis, Insights and Forecast - by End-user Industry
- 9.4.1. Banking, Financial Services and Insurance (BFSI)
- 9.4.2. IT and Telecom
- 9.4.3. E-commerce and Retail
- 9.4.4. Manufacturing
- 9.4.5. Government and Defense
- 9.4.6. Others (Manufacturing, Media and Entertainment)
- 9.1. Market Analysis, Insights and Forecast - by Component
- 10. Middle East and Africa Database Automation Industry Analysis, Insights and Forecast, 2019-2031
- 10.1. Market Analysis, Insights and Forecast - by Component
- 10.1.1. Solution
- 10.1.1.1. Database Patch and Release Automation
- 10.1.1.2. Application Release Automation
- 10.1.1.3. Database Test Automation
- 10.1.2. Services
- 10.1.1. Solution
- 10.2. Market Analysis, Insights and Forecast - by Deployment Mode
- 10.2.1. Cloud
- 10.2.2. On-Premises
- 10.3. Market Analysis, Insights and Forecast - by Enterprise Size
- 10.3.1. Large Enterprises
- 10.3.2. Small and Medium-Sized Enterprises
- 10.4. Market Analysis, Insights and Forecast - by End-user Industry
- 10.4.1. Banking, Financial Services and Insurance (BFSI)
- 10.4.2. IT and Telecom
- 10.4.3. E-commerce and Retail
- 10.4.4. Manufacturing
- 10.4.5. Government and Defense
- 10.4.6. Others (Manufacturing, Media and Entertainment)
- 10.1. Market Analysis, Insights and Forecast - by Component
- 11. North America Database Automation Industry Analysis, Insights and Forecast, 2019-2031
- 11.1. Market Analysis, Insights and Forecast - By Country/Sub-region
- 11.1.1.
- 12. Europe Database Automation Industry Analysis, Insights and Forecast, 2019-2031
- 12.1. Market Analysis, Insights and Forecast - By Country/Sub-region
- 12.1.1.
- 13. Asia Pacific Database Automation Industry Analysis, Insights and Forecast, 2019-2031
- 13.1. Market Analysis, Insights and Forecast - By Country/Sub-region
- 13.1.1.
- 14. Latin America Database Automation Industry Analysis, Insights and Forecast, 2019-2031
- 14.1. Market Analysis, Insights and Forecast - By Country/Sub-region
- 14.1.1.
- 15. Middle East and Africa Database Automation Industry Analysis, Insights and Forecast, 2019-2031
- 15.1. Market Analysis, Insights and Forecast - By Country/Sub-region
- 15.1.1.
- 16. Competitive Analysis
- 16.1. Global Market Share Analysis 2024
- 16.2. Company Profiles
- 16.2.1 IDERA Inc
- 16.2.1.1. Overview
- 16.2.1.2. Products
- 16.2.1.3. SWOT Analysis
- 16.2.1.4. Recent Developments
- 16.2.1.5. Financials (Based on Availability)
- 16.2.2 IBM Corporation
- 16.2.2.1. Overview
- 16.2.2.2. Products
- 16.2.2.3. SWOT Analysis
- 16.2.2.4. Recent Developments
- 16.2.2.5. Financials (Based on Availability)
- 16.2.3 Quest Software Inc
- 16.2.3.1. Overview
- 16.2.3.2. Products
- 16.2.3.3. SWOT Analysis
- 16.2.3.4. Recent Developments
- 16.2.3.5. Financials (Based on Availability)
- 16.2.4 Datavail
- 16.2.4.1. Overview
- 16.2.4.2. Products
- 16.2.4.3. SWOT Analysis
- 16.2.4.4. Recent Developments
- 16.2.4.5. Financials (Based on Availability)
- 16.2.5 BMC Software Inc
- 16.2.5.1. Overview
- 16.2.5.2. Products
- 16.2.5.3. SWOT Analysis
- 16.2.5.4. Recent Developments
- 16.2.5.5. Financials (Based on Availability)
- 16.2.6 Bryter US Inc *List Not Exhaustive
- 16.2.6.1. Overview
- 16.2.6.2. Products
- 16.2.6.3. SWOT Analysis
- 16.2.6.4. Recent Developments
- 16.2.6.5. Financials (Based on Availability)
- 16.2.7 Amazon Web Services Inc
- 16.2.7.1. Overview
- 16.2.7.2. Products
- 16.2.7.3. SWOT Analysis
- 16.2.7.4. Recent Developments
- 16.2.7.5. Financials (Based on Availability)
- 16.2.8 CA Technologies (Broadcom Inc)
- 16.2.8.1. Overview
- 16.2.8.2. Products
- 16.2.8.3. SWOT Analysis
- 16.2.8.4. Recent Developments
- 16.2.8.5. Financials (Based on Availability)
- 16.2.9 Oracle Corporation
- 16.2.9.1. Overview
- 16.2.9.2. Products
- 16.2.9.3. SWOT Analysis
- 16.2.9.4. Recent Developments
- 16.2.9.5. Financials (Based on Availability)
- 16.2.10 SAP SE
- 16.2.10.1. Overview
- 16.2.10.2. Products
- 16.2.10.3. SWOT Analysis
- 16.2.10.4. Recent Developments
- 16.2.10.5. Financials (Based on Availability)
- 16.2.1 IDERA Inc
List of Figures
- Figure 1: Global Database Automation Industry Revenue Breakdown (Million, %) by Region 2024 & 2032
- Figure 2: North America Database Automation Industry Revenue (Million), by Country 2024 & 2032
- Figure 3: North America Database Automation Industry Revenue Share (%), by Country 2024 & 2032
- Figure 4: Europe Database Automation Industry Revenue (Million), by Country 2024 & 2032
- Figure 5: Europe Database Automation Industry Revenue Share (%), by Country 2024 & 2032
- Figure 6: Asia Pacific Database Automation Industry Revenue (Million), by Country 2024 & 2032
- Figure 7: Asia Pacific Database Automation Industry Revenue Share (%), by Country 2024 & 2032
- Figure 8: Latin America Database Automation Industry Revenue (Million), by Country 2024 & 2032
- Figure 9: Latin America Database Automation Industry Revenue Share (%), by Country 2024 & 2032
- Figure 10: Middle East and Africa Database Automation Industry Revenue (Million), by Country 2024 & 2032
- Figure 11: Middle East and Africa Database Automation Industry Revenue Share (%), by Country 2024 & 2032
- Figure 12: North America Database Automation Industry Revenue (Million), by Component 2024 & 2032
- Figure 13: North America Database Automation Industry Revenue Share (%), by Component 2024 & 2032
- Figure 14: North America Database Automation Industry Revenue (Million), by Deployment Mode 2024 & 2032
- Figure 15: North America Database Automation Industry Revenue Share (%), by Deployment Mode 2024 & 2032
- Figure 16: North America Database Automation Industry Revenue (Million), by Enterprise Size 2024 & 2032
- Figure 17: North America Database Automation Industry Revenue Share (%), by Enterprise Size 2024 & 2032
- Figure 18: North America Database Automation Industry Revenue (Million), by End-user Industry 2024 & 2032
- Figure 19: North America Database Automation Industry Revenue Share (%), by End-user Industry 2024 & 2032
- Figure 20: North America Database Automation Industry Revenue (Million), by Country 2024 & 2032
- Figure 21: North America Database Automation Industry Revenue Share (%), by Country 2024 & 2032
- Figure 22: Europe Database Automation Industry Revenue (Million), by Component 2024 & 2032
- Figure 23: Europe Database Automation Industry Revenue Share (%), by Component 2024 & 2032
- Figure 24: Europe Database Automation Industry Revenue (Million), by Deployment Mode 2024 & 2032
- Figure 25: Europe Database Automation Industry Revenue Share (%), by Deployment Mode 2024 & 2032
- Figure 26: Europe Database Automation Industry Revenue (Million), by Enterprise Size 2024 & 2032
- Figure 27: Europe Database Automation Industry Revenue Share (%), by Enterprise Size 2024 & 2032
- Figure 28: Europe Database Automation Industry Revenue (Million), by End-user Industry 2024 & 2032
- Figure 29: Europe Database Automation Industry Revenue Share (%), by End-user Industry 2024 & 2032
- Figure 30: Europe Database Automation Industry Revenue (Million), by Country 2024 & 2032
- Figure 31: Europe Database Automation Industry Revenue Share (%), by Country 2024 & 2032
- Figure 32: Asia Pacific Database Automation Industry Revenue (Million), by Component 2024 & 2032
- Figure 33: Asia Pacific Database Automation Industry Revenue Share (%), by Component 2024 & 2032
- Figure 34: Asia Pacific Database Automation Industry Revenue (Million), by Deployment Mode 2024 & 2032
- Figure 35: Asia Pacific Database Automation Industry Revenue Share (%), by Deployment Mode 2024 & 2032
- Figure 36: Asia Pacific Database Automation Industry Revenue (Million), by Enterprise Size 2024 & 2032
- Figure 37: Asia Pacific Database Automation Industry Revenue Share (%), by Enterprise Size 2024 & 2032
- Figure 38: Asia Pacific Database Automation Industry Revenue (Million), by End-user Industry 2024 & 2032
- Figure 39: Asia Pacific Database Automation Industry Revenue Share (%), by End-user Industry 2024 & 2032
- Figure 40: Asia Pacific Database Automation Industry Revenue (Million), by Country 2024 & 2032
- Figure 41: Asia Pacific Database Automation Industry Revenue Share (%), by Country 2024 & 2032
- Figure 42: Latin America Database Automation Industry Revenue (Million), by Component 2024 & 2032
- Figure 43: Latin America Database Automation Industry Revenue Share (%), by Component 2024 & 2032
- Figure 44: Latin America Database Automation Industry Revenue (Million), by Deployment Mode 2024 & 2032
- Figure 45: Latin America Database Automation Industry Revenue Share (%), by Deployment Mode 2024 & 2032
- Figure 46: Latin America Database Automation Industry Revenue (Million), by Enterprise Size 2024 & 2032
- Figure 47: Latin America Database Automation Industry Revenue Share (%), by Enterprise Size 2024 & 2032
- Figure 48: Latin America Database Automation Industry Revenue (Million), by End-user Industry 2024 & 2032
- Figure 49: Latin America Database Automation Industry Revenue Share (%), by End-user Industry 2024 & 2032
- Figure 50: Latin America Database Automation Industry Revenue (Million), by Country 2024 & 2032
- Figure 51: Latin America Database Automation Industry Revenue Share (%), by Country 2024 & 2032
- Figure 52: Middle East and Africa Database Automation Industry Revenue (Million), by Component 2024 & 2032
- Figure 53: Middle East and Africa Database Automation Industry Revenue Share (%), by Component 2024 & 2032
- Figure 54: Middle East and Africa Database Automation Industry Revenue (Million), by Deployment Mode 2024 & 2032
- Figure 55: Middle East and Africa Database Automation Industry Revenue Share (%), by Deployment Mode 2024 & 2032
- Figure 56: Middle East and Africa Database Automation Industry Revenue (Million), by Enterprise Size 2024 & 2032
- Figure 57: Middle East and Africa Database Automation Industry Revenue Share (%), by Enterprise Size 2024 & 2032
- Figure 58: Middle East and Africa Database Automation Industry Revenue (Million), by End-user Industry 2024 & 2032
- Figure 59: Middle East and Africa Database Automation Industry Revenue Share (%), by End-user Industry 2024 & 2032
- Figure 60: Middle East and Africa Database Automation Industry Revenue (Million), by Country 2024 & 2032
- Figure 61: Middle East and Africa Database Automation Industry Revenue Share (%), by Country 2024 & 2032
List of Tables
- Table 1: Global Database Automation Industry Revenue Million Forecast, by Region 2019 & 2032
- Table 2: Global Database Automation Industry Revenue Million Forecast, by Component 2019 & 2032
- Table 3: Global Database Automation Industry Revenue Million Forecast, by Deployment Mode 2019 & 2032
- Table 4: Global Database Automation Industry Revenue Million Forecast, by Enterprise Size 2019 & 2032
- Table 5: Global Database Automation Industry Revenue Million Forecast, by End-user Industry 2019 & 2032
- Table 6: Global Database Automation Industry Revenue Million Forecast, by Region 2019 & 2032
- Table 7: Global Database Automation Industry Revenue Million Forecast, by Country 2019 & 2032
- Table 8: Database Automation Industry Revenue (Million) Forecast, by Application 2019 & 2032
- Table 9: Global Database Automation Industry Revenue Million Forecast, by Country 2019 & 2032
- Table 10: Database Automation Industry Revenue (Million) Forecast, by Application 2019 & 2032
- Table 11: Global Database Automation Industry Revenue Million Forecast, by Country 2019 & 2032
- Table 12: Database Automation Industry Revenue (Million) Forecast, by Application 2019 & 2032
- Table 13: Global Database Automation Industry Revenue Million Forecast, by Country 2019 & 2032
- Table 14: Database Automation Industry Revenue (Million) Forecast, by Application 2019 & 2032
- Table 15: Global Database Automation Industry Revenue Million Forecast, by Country 2019 & 2032
- Table 16: Database Automation Industry Revenue (Million) Forecast, by Application 2019 & 2032
- Table 17: Global Database Automation Industry Revenue Million Forecast, by Component 2019 & 2032
- Table 18: Global Database Automation Industry Revenue Million Forecast, by Deployment Mode 2019 & 2032
- Table 19: Global Database Automation Industry Revenue Million Forecast, by Enterprise Size 2019 & 2032
- Table 20: Global Database Automation Industry Revenue Million Forecast, by End-user Industry 2019 & 2032
- Table 21: Global Database Automation Industry Revenue Million Forecast, by Country 2019 & 2032
- Table 22: Global Database Automation Industry Revenue Million Forecast, by Component 2019 & 2032
- Table 23: Global Database Automation Industry Revenue Million Forecast, by Deployment Mode 2019 & 2032
- Table 24: Global Database Automation Industry Revenue Million Forecast, by Enterprise Size 2019 & 2032
- Table 25: Global Database Automation Industry Revenue Million Forecast, by End-user Industry 2019 & 2032
- Table 26: Global Database Automation Industry Revenue Million Forecast, by Country 2019 & 2032
- Table 27: Global Database Automation Industry Revenue Million Forecast, by Component 2019 & 2032
- Table 28: Global Database Automation Industry Revenue Million Forecast, by Deployment Mode 2019 & 2032
- Table 29: Global Database Automation Industry Revenue Million Forecast, by Enterprise Size 2019 & 2032
- Table 30: Global Database Automation Industry Revenue Million Forecast, by End-user Industry 2019 & 2032
- Table 31: Global Database Automation Industry Revenue Million Forecast, by Country 2019 & 2032
- Table 32: Global Database Automation Industry Revenue Million Forecast, by Component 2019 & 2032
- Table 33: Global Database Automation Industry Revenue Million Forecast, by Deployment Mode 2019 & 2032
- Table 34: Global Database Automation Industry Revenue Million Forecast, by Enterprise Size 2019 & 2032
- Table 35: Global Database Automation Industry Revenue Million Forecast, by End-user Industry 2019 & 2032
- Table 36: Global Database Automation Industry Revenue Million Forecast, by Country 2019 & 2032
- Table 37: Global Database Automation Industry Revenue Million Forecast, by Component 2019 & 2032
- Table 38: Global Database Automation Industry Revenue Million Forecast, by Deployment Mode 2019 & 2032
- Table 39: Global Database Automation Industry Revenue Million Forecast, by Enterprise Size 2019 & 2032
- Table 40: Global Database Automation Industry Revenue Million Forecast, by End-user Industry 2019 & 2032
- Table 41: Global Database Automation Industry Revenue Million Forecast, by Country 2019 & 2032
Frequently Asked Questions
1. What is the projected Compound Annual Growth Rate (CAGR) of the Database Automation Industry?
The projected CAGR is approximately 24.38%.
2. Which companies are prominent players in the Database Automation Industry?
Key companies in the market include IDERA Inc, IBM Corporation, Quest Software Inc, Datavail, BMC Software Inc, Bryter US Inc *List Not Exhaustive, Amazon Web Services Inc, CA Technologies (Broadcom Inc), Oracle Corporation, SAP SE.
3. What are the main segments of the Database Automation Industry?
The market segments include Component, Deployment Mode, Enterprise Size, End-user Industry.
4. Can you provide details about the market size?
The market size is estimated to be USD 2.35 Million as of 2022.
5. What are some drivers contributing to market growth?
Continuously Growing Volumes of Data Across Verticals; Increasing Demand for Automating Repetitive Database Management Processes.
6. What are the notable trends driving market growth?
IT and Telecommunication industry is Expected to Witness Significant Growth.
7. Are there any restraints impacting market growth?
; Managing Identities Across Multiple Operation Environments.
8. Can you provide examples of recent developments in the market?
June 2023: Aquatic Informatics launched a new automated data validation tool, HydroCorrect, that can accelerate proactive monitoring and management of flooding, groundwater, and water quality in the Aquarius platform. With machine-learning technology, HydroCorrect will transform the QA/QC process with automation and standardized workflows that save time and improve data quality.
9. What pricing options are available for accessing the report?
Pricing options include single-user, multi-user, and enterprise licenses priced at USD 4750, USD 5250, and USD 8750 respectively.
10. Is the market size provided in terms of value or volume?
The market size is provided in terms of value, measured in Million.
11. Are there any specific market keywords associated with the report?
Yes, the market keyword associated with the report is "Database Automation Industry," which aids in identifying and referencing the specific market segment covered.
12. How do I determine which pricing option suits my needs best?
The pricing options vary based on user requirements and access needs. Individual users may opt for single-user licenses, while businesses requiring broader access may choose multi-user or enterprise licenses for cost-effective access to the report.
13. Are there any additional resources or data provided in the Database Automation Industry report?
While the report offers comprehensive insights, it's advisable to review the specific contents or supplementary materials provided to ascertain if additional resources or data are available.
14. How can I stay updated on further developments or reports in the Database Automation Industry?
To stay informed about further developments, trends, and reports in the Database Automation Industry, consider subscribing to industry newsletters, following relevant companies and organizations, or regularly checking reputable industry news sources and publications.
Methodology
Step 1 - Identification of Relevant Samples Size from Population Database


Step 2 - Approaches for Defining Global Market Size (Value, Volume* & Price*)

Note*: In applicable scenarios
Step 3 - Data Sources
Primary Research
- Web Analytics
- Survey Reports
- Research Institute
- Latest Research Reports
- Opinion Leaders
Secondary Research
- Annual Reports
- White Paper
- Latest Press Release
- Industry Association
- Paid Database
- Investor Presentations

Step 4 - Data Triangulation
Involves using different sources of information in order to increase the validity of a study
These sources are likely to be stakeholders in a program - participants, other researchers, program staff, other community members, and so on.
Then we put all data in single framework & apply various statistical tools to find out the dynamic on the market.
During the analysis stage, feedback from the stakeholder groups would be compared to determine areas of agreement as well as areas of divergence
