

Key Insights
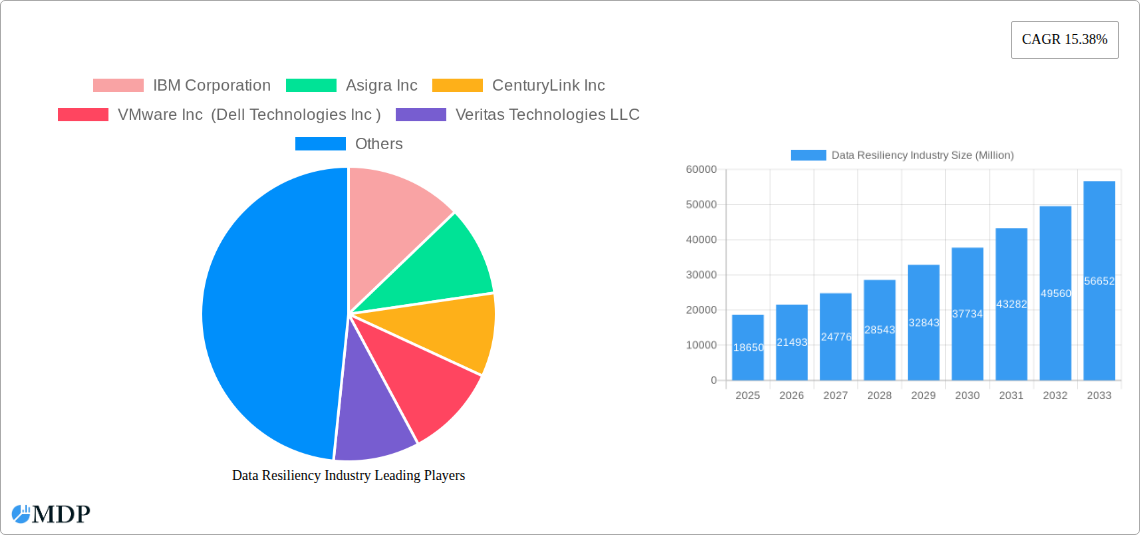
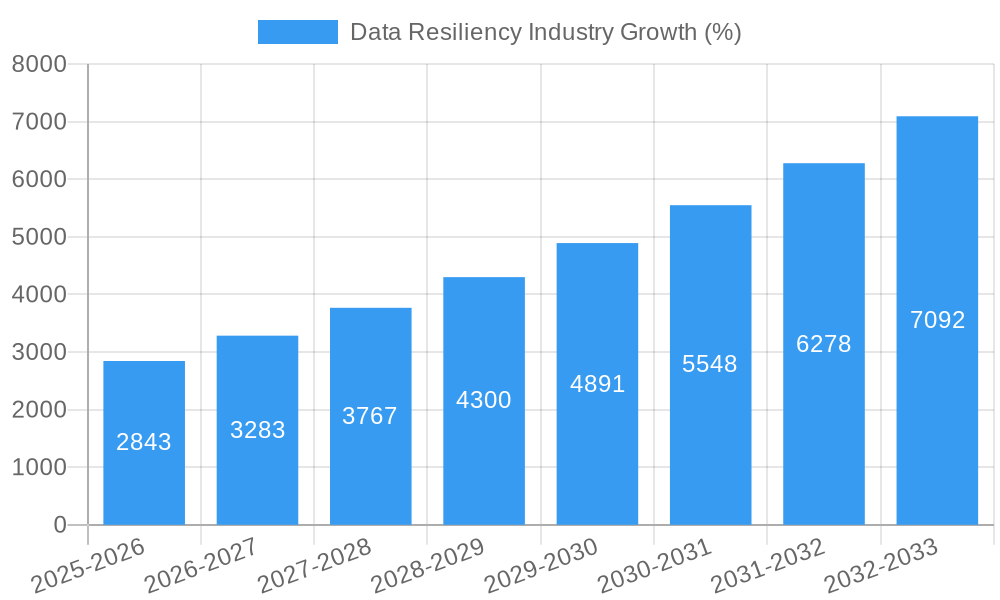
The data resiliency market, valued at $18.65 billion in 2025, is experiencing robust growth, projected to expand at a Compound Annual Growth Rate (CAGR) of 15.38% from 2025 to 2033. This surge is driven by the escalating volume and value of digital data, increasing cyber threats, and stringent regulatory compliance requirements mandating robust data protection strategies across various sectors. The cloud deployment model is a significant growth driver, offering scalability, cost-effectiveness, and enhanced accessibility compared to on-premise solutions. Key industry trends include the adoption of artificial intelligence (AI) and machine learning (ML) for advanced threat detection and automated recovery, along with a growing focus on data immutability and ransomware protection. While the market faces restraints such as the complexity of implementing and managing data resiliency solutions and the potential for high initial investment costs, the overall market outlook remains overwhelmingly positive. The BFSI, IT & Telecommunication, and Government sectors are leading adopters, reflecting their critical dependence on data availability and security. Competitive landscape analysis indicates a mix of established players like IBM, Microsoft, and Dell Technologies, alongside specialized vendors like Acronis and Veritas, continuously innovating to meet evolving market demands.
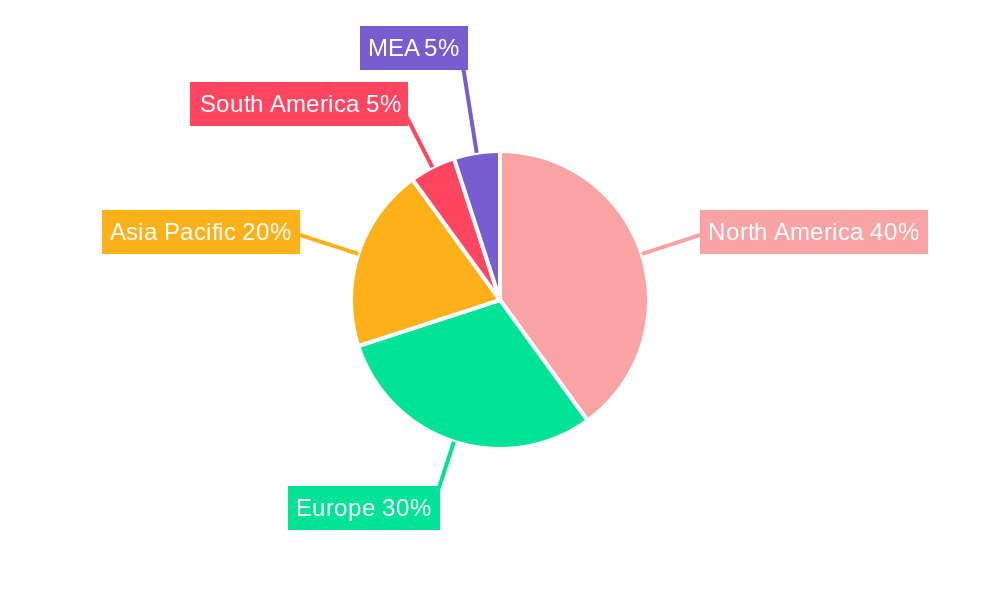
The geographic distribution of the market reveals strong growth across North America and Europe, driven by high technology adoption and stringent data protection regulations. However, the Asia-Pacific region is expected to witness substantial growth due to increasing digitalization and a rising need for data security in rapidly developing economies. The market segmentation by deployment (on-premise vs. cloud) and end-user vertical (BFSI, IT, Government, etc.) highlights diverse opportunities for vendors to tailor solutions to specific customer needs. Future growth will be influenced by advancements in data storage technologies, the development of more sophisticated security protocols, and the increasing adoption of hybrid cloud models. The market's trajectory is strongly linked to overall digital transformation initiatives and the escalating need for business continuity and disaster recovery planning.
Data Resiliency Industry Market Report: 2019-2033 - A Comprehensive Analysis
This in-depth report provides a comprehensive analysis of the Data Resiliency Industry, projecting a market value of $XX Million by 2033. It covers market dynamics, leading players like IBM, Microsoft, and VMware, and emerging trends shaping this crucial sector. Ideal for investors, industry professionals, and strategic planners, this report offers actionable insights and forecasts to navigate the evolving landscape of data protection and recovery. The study period spans from 2019 to 2033, with 2025 serving as the base and estimated year.
Data Resiliency Industry Market Dynamics & Concentration
The Data Resiliency Industry is characterized by a moderately concentrated market, with key players like IBM Corporation, Microsoft Corporation, and VMware Inc. holding significant market share. In 2024, the top 5 players collectively held an estimated 45% of the market. However, the market exhibits strong innovation, driven by advancements in cloud technologies, AI-powered data management, and increasing regulatory pressure concerning data protection (e.g., GDPR, CCPA). The industry witnesses frequent mergers and acquisitions (M&A) activities, with an estimated XX M&A deals concluded in the historical period (2019-2024). This consolidative trend is expected to continue, with a projected XX deals during the forecast period (2025-2033). Substitute products, such as basic backup solutions, exist but lack the sophisticated features and comprehensive protection offered by advanced data resiliency solutions. End-user trends demonstrate a clear shift towards cloud-based solutions, driven by scalability and cost-effectiveness.
- Market Share (2024): Top 5 players: 45%, Others: 55%
- M&A Deal Count (2019-2024): XX
- Projected M&A Deal Count (2025-2033): XX
Data Resiliency Industry Industry Trends & Analysis
The Data Resiliency Industry is experiencing robust growth, driven by the exponential increase in data volume, stringent data privacy regulations, and the rising frequency of cyberattacks. The market is projected to register a CAGR of XX% during the forecast period (2025-2033), reaching $XX Million by 2033. This growth is fueled by technological disruptions, such as the adoption of cloud-native architectures, edge computing, and AI-driven automation in data protection. Consumer preferences are shifting towards integrated solutions offering comprehensive data protection and recovery capabilities, encompassing backup, replication, disaster recovery, and data archiving. Competitive dynamics are marked by continuous innovation, strategic partnerships, and M&A activities, leading to increased product differentiation and enhanced market offerings. Market penetration of cloud-based data resiliency solutions is expected to reach XX% by 2033, signifying a substantial shift from on-premise deployments.
Leading Markets & Segments in Data Resiliency Industry
The North American region currently dominates the Data Resiliency Industry, driven by strong technological advancements, a robust IT infrastructure, and the presence of major industry players. However, the Asia-Pacific region is expected to exhibit the highest growth rate during the forecast period, fueled by increasing digitalization and the adoption of cloud technologies.
By Deployment:
- Cloud: Rapid growth is driven by scalability, cost-effectiveness, and accessibility. Key drivers include increasing cloud adoption across various industries and the development of cloud-native data resiliency solutions.
- On-Premise: While experiencing slower growth, on-premise deployments remain relevant for organizations with stringent data security requirements or legacy systems.
By End-user Vertical:
- BFSI: This sector exhibits the highest demand for data resiliency solutions, driven by stringent regulatory compliance and the criticality of data integrity.
- IT & Telecommunication: The sector demonstrates high adoption rates due to the inherent need for high data availability and business continuity.
- Healthcare: Growing data volumes and stringent regulatory compliance requirements fuel growth in this segment.
- Government: Government agencies are increasing their investments in robust data protection infrastructure to ensure data sovereignty and security.
Data Resiliency Industry Product Developments
Recent product innovations focus on enhanced automation, AI-powered data protection, and seamless integration with cloud platforms. New solutions offer advanced features such as granular recovery options, automated disaster recovery orchestration, and improved data deduplication techniques. These innovations enhance efficiency and reduce the total cost of ownership (TCO), improving market fit by meeting the evolving needs of businesses for enhanced protection and reduced operational costs.
Key Drivers of Data Resiliency Industry Growth
Several factors fuel the growth of the Data Resiliency Industry. These include:
- Increasing data volume and velocity: The exponential growth of data necessitates robust data protection and recovery capabilities.
- Stringent data privacy regulations: Compliance with regulations like GDPR and CCPA mandates robust data protection solutions.
- Rising cyberattacks: The growing frequency and sophistication of cyberattacks necessitate advanced data resiliency measures.
- Technological advancements: Innovations in cloud computing, AI, and machine learning drive the development of more efficient and effective data resiliency solutions.
Challenges in the Data Resiliency Industry Market
The Data Resiliency Industry faces several challenges:
- Complexity of data environments: Managing data across diverse environments (cloud, on-premise, edge) presents significant challenges.
- High implementation costs: Deploying advanced data resiliency solutions can be expensive, particularly for smaller organizations.
- Skill shortage: A shortage of skilled professionals experienced in data protection and recovery technologies limits implementation and management capabilities.
- Integration complexity: Integrating various data resiliency solutions into existing IT infrastructure can be complex and time-consuming.
Emerging Opportunities in Data Resiliency Industry
The Data Resiliency Industry is poised for significant growth, driven by:
- Expansion of cloud adoption: The increasing migration to cloud environments creates new opportunities for cloud-native data resiliency solutions.
- Advancements in AI and machine learning: AI and ML are transforming data protection by enabling advanced threat detection and automated recovery processes.
- Strategic partnerships: Collaboration between technology providers expands market reach and strengthens offerings.
- Growth in emerging markets: Developing economies present significant growth potential as businesses increase data protection investments.
Leading Players in the Data Resiliency Industry Sector
- IBM Corporation
- Asigra Inc
- CenturyLink Inc
- VMware Inc (Dell Technologies Inc)
- Veritas Technologies LLC
- Microsoft Corporation
- NetApp Inc
- Carbonite Inc (OpenText Corporation)
- Acronis International GmbH
- Micro Focus International plc
- Commvault Systems Inc
Key Milestones in Data Resiliency Industry Industry
- 2020: Increased adoption of cloud-based backup and recovery solutions.
- 2021: Significant investments in AI-powered data protection technologies.
- 2022: Growing emphasis on ransomware protection and recovery strategies.
- 2023: Increased focus on data sovereignty and compliance with global regulations.
- 2024: Several key mergers and acquisitions reshaping the industry landscape.
Strategic Outlook for Data Resiliency Industry Market
The Data Resiliency Industry is poised for continued growth, driven by the ever-increasing volume and value of data, coupled with heightened cybersecurity concerns. Strategic opportunities exist for companies focusing on AI-driven automation, enhanced cloud integration, and comprehensive data protection solutions catering to specific industry needs. The market's future hinges on continuous innovation, strategic partnerships, and agile adaptation to the ever-evolving threat landscape. The market's robust growth trajectory is expected to persist throughout the forecast period, driven by strong underlying trends and technological advancements.
Data Resiliency Industry Segmentation
-
1. Deployment
- 1.1. On-premise
- 1.2. Cloud
-
2. End-user Vertical
- 2.1. BFSI
- 2.2. IT & Telecommunication
- 2.3. Government
- 2.4. Manufacturing
- 2.5. Healthcare
- 2.6. Other End-user Vertical
Data Resiliency Industry Segmentation By Geography
- 1. North America
- 2. Europe
- 3. Asia Pacific
- 4. Latin America
- 5. Middle East
Data Resiliency Industry REPORT HIGHLIGHTS
| Aspects | Details |
|---|---|
| Study Period | 2019-2033 |
| Base Year | 2024 |
| Estimated Year | 2025 |
| Forecast Period | 2025-2033 |
| Historical Period | 2019-2024 |
| Growth Rate | CAGR of 15.38% from 2019-2033 |
| Segmentation |
|
Table of Contents
- 1. Introduction
- 1.1. Research Scope
- 1.2. Market Segmentation
- 1.3. Research Methodology
- 1.4. Definitions and Assumptions
- 2. Executive Summary
- 2.1. Introduction
- 3. Market Dynamics
- 3.1. Introduction
- 3.2. Market Drivers
- 3.2.1. ; Rapid Growth in Data being Generated from Multiple Sources; Increasing Privacy Concerns and Rising Need for Data Security
- 3.3. Market Restrains
- 3.3.1. ; Availability of open-source alternatives
- 3.4. Market Trends
- 3.4.1. BFSI Segment is Expected to Witness Significant Growth
- 4. Market Factor Analysis
- 4.1. Porters Five Forces
- 4.2. Supply/Value Chain
- 4.3. PESTEL analysis
- 4.4. Market Entropy
- 4.5. Patent/Trademark Analysis
- 5. Global Data Resiliency Industry Analysis, Insights and Forecast, 2019-2031
- 5.1. Market Analysis, Insights and Forecast - by Deployment
- 5.1.1. On-premise
- 5.1.2. Cloud
- 5.2. Market Analysis, Insights and Forecast - by End-user Vertical
- 5.2.1. BFSI
- 5.2.2. IT & Telecommunication
- 5.2.3. Government
- 5.2.4. Manufacturing
- 5.2.5. Healthcare
- 5.2.6. Other End-user Vertical
- 5.3. Market Analysis, Insights and Forecast - by Region
- 5.3.1. North America
- 5.3.2. Europe
- 5.3.3. Asia Pacific
- 5.3.4. Latin America
- 5.3.5. Middle East
- 5.1. Market Analysis, Insights and Forecast - by Deployment
- 6. North America Data Resiliency Industry Analysis, Insights and Forecast, 2019-2031
- 6.1. Market Analysis, Insights and Forecast - by Deployment
- 6.1.1. On-premise
- 6.1.2. Cloud
- 6.2. Market Analysis, Insights and Forecast - by End-user Vertical
- 6.2.1. BFSI
- 6.2.2. IT & Telecommunication
- 6.2.3. Government
- 6.2.4. Manufacturing
- 6.2.5. Healthcare
- 6.2.6. Other End-user Vertical
- 6.1. Market Analysis, Insights and Forecast - by Deployment
- 7. Europe Data Resiliency Industry Analysis, Insights and Forecast, 2019-2031
- 7.1. Market Analysis, Insights and Forecast - by Deployment
- 7.1.1. On-premise
- 7.1.2. Cloud
- 7.2. Market Analysis, Insights and Forecast - by End-user Vertical
- 7.2.1. BFSI
- 7.2.2. IT & Telecommunication
- 7.2.3. Government
- 7.2.4. Manufacturing
- 7.2.5. Healthcare
- 7.2.6. Other End-user Vertical
- 7.1. Market Analysis, Insights and Forecast - by Deployment
- 8. Asia Pacific Data Resiliency Industry Analysis, Insights and Forecast, 2019-2031
- 8.1. Market Analysis, Insights and Forecast - by Deployment
- 8.1.1. On-premise
- 8.1.2. Cloud
- 8.2. Market Analysis, Insights and Forecast - by End-user Vertical
- 8.2.1. BFSI
- 8.2.2. IT & Telecommunication
- 8.2.3. Government
- 8.2.4. Manufacturing
- 8.2.5. Healthcare
- 8.2.6. Other End-user Vertical
- 8.1. Market Analysis, Insights and Forecast - by Deployment
- 9. Latin America Data Resiliency Industry Analysis, Insights and Forecast, 2019-2031
- 9.1. Market Analysis, Insights and Forecast - by Deployment
- 9.1.1. On-premise
- 9.1.2. Cloud
- 9.2. Market Analysis, Insights and Forecast - by End-user Vertical
- 9.2.1. BFSI
- 9.2.2. IT & Telecommunication
- 9.2.3. Government
- 9.2.4. Manufacturing
- 9.2.5. Healthcare
- 9.2.6. Other End-user Vertical
- 9.1. Market Analysis, Insights and Forecast - by Deployment
- 10. Middle East Data Resiliency Industry Analysis, Insights and Forecast, 2019-2031
- 10.1. Market Analysis, Insights and Forecast - by Deployment
- 10.1.1. On-premise
- 10.1.2. Cloud
- 10.2. Market Analysis, Insights and Forecast - by End-user Vertical
- 10.2.1. BFSI
- 10.2.2. IT & Telecommunication
- 10.2.3. Government
- 10.2.4. Manufacturing
- 10.2.5. Healthcare
- 10.2.6. Other End-user Vertical
- 10.1. Market Analysis, Insights and Forecast - by Deployment
- 11. North America Data Resiliency Industry Analysis, Insights and Forecast, 2019-2031
- 11.1. Market Analysis, Insights and Forecast - By Country/Sub-region
- 11.1.1 United States
- 11.1.2 Canada
- 11.1.3 Mexico
- 12. Europe Data Resiliency Industry Analysis, Insights and Forecast, 2019-2031
- 12.1. Market Analysis, Insights and Forecast - By Country/Sub-region
- 12.1.1 Germany
- 12.1.2 United Kingdom
- 12.1.3 France
- 12.1.4 Spain
- 12.1.5 Italy
- 12.1.6 Spain
- 12.1.7 Belgium
- 12.1.8 Netherland
- 12.1.9 Nordics
- 12.1.10 Rest of Europe
- 13. Asia Pacific Data Resiliency Industry Analysis, Insights and Forecast, 2019-2031
- 13.1. Market Analysis, Insights and Forecast - By Country/Sub-region
- 13.1.1 China
- 13.1.2 Japan
- 13.1.3 India
- 13.1.4 South Korea
- 13.1.5 Southeast Asia
- 13.1.6 Australia
- 13.1.7 Indonesia
- 13.1.8 Phillipes
- 13.1.9 Singapore
- 13.1.10 Thailandc
- 13.1.11 Rest of Asia Pacific
- 14. South America Data Resiliency Industry Analysis, Insights and Forecast, 2019-2031
- 14.1. Market Analysis, Insights and Forecast - By Country/Sub-region
- 14.1.1 Brazil
- 14.1.2 Argentina
- 14.1.3 Peru
- 14.1.4 Chile
- 14.1.5 Colombia
- 14.1.6 Ecuador
- 14.1.7 Venezuela
- 14.1.8 Rest of South America
- 15. North America Data Resiliency Industry Analysis, Insights and Forecast, 2019-2031
- 15.1. Market Analysis, Insights and Forecast - By Country/Sub-region
- 15.1.1 United States
- 15.1.2 Canada
- 15.1.3 Mexico
- 16. MEA Data Resiliency Industry Analysis, Insights and Forecast, 2019-2031
- 16.1. Market Analysis, Insights and Forecast - By Country/Sub-region
- 16.1.1 United Arab Emirates
- 16.1.2 Saudi Arabia
- 16.1.3 South Africa
- 16.1.4 Rest of Middle East and Africa
- 17. Competitive Analysis
- 17.1. Global Market Share Analysis 2024
- 17.2. Company Profiles
- 17.2.1 IBM Corporation
- 17.2.1.1. Overview
- 17.2.1.2. Products
- 17.2.1.3. SWOT Analysis
- 17.2.1.4. Recent Developments
- 17.2.1.5. Financials (Based on Availability)
- 17.2.2 Asigra Inc
- 17.2.2.1. Overview
- 17.2.2.2. Products
- 17.2.2.3. SWOT Analysis
- 17.2.2.4. Recent Developments
- 17.2.2.5. Financials (Based on Availability)
- 17.2.3 CenturyLink Inc
- 17.2.3.1. Overview
- 17.2.3.2. Products
- 17.2.3.3. SWOT Analysis
- 17.2.3.4. Recent Developments
- 17.2.3.5. Financials (Based on Availability)
- 17.2.4 VMware Inc (Dell Technologies Inc )
- 17.2.4.1. Overview
- 17.2.4.2. Products
- 17.2.4.3. SWOT Analysis
- 17.2.4.4. Recent Developments
- 17.2.4.5. Financials (Based on Availability)
- 17.2.5 Veritas Technologies LLC
- 17.2.5.1. Overview
- 17.2.5.2. Products
- 17.2.5.3. SWOT Analysis
- 17.2.5.4. Recent Developments
- 17.2.5.5. Financials (Based on Availability)
- 17.2.6 Microsoft Corporation
- 17.2.6.1. Overview
- 17.2.6.2. Products
- 17.2.6.3. SWOT Analysis
- 17.2.6.4. Recent Developments
- 17.2.6.5. Financials (Based on Availability)
- 17.2.7 NetApp Inc
- 17.2.7.1. Overview
- 17.2.7.2. Products
- 17.2.7.3. SWOT Analysis
- 17.2.7.4. Recent Developments
- 17.2.7.5. Financials (Based on Availability)
- 17.2.8 Carbonite Inc (OpenText Corporation)
- 17.2.8.1. Overview
- 17.2.8.2. Products
- 17.2.8.3. SWOT Analysis
- 17.2.8.4. Recent Developments
- 17.2.8.5. Financials (Based on Availability)
- 17.2.9 Acronis International GmbH
- 17.2.9.1. Overview
- 17.2.9.2. Products
- 17.2.9.3. SWOT Analysis
- 17.2.9.4. Recent Developments
- 17.2.9.5. Financials (Based on Availability)
- 17.2.10 Micro Focus International plc
- 17.2.10.1. Overview
- 17.2.10.2. Products
- 17.2.10.3. SWOT Analysis
- 17.2.10.4. Recent Developments
- 17.2.10.5. Financials (Based on Availability)
- 17.2.11 Commvault Systems Inc
- 17.2.11.1. Overview
- 17.2.11.2. Products
- 17.2.11.3. SWOT Analysis
- 17.2.11.4. Recent Developments
- 17.2.11.5. Financials (Based on Availability)
- 17.2.1 IBM Corporation
List of Figures
- Figure 1: Global Data Resiliency Industry Revenue Breakdown (Million, %) by Region 2024 & 2032
- Figure 2: Global Data Resiliency Industry Volume Breakdown (K Unit, %) by Region 2024 & 2032
- Figure 3: North America Data Resiliency Industry Revenue (Million), by Country 2024 & 2032
- Figure 4: North America Data Resiliency Industry Volume (K Unit), by Country 2024 & 2032
- Figure 5: North America Data Resiliency Industry Revenue Share (%), by Country 2024 & 2032
- Figure 6: North America Data Resiliency Industry Volume Share (%), by Country 2024 & 2032
- Figure 7: Europe Data Resiliency Industry Revenue (Million), by Country 2024 & 2032
- Figure 8: Europe Data Resiliency Industry Volume (K Unit), by Country 2024 & 2032
- Figure 9: Europe Data Resiliency Industry Revenue Share (%), by Country 2024 & 2032
- Figure 10: Europe Data Resiliency Industry Volume Share (%), by Country 2024 & 2032
- Figure 11: Asia Pacific Data Resiliency Industry Revenue (Million), by Country 2024 & 2032
- Figure 12: Asia Pacific Data Resiliency Industry Volume (K Unit), by Country 2024 & 2032
- Figure 13: Asia Pacific Data Resiliency Industry Revenue Share (%), by Country 2024 & 2032
- Figure 14: Asia Pacific Data Resiliency Industry Volume Share (%), by Country 2024 & 2032
- Figure 15: South America Data Resiliency Industry Revenue (Million), by Country 2024 & 2032
- Figure 16: South America Data Resiliency Industry Volume (K Unit), by Country 2024 & 2032
- Figure 17: South America Data Resiliency Industry Revenue Share (%), by Country 2024 & 2032
- Figure 18: South America Data Resiliency Industry Volume Share (%), by Country 2024 & 2032
- Figure 19: North America Data Resiliency Industry Revenue (Million), by Country 2024 & 2032
- Figure 20: North America Data Resiliency Industry Volume (K Unit), by Country 2024 & 2032
- Figure 21: North America Data Resiliency Industry Revenue Share (%), by Country 2024 & 2032
- Figure 22: North America Data Resiliency Industry Volume Share (%), by Country 2024 & 2032
- Figure 23: MEA Data Resiliency Industry Revenue (Million), by Country 2024 & 2032
- Figure 24: MEA Data Resiliency Industry Volume (K Unit), by Country 2024 & 2032
- Figure 25: MEA Data Resiliency Industry Revenue Share (%), by Country 2024 & 2032
- Figure 26: MEA Data Resiliency Industry Volume Share (%), by Country 2024 & 2032
- Figure 27: North America Data Resiliency Industry Revenue (Million), by Deployment 2024 & 2032
- Figure 28: North America Data Resiliency Industry Volume (K Unit), by Deployment 2024 & 2032
- Figure 29: North America Data Resiliency Industry Revenue Share (%), by Deployment 2024 & 2032
- Figure 30: North America Data Resiliency Industry Volume Share (%), by Deployment 2024 & 2032
- Figure 31: North America Data Resiliency Industry Revenue (Million), by End-user Vertical 2024 & 2032
- Figure 32: North America Data Resiliency Industry Volume (K Unit), by End-user Vertical 2024 & 2032
- Figure 33: North America Data Resiliency Industry Revenue Share (%), by End-user Vertical 2024 & 2032
- Figure 34: North America Data Resiliency Industry Volume Share (%), by End-user Vertical 2024 & 2032
- Figure 35: North America Data Resiliency Industry Revenue (Million), by Country 2024 & 2032
- Figure 36: North America Data Resiliency Industry Volume (K Unit), by Country 2024 & 2032
- Figure 37: North America Data Resiliency Industry Revenue Share (%), by Country 2024 & 2032
- Figure 38: North America Data Resiliency Industry Volume Share (%), by Country 2024 & 2032
- Figure 39: Europe Data Resiliency Industry Revenue (Million), by Deployment 2024 & 2032
- Figure 40: Europe Data Resiliency Industry Volume (K Unit), by Deployment 2024 & 2032
- Figure 41: Europe Data Resiliency Industry Revenue Share (%), by Deployment 2024 & 2032
- Figure 42: Europe Data Resiliency Industry Volume Share (%), by Deployment 2024 & 2032
- Figure 43: Europe Data Resiliency Industry Revenue (Million), by End-user Vertical 2024 & 2032
- Figure 44: Europe Data Resiliency Industry Volume (K Unit), by End-user Vertical 2024 & 2032
- Figure 45: Europe Data Resiliency Industry Revenue Share (%), by End-user Vertical 2024 & 2032
- Figure 46: Europe Data Resiliency Industry Volume Share (%), by End-user Vertical 2024 & 2032
- Figure 47: Europe Data Resiliency Industry Revenue (Million), by Country 2024 & 2032
- Figure 48: Europe Data Resiliency Industry Volume (K Unit), by Country 2024 & 2032
- Figure 49: Europe Data Resiliency Industry Revenue Share (%), by Country 2024 & 2032
- Figure 50: Europe Data Resiliency Industry Volume Share (%), by Country 2024 & 2032
- Figure 51: Asia Pacific Data Resiliency Industry Revenue (Million), by Deployment 2024 & 2032
- Figure 52: Asia Pacific Data Resiliency Industry Volume (K Unit), by Deployment 2024 & 2032
- Figure 53: Asia Pacific Data Resiliency Industry Revenue Share (%), by Deployment 2024 & 2032
- Figure 54: Asia Pacific Data Resiliency Industry Volume Share (%), by Deployment 2024 & 2032
- Figure 55: Asia Pacific Data Resiliency Industry Revenue (Million), by End-user Vertical 2024 & 2032
- Figure 56: Asia Pacific Data Resiliency Industry Volume (K Unit), by End-user Vertical 2024 & 2032
- Figure 57: Asia Pacific Data Resiliency Industry Revenue Share (%), by End-user Vertical 2024 & 2032
- Figure 58: Asia Pacific Data Resiliency Industry Volume Share (%), by End-user Vertical 2024 & 2032
- Figure 59: Asia Pacific Data Resiliency Industry Revenue (Million), by Country 2024 & 2032
- Figure 60: Asia Pacific Data Resiliency Industry Volume (K Unit), by Country 2024 & 2032
- Figure 61: Asia Pacific Data Resiliency Industry Revenue Share (%), by Country 2024 & 2032
- Figure 62: Asia Pacific Data Resiliency Industry Volume Share (%), by Country 2024 & 2032
- Figure 63: Latin America Data Resiliency Industry Revenue (Million), by Deployment 2024 & 2032
- Figure 64: Latin America Data Resiliency Industry Volume (K Unit), by Deployment 2024 & 2032
- Figure 65: Latin America Data Resiliency Industry Revenue Share (%), by Deployment 2024 & 2032
- Figure 66: Latin America Data Resiliency Industry Volume Share (%), by Deployment 2024 & 2032
- Figure 67: Latin America Data Resiliency Industry Revenue (Million), by End-user Vertical 2024 & 2032
- Figure 68: Latin America Data Resiliency Industry Volume (K Unit), by End-user Vertical 2024 & 2032
- Figure 69: Latin America Data Resiliency Industry Revenue Share (%), by End-user Vertical 2024 & 2032
- Figure 70: Latin America Data Resiliency Industry Volume Share (%), by End-user Vertical 2024 & 2032
- Figure 71: Latin America Data Resiliency Industry Revenue (Million), by Country 2024 & 2032
- Figure 72: Latin America Data Resiliency Industry Volume (K Unit), by Country 2024 & 2032
- Figure 73: Latin America Data Resiliency Industry Revenue Share (%), by Country 2024 & 2032
- Figure 74: Latin America Data Resiliency Industry Volume Share (%), by Country 2024 & 2032
- Figure 75: Middle East Data Resiliency Industry Revenue (Million), by Deployment 2024 & 2032
- Figure 76: Middle East Data Resiliency Industry Volume (K Unit), by Deployment 2024 & 2032
- Figure 77: Middle East Data Resiliency Industry Revenue Share (%), by Deployment 2024 & 2032
- Figure 78: Middle East Data Resiliency Industry Volume Share (%), by Deployment 2024 & 2032
- Figure 79: Middle East Data Resiliency Industry Revenue (Million), by End-user Vertical 2024 & 2032
- Figure 80: Middle East Data Resiliency Industry Volume (K Unit), by End-user Vertical 2024 & 2032
- Figure 81: Middle East Data Resiliency Industry Revenue Share (%), by End-user Vertical 2024 & 2032
- Figure 82: Middle East Data Resiliency Industry Volume Share (%), by End-user Vertical 2024 & 2032
- Figure 83: Middle East Data Resiliency Industry Revenue (Million), by Country 2024 & 2032
- Figure 84: Middle East Data Resiliency Industry Volume (K Unit), by Country 2024 & 2032
- Figure 85: Middle East Data Resiliency Industry Revenue Share (%), by Country 2024 & 2032
- Figure 86: Middle East Data Resiliency Industry Volume Share (%), by Country 2024 & 2032
List of Tables
- Table 1: Global Data Resiliency Industry Revenue Million Forecast, by Region 2019 & 2032
- Table 2: Global Data Resiliency Industry Volume K Unit Forecast, by Region 2019 & 2032
- Table 3: Global Data Resiliency Industry Revenue Million Forecast, by Deployment 2019 & 2032
- Table 4: Global Data Resiliency Industry Volume K Unit Forecast, by Deployment 2019 & 2032
- Table 5: Global Data Resiliency Industry Revenue Million Forecast, by End-user Vertical 2019 & 2032
- Table 6: Global Data Resiliency Industry Volume K Unit Forecast, by End-user Vertical 2019 & 2032
- Table 7: Global Data Resiliency Industry Revenue Million Forecast, by Region 2019 & 2032
- Table 8: Global Data Resiliency Industry Volume K Unit Forecast, by Region 2019 & 2032
- Table 9: Global Data Resiliency Industry Revenue Million Forecast, by Country 2019 & 2032
- Table 10: Global Data Resiliency Industry Volume K Unit Forecast, by Country 2019 & 2032
- Table 11: United States Data Resiliency Industry Revenue (Million) Forecast, by Application 2019 & 2032
- Table 12: United States Data Resiliency Industry Volume (K Unit) Forecast, by Application 2019 & 2032
- Table 13: Canada Data Resiliency Industry Revenue (Million) Forecast, by Application 2019 & 2032
- Table 14: Canada Data Resiliency Industry Volume (K Unit) Forecast, by Application 2019 & 2032
- Table 15: Mexico Data Resiliency Industry Revenue (Million) Forecast, by Application 2019 & 2032
- Table 16: Mexico Data Resiliency Industry Volume (K Unit) Forecast, by Application 2019 & 2032
- Table 17: Global Data Resiliency Industry Revenue Million Forecast, by Country 2019 & 2032
- Table 18: Global Data Resiliency Industry Volume K Unit Forecast, by Country 2019 & 2032
- Table 19: Germany Data Resiliency Industry Revenue (Million) Forecast, by Application 2019 & 2032
- Table 20: Germany Data Resiliency Industry Volume (K Unit) Forecast, by Application 2019 & 2032
- Table 21: United Kingdom Data Resiliency Industry Revenue (Million) Forecast, by Application 2019 & 2032
- Table 22: United Kingdom Data Resiliency Industry Volume (K Unit) Forecast, by Application 2019 & 2032
- Table 23: France Data Resiliency Industry Revenue (Million) Forecast, by Application 2019 & 2032
- Table 24: France Data Resiliency Industry Volume (K Unit) Forecast, by Application 2019 & 2032
- Table 25: Spain Data Resiliency Industry Revenue (Million) Forecast, by Application 2019 & 2032
- Table 26: Spain Data Resiliency Industry Volume (K Unit) Forecast, by Application 2019 & 2032
- Table 27: Italy Data Resiliency Industry Revenue (Million) Forecast, by Application 2019 & 2032
- Table 28: Italy Data Resiliency Industry Volume (K Unit) Forecast, by Application 2019 & 2032
- Table 29: Spain Data Resiliency Industry Revenue (Million) Forecast, by Application 2019 & 2032
- Table 30: Spain Data Resiliency Industry Volume (K Unit) Forecast, by Application 2019 & 2032
- Table 31: Belgium Data Resiliency Industry Revenue (Million) Forecast, by Application 2019 & 2032
- Table 32: Belgium Data Resiliency Industry Volume (K Unit) Forecast, by Application 2019 & 2032
- Table 33: Netherland Data Resiliency Industry Revenue (Million) Forecast, by Application 2019 & 2032
- Table 34: Netherland Data Resiliency Industry Volume (K Unit) Forecast, by Application 2019 & 2032
- Table 35: Nordics Data Resiliency Industry Revenue (Million) Forecast, by Application 2019 & 2032
- Table 36: Nordics Data Resiliency Industry Volume (K Unit) Forecast, by Application 2019 & 2032
- Table 37: Rest of Europe Data Resiliency Industry Revenue (Million) Forecast, by Application 2019 & 2032
- Table 38: Rest of Europe Data Resiliency Industry Volume (K Unit) Forecast, by Application 2019 & 2032
- Table 39: Global Data Resiliency Industry Revenue Million Forecast, by Country 2019 & 2032
- Table 40: Global Data Resiliency Industry Volume K Unit Forecast, by Country 2019 & 2032
- Table 41: China Data Resiliency Industry Revenue (Million) Forecast, by Application 2019 & 2032
- Table 42: China Data Resiliency Industry Volume (K Unit) Forecast, by Application 2019 & 2032
- Table 43: Japan Data Resiliency Industry Revenue (Million) Forecast, by Application 2019 & 2032
- Table 44: Japan Data Resiliency Industry Volume (K Unit) Forecast, by Application 2019 & 2032
- Table 45: India Data Resiliency Industry Revenue (Million) Forecast, by Application 2019 & 2032
- Table 46: India Data Resiliency Industry Volume (K Unit) Forecast, by Application 2019 & 2032
- Table 47: South Korea Data Resiliency Industry Revenue (Million) Forecast, by Application 2019 & 2032
- Table 48: South Korea Data Resiliency Industry Volume (K Unit) Forecast, by Application 2019 & 2032
- Table 49: Southeast Asia Data Resiliency Industry Revenue (Million) Forecast, by Application 2019 & 2032
- Table 50: Southeast Asia Data Resiliency Industry Volume (K Unit) Forecast, by Application 2019 & 2032
- Table 51: Australia Data Resiliency Industry Revenue (Million) Forecast, by Application 2019 & 2032
- Table 52: Australia Data Resiliency Industry Volume (K Unit) Forecast, by Application 2019 & 2032
- Table 53: Indonesia Data Resiliency Industry Revenue (Million) Forecast, by Application 2019 & 2032
- Table 54: Indonesia Data Resiliency Industry Volume (K Unit) Forecast, by Application 2019 & 2032
- Table 55: Phillipes Data Resiliency Industry Revenue (Million) Forecast, by Application 2019 & 2032
- Table 56: Phillipes Data Resiliency Industry Volume (K Unit) Forecast, by Application 2019 & 2032
- Table 57: Singapore Data Resiliency Industry Revenue (Million) Forecast, by Application 2019 & 2032
- Table 58: Singapore Data Resiliency Industry Volume (K Unit) Forecast, by Application 2019 & 2032
- Table 59: Thailandc Data Resiliency Industry Revenue (Million) Forecast, by Application 2019 & 2032
- Table 60: Thailandc Data Resiliency Industry Volume (K Unit) Forecast, by Application 2019 & 2032
- Table 61: Rest of Asia Pacific Data Resiliency Industry Revenue (Million) Forecast, by Application 2019 & 2032
- Table 62: Rest of Asia Pacific Data Resiliency Industry Volume (K Unit) Forecast, by Application 2019 & 2032
- Table 63: Global Data Resiliency Industry Revenue Million Forecast, by Country 2019 & 2032
- Table 64: Global Data Resiliency Industry Volume K Unit Forecast, by Country 2019 & 2032
- Table 65: Brazil Data Resiliency Industry Revenue (Million) Forecast, by Application 2019 & 2032
- Table 66: Brazil Data Resiliency Industry Volume (K Unit) Forecast, by Application 2019 & 2032
- Table 67: Argentina Data Resiliency Industry Revenue (Million) Forecast, by Application 2019 & 2032
- Table 68: Argentina Data Resiliency Industry Volume (K Unit) Forecast, by Application 2019 & 2032
- Table 69: Peru Data Resiliency Industry Revenue (Million) Forecast, by Application 2019 & 2032
- Table 70: Peru Data Resiliency Industry Volume (K Unit) Forecast, by Application 2019 & 2032
- Table 71: Chile Data Resiliency Industry Revenue (Million) Forecast, by Application 2019 & 2032
- Table 72: Chile Data Resiliency Industry Volume (K Unit) Forecast, by Application 2019 & 2032
- Table 73: Colombia Data Resiliency Industry Revenue (Million) Forecast, by Application 2019 & 2032
- Table 74: Colombia Data Resiliency Industry Volume (K Unit) Forecast, by Application 2019 & 2032
- Table 75: Ecuador Data Resiliency Industry Revenue (Million) Forecast, by Application 2019 & 2032
- Table 76: Ecuador Data Resiliency Industry Volume (K Unit) Forecast, by Application 2019 & 2032
- Table 77: Venezuela Data Resiliency Industry Revenue (Million) Forecast, by Application 2019 & 2032
- Table 78: Venezuela Data Resiliency Industry Volume (K Unit) Forecast, by Application 2019 & 2032
- Table 79: Rest of South America Data Resiliency Industry Revenue (Million) Forecast, by Application 2019 & 2032
- Table 80: Rest of South America Data Resiliency Industry Volume (K Unit) Forecast, by Application 2019 & 2032
- Table 81: Global Data Resiliency Industry Revenue Million Forecast, by Country 2019 & 2032
- Table 82: Global Data Resiliency Industry Volume K Unit Forecast, by Country 2019 & 2032
- Table 83: United States Data Resiliency Industry Revenue (Million) Forecast, by Application 2019 & 2032
- Table 84: United States Data Resiliency Industry Volume (K Unit) Forecast, by Application 2019 & 2032
- Table 85: Canada Data Resiliency Industry Revenue (Million) Forecast, by Application 2019 & 2032
- Table 86: Canada Data Resiliency Industry Volume (K Unit) Forecast, by Application 2019 & 2032
- Table 87: Mexico Data Resiliency Industry Revenue (Million) Forecast, by Application 2019 & 2032
- Table 88: Mexico Data Resiliency Industry Volume (K Unit) Forecast, by Application 2019 & 2032
- Table 89: Global Data Resiliency Industry Revenue Million Forecast, by Country 2019 & 2032
- Table 90: Global Data Resiliency Industry Volume K Unit Forecast, by Country 2019 & 2032
- Table 91: United Arab Emirates Data Resiliency Industry Revenue (Million) Forecast, by Application 2019 & 2032
- Table 92: United Arab Emirates Data Resiliency Industry Volume (K Unit) Forecast, by Application 2019 & 2032
- Table 93: Saudi Arabia Data Resiliency Industry Revenue (Million) Forecast, by Application 2019 & 2032
- Table 94: Saudi Arabia Data Resiliency Industry Volume (K Unit) Forecast, by Application 2019 & 2032
- Table 95: South Africa Data Resiliency Industry Revenue (Million) Forecast, by Application 2019 & 2032
- Table 96: South Africa Data Resiliency Industry Volume (K Unit) Forecast, by Application 2019 & 2032
- Table 97: Rest of Middle East and Africa Data Resiliency Industry Revenue (Million) Forecast, by Application 2019 & 2032
- Table 98: Rest of Middle East and Africa Data Resiliency Industry Volume (K Unit) Forecast, by Application 2019 & 2032
- Table 99: Global Data Resiliency Industry Revenue Million Forecast, by Deployment 2019 & 2032
- Table 100: Global Data Resiliency Industry Volume K Unit Forecast, by Deployment 2019 & 2032
- Table 101: Global Data Resiliency Industry Revenue Million Forecast, by End-user Vertical 2019 & 2032
- Table 102: Global Data Resiliency Industry Volume K Unit Forecast, by End-user Vertical 2019 & 2032
- Table 103: Global Data Resiliency Industry Revenue Million Forecast, by Country 2019 & 2032
- Table 104: Global Data Resiliency Industry Volume K Unit Forecast, by Country 2019 & 2032
- Table 105: Global Data Resiliency Industry Revenue Million Forecast, by Deployment 2019 & 2032
- Table 106: Global Data Resiliency Industry Volume K Unit Forecast, by Deployment 2019 & 2032
- Table 107: Global Data Resiliency Industry Revenue Million Forecast, by End-user Vertical 2019 & 2032
- Table 108: Global Data Resiliency Industry Volume K Unit Forecast, by End-user Vertical 2019 & 2032
- Table 109: Global Data Resiliency Industry Revenue Million Forecast, by Country 2019 & 2032
- Table 110: Global Data Resiliency Industry Volume K Unit Forecast, by Country 2019 & 2032
- Table 111: Global Data Resiliency Industry Revenue Million Forecast, by Deployment 2019 & 2032
- Table 112: Global Data Resiliency Industry Volume K Unit Forecast, by Deployment 2019 & 2032
- Table 113: Global Data Resiliency Industry Revenue Million Forecast, by End-user Vertical 2019 & 2032
- Table 114: Global Data Resiliency Industry Volume K Unit Forecast, by End-user Vertical 2019 & 2032
- Table 115: Global Data Resiliency Industry Revenue Million Forecast, by Country 2019 & 2032
- Table 116: Global Data Resiliency Industry Volume K Unit Forecast, by Country 2019 & 2032
- Table 117: Global Data Resiliency Industry Revenue Million Forecast, by Deployment 2019 & 2032
- Table 118: Global Data Resiliency Industry Volume K Unit Forecast, by Deployment 2019 & 2032
- Table 119: Global Data Resiliency Industry Revenue Million Forecast, by End-user Vertical 2019 & 2032
- Table 120: Global Data Resiliency Industry Volume K Unit Forecast, by End-user Vertical 2019 & 2032
- Table 121: Global Data Resiliency Industry Revenue Million Forecast, by Country 2019 & 2032
- Table 122: Global Data Resiliency Industry Volume K Unit Forecast, by Country 2019 & 2032
- Table 123: Global Data Resiliency Industry Revenue Million Forecast, by Deployment 2019 & 2032
- Table 124: Global Data Resiliency Industry Volume K Unit Forecast, by Deployment 2019 & 2032
- Table 125: Global Data Resiliency Industry Revenue Million Forecast, by End-user Vertical 2019 & 2032
- Table 126: Global Data Resiliency Industry Volume K Unit Forecast, by End-user Vertical 2019 & 2032
- Table 127: Global Data Resiliency Industry Revenue Million Forecast, by Country 2019 & 2032
- Table 128: Global Data Resiliency Industry Volume K Unit Forecast, by Country 2019 & 2032
Frequently Asked Questions
1. What is the projected Compound Annual Growth Rate (CAGR) of the Data Resiliency Industry?
The projected CAGR is approximately 15.38%.
2. Which companies are prominent players in the Data Resiliency Industry?
Key companies in the market include IBM Corporation, Asigra Inc, CenturyLink Inc, VMware Inc (Dell Technologies Inc ), Veritas Technologies LLC, Microsoft Corporation, NetApp Inc, Carbonite Inc (OpenText Corporation), Acronis International GmbH, Micro Focus International plc, Commvault Systems Inc.
3. What are the main segments of the Data Resiliency Industry?
The market segments include Deployment, End-user Vertical.
4. Can you provide details about the market size?
The market size is estimated to be USD 18.65 Million as of 2022.
5. What are some drivers contributing to market growth?
; Rapid Growth in Data being Generated from Multiple Sources; Increasing Privacy Concerns and Rising Need for Data Security.
6. What are the notable trends driving market growth?
BFSI Segment is Expected to Witness Significant Growth.
7. Are there any restraints impacting market growth?
; Availability of open-source alternatives.
8. Can you provide examples of recent developments in the market?
N/A
9. What pricing options are available for accessing the report?
Pricing options include single-user, multi-user, and enterprise licenses priced at USD 4750, USD 5250, and USD 8750 respectively.
10. Is the market size provided in terms of value or volume?
The market size is provided in terms of value, measured in Million and volume, measured in K Unit.
11. Are there any specific market keywords associated with the report?
Yes, the market keyword associated with the report is "Data Resiliency Industry," which aids in identifying and referencing the specific market segment covered.
12. How do I determine which pricing option suits my needs best?
The pricing options vary based on user requirements and access needs. Individual users may opt for single-user licenses, while businesses requiring broader access may choose multi-user or enterprise licenses for cost-effective access to the report.
13. Are there any additional resources or data provided in the Data Resiliency Industry report?
While the report offers comprehensive insights, it's advisable to review the specific contents or supplementary materials provided to ascertain if additional resources or data are available.
14. How can I stay updated on further developments or reports in the Data Resiliency Industry?
To stay informed about further developments, trends, and reports in the Data Resiliency Industry, consider subscribing to industry newsletters, following relevant companies and organizations, or regularly checking reputable industry news sources and publications.
Methodology
Step 1 - Identification of Relevant Samples Size from Population Database


Step 2 - Approaches for Defining Global Market Size (Value, Volume* & Price*)

Note*: In applicable scenarios
Step 3 - Data Sources
Primary Research
- Web Analytics
- Survey Reports
- Research Institute
- Latest Research Reports
- Opinion Leaders
Secondary Research
- Annual Reports
- White Paper
- Latest Press Release
- Industry Association
- Paid Database
- Investor Presentations

Step 4 - Data Triangulation
Involves using different sources of information in order to increase the validity of a study
These sources are likely to be stakeholders in a program - participants, other researchers, program staff, other community members, and so on.
Then we put all data in single framework & apply various statistical tools to find out the dynamic on the market.
During the analysis stage, feedback from the stakeholder groups would be compared to determine areas of agreement as well as areas of divergence
