

Key Insights
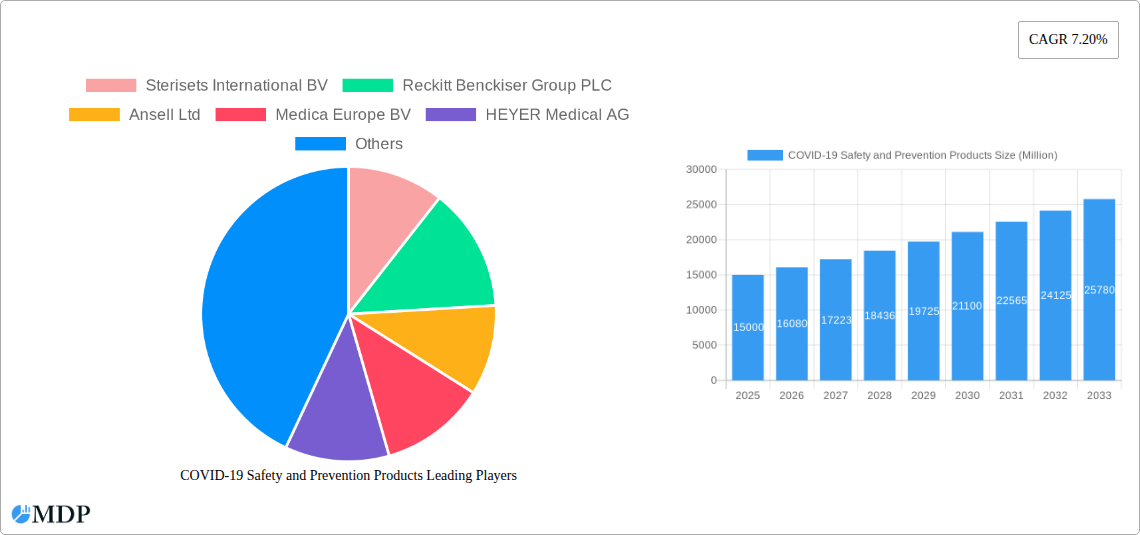
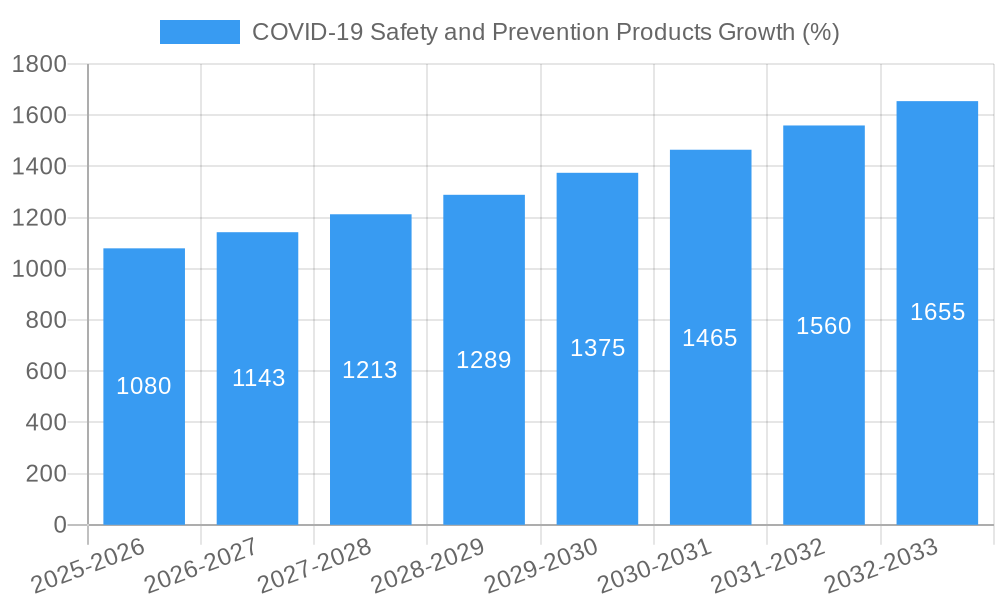
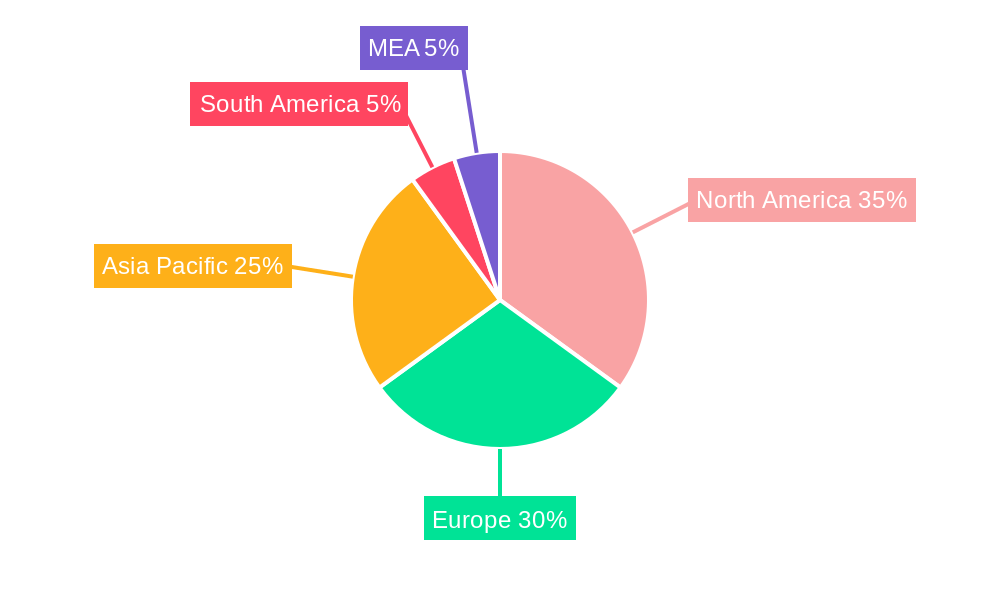
The global market for COVID-19 safety and prevention products experienced significant growth during the pandemic, driven by heightened public health concerns and government mandates. While the initial surge has subsided, the market maintains considerable size and is projected to continue expanding at a CAGR of 7.20% from 2025 to 2033. This sustained growth reflects ongoing demand for preventative measures, driven by evolving variants, seasonal influenza, and broader concerns about infectious disease outbreaks. Key product segments include face masks (surgical, N95 respirators, cloth masks), sanitizers (gels, sprays, wipes), gloves (nitrile, latex), and personal protective equipment (PPE) like gowns and eye protection. The market is highly fragmented, with a mix of large multinational corporations and smaller specialized manufacturers. Regional variations exist, with North America and Europe initially dominating the market due to higher initial infection rates and stringent regulations. However, Asia-Pacific is expected to see strong growth due to its large population and increasing awareness of hygiene practices. Competition is fierce, with companies focusing on product innovation, quality improvements, and efficient supply chains to maintain market share. Pricing pressures, fluctuating raw material costs, and potential regulatory changes remain as key challenges.
The diverse product portfolio within the COVID-19 safety and prevention market offers significant opportunities for innovation and diversification. Future growth is likely to be influenced by factors such as advancements in antiviral technologies integrated into PPE, the development of more sustainable and eco-friendly materials, and the integration of smart technologies for enhanced safety and tracking. The ongoing threat of pandemics and other infectious diseases will continue to fuel demand for these products, creating long-term market stability. Furthermore, the increased awareness of hygiene and infection control within healthcare and other sectors is expected to sustain demand beyond the immediate post-pandemic phase, ensuring continuous market expansion. Focus on effective marketing strategies highlighting product efficacy and safety is critical for manufacturers to thrive in this competitive landscape.
COVID-19 Safety and Prevention Products Market Report: 2019-2033
This comprehensive report provides an in-depth analysis of the COVID-19 Safety and Prevention Products market, projecting a market value of $XX Million by 2033. It covers market dynamics, industry trends, leading segments, product developments, key drivers and challenges, emerging opportunities, and leading players. The study period spans 2019-2033, with 2025 as the base and estimated year. This report is essential for industry stakeholders, investors, and researchers seeking a comprehensive understanding of this critical market.
COVID-19 Safety and Prevention Products Market Dynamics & Concentration
The COVID-19 pandemic dramatically reshaped the safety and prevention products market, leading to significant market expansion and heightened regulatory scrutiny. Market concentration is moderate, with several large multinational corporations holding substantial market share, alongside numerous smaller, specialized players. Innovation has been a key driver, with rapid advancements in areas like ventilator technology, rapid diagnostic tests, and PPE production. Stringent regulatory frameworks, varying by region, have shaped product development and market access. Product substitutes exist, particularly in the face mask and sanitizer categories, impacting pricing and market share. End-user trends reveal a growing awareness of hygiene and safety, fueling demand for higher-quality, more effective products. The period 2019-2024 witnessed a surge in M&A activity, as larger companies sought to expand their product portfolios and strengthen their market positions. Deal counts reached an estimated xx during this period. Market share data for key players are detailed within the full report.
- Key Players Market Share (Estimated 2025): 3M Company (xx%), Reckitt Benckiser Group PLC (xx%), Kimberly Clark Corporation (xx%), others (xx%).
- M&A Activity (2019-2024): xx deals, primarily focusing on consolidation and expansion into new product segments.
- Innovation Drivers: Technological advancements in materials science, sensor technology, and bioengineering.
- Regulatory Impact: Stringent regulatory approvals and certifications impacting market entry and product development.
COVID-19 Safety and Prevention Products Industry Trends & Analysis
The COVID-19 Safety and Prevention Products market experienced explosive growth following the pandemic's onset. The market is characterized by a high CAGR (Compound Annual Growth Rate) of xx% during the historical period (2019-2024) and is projected to maintain a significant CAGR of xx% during the forecast period (2025-2033), reaching $XX Million by 2033. Several factors contribute to this robust growth, including increased public awareness of hygiene and infection control, rising government spending on healthcare infrastructure, and continuous innovation in product design and manufacturing. The market penetration of advanced technologies like thermal imaging cameras and advanced respirators has significantly increased, particularly in healthcare settings. Competition is fierce, characterized by both price competition and innovation-led differentiation. Consumer preferences are shifting towards higher-quality, eco-friendly, and user-friendly products. Technological disruptions, like the integration of AI in diagnostic tools, are reshaping the market landscape.
Leading Markets & Segments in COVID-19 Safety and Prevention Products
The North American market holds a dominant position, followed by Europe and Asia-Pacific. Within segments, disposable protective masks and sanitizers witnessed the highest growth during the initial pandemic phase. However, the market is now witnessing a shift towards reusable and more sustainable options. Key regional differences exist in regulatory requirements and consumer preferences influencing the market share for different product categories and types.
- Dominant Region: North America
- Key Drivers (North America):
- Strong healthcare infrastructure.
- High adoption of advanced technologies.
- Stringent regulatory compliance.
- Key Drivers (Europe):
- Stringent European standards and regulations.
- Growing awareness of hygiene practices.
- Key Drivers (Asia-Pacific):
- Rapid urbanization and industrialization.
- Increased government investment in healthcare.
- Dominant Segment by Usage: Disposable
- Dominant Segment by Type: Surgical Masks
- Dominant Segment by Material Type: Nitrile Gloves
COVID-19 Safety and Prevention Products Product Developments
Significant innovations have emerged in various product categories. Advanced ventilator technology, including non-invasive options, has improved patient outcomes. New materials and designs for face masks enhance filtration efficiency and comfort. Sanitizers are now available in various forms, including eco-friendly options. The integration of smart technology, including sensors and AI, is enhancing the efficacy and usability of many products. This continuous innovation ensures optimal market fit and competitive advantage.
Key Drivers of COVID-19 Safety and Prevention Products Growth
Technological advancements are pivotal, driving the development of more effective and efficient products. Favorable government policies and increased healthcare spending significantly contribute to market expansion. Stringent regulations ensure product safety and efficacy, further driving market growth. For example, the increased demand for advanced respirators was directly driven by stringent workplace safety regulations.
Challenges in the COVID-19 Safety and Prevention Products Market
Regulatory hurdles for product approvals vary across regions and can hinder market entry. Supply chain disruptions, particularly in raw materials, can impact production and pricing. Intense competition from both established players and new entrants puts downward pressure on margins. The estimated total impact of supply chain disruptions on revenue during 2020-2021 was $XX Million.
Emerging Opportunities in COVID-19 Safety and Prevention Products
Technological breakthroughs, such as advanced sensor technology and AI-powered diagnostics, offer significant opportunities for innovation and market expansion. Strategic partnerships between technology companies and healthcare providers can drive the development and adoption of new solutions. Expanding into emerging markets with growing healthcare needs presents considerable potential for growth.
Leading Players in the COVID-19 Safety and Prevention Products Sector
- Sterisets International BV
- Reckitt Benckiser Group PLC
- Ansell Ltd
- Medica Europe BV
- HEYER Medical AG
- Guangzhou Pidegree Medical Technology Co Ltd
- Dynarex Corporation
- Koninklijke Philips N V
- Cardinal Health Inc
- DUPONT de Nemours Inc
- 3M Company
- Medtronic PLC
- A&D Company Limited
- Shandong Yuyuan Latex Gloves Co Ltd
- Shield Scientific
- Microgen Hygiene Pvt Ltd
- Procter & Gamble (P&G) Company
- ResMed Inc
- Smiths Medical Inc
- Kimberly Clark Corporation
Key Milestones in COVID-19 Safety and Prevention Products Industry
- 2020 Q1: Exponential increase in demand for PPE, leading to global shortages.
- 2020 Q2: Rapid expansion of PPE manufacturing capacity.
- 2020 Q3: Introduction of rapid diagnostic tests.
- 2021 Q1: Development of advanced ventilator technologies.
- 2021 Q4: Increased focus on reusable and sustainable PPE options.
- 2022 onwards: Continued innovation in materials, design and technology across all product categories.
Strategic Outlook for COVID-19 Safety and Prevention Products Market
The COVID-19 Safety and Prevention Products market is poised for sustained growth, driven by ongoing technological advancements, increased awareness of hygiene and safety, and a focus on preparedness for future health crises. Strategic opportunities lie in developing innovative products that address unmet needs, expanding into emerging markets, and forging strategic partnerships to enhance market reach and product development. The long-term market potential is significant, with a continued focus on prevention and preparedness likely to shape future demand.
COVID-19 Safety and Prevention Products Segmentation
-
1. Product/Equipment Type
-
1.1. Temperature Device
-
1.1.1. By Type
- 1.1.1.1. Infrared Thermometer
- 1.1.1.2. Thermal Imagers
-
1.1.1. By Type
-
1.2. Ventilators
- 1.2.1. Invasive/Mechanical Ventilators
- 1.2.2. Non-invasive Ventilators
- 1.3. Isolation Chambers
-
1.4. Protective Face Masks
- 1.4.1. Cloth Based Face Masks
- 1.4.2. Surgical Masks
-
1.4.3. Respirators
-
1.4.3.1. By Filter Standard
-
1.4.3.1.1. US Based Filter Class
- 1.4.3.1.1.1. N - Series
- 1.4.3.1.1.2. P - Series
- 1.4.3.1.1.3. R - Series
-
1.4.3.1.2. European Based Filter Class
- 1.4.3.1.2.1. FFP1
- 1.4.3.1.2.2. FFP2
- 1.4.3.1.2.3. FFP3
-
1.4.3.1.1. US Based Filter Class
-
1.4.3.1. By Filter Standard
-
1.5. Sanitizers
-
1.5.1. By Format
- 1.5.1.1. Gel
- 1.5.1.2. Foam
- 1.5.1.3. Liquid
- 1.5.1.4. Wipe
- 1.5.1.5. Spray
-
1.5.1. By Format
-
1.6. Gloves
-
1.6.1. By Material Type
- 1.6.1.1. Rubber
- 1.6.1.2. Poly(vinyl Chloride)
- 1.6.1.3. Poly Chloroprene
- 1.6.1.4. Nitrile
-
1.6.1. By Material Type
-
1.7. Medical Gowns (Coveralls)
-
1.7.1. By Usage
- 1.7.1.1. Disposable
- 1.7.1.2. Re-usable
-
1.7.1. By Usage
- 1.8. Others (
-
1.1. Temperature Device
COVID-19 Safety and Prevention Products Segmentation By Geography
- 1. North America
- 2. Europe
- 3. Asia Pacific
- 4. Rest of the World
COVID-19 Safety and Prevention Products REPORT HIGHLIGHTS
| Aspects | Details |
|---|---|
| Study Period | 2019-2033 |
| Base Year | 2024 |
| Estimated Year | 2025 |
| Forecast Period | 2025-2033 |
| Historical Period | 2019-2024 |
| Growth Rate | CAGR of 7.20% from 2019-2033 |
| Segmentation |
|
Table of Contents
- 1. Introduction
- 1.1. Research Scope
- 1.2. Market Segmentation
- 1.3. Research Methodology
- 1.4. Definitions and Assumptions
- 2. Executive Summary
- 2.1. Introduction
- 3. Market Dynamics
- 3.1. Introduction
- 3.2. Market Drivers
- 3.2.1. ; Rising EXIM of Medical Grade Supplies; Reduced Tariff on Protective Equipment
- 3.3. Market Restrains
- 3.3.1. ; Inadequate Supply of Safety Products Creating a Price Pressure
- 3.4. Market Trends
- 3.4.1. Ventilators to Record a Major Share of the Market Studied
- 4. Market Factor Analysis
- 4.1. Porters Five Forces
- 4.2. Supply/Value Chain
- 4.3. PESTEL analysis
- 4.4. Market Entropy
- 4.5. Patent/Trademark Analysis
- 5. Global COVID-19 Safety and Prevention Products Analysis, Insights and Forecast, 2019-2031
- 5.1. Market Analysis, Insights and Forecast - by Product/Equipment Type
- 5.1.1. Temperature Device
- 5.1.1.1. By Type
- 5.1.1.1.1. Infrared Thermometer
- 5.1.1.1.2. Thermal Imagers
- 5.1.1.1. By Type
- 5.1.2. Ventilators
- 5.1.2.1. Invasive/Mechanical Ventilators
- 5.1.2.2. Non-invasive Ventilators
- 5.1.3. Isolation Chambers
- 5.1.4. Protective Face Masks
- 5.1.4.1. Cloth Based Face Masks
- 5.1.4.2. Surgical Masks
- 5.1.4.3. Respirators
- 5.1.4.3.1. By Filter Standard
- 5.1.4.3.1.1. US Based Filter Class
- 5.1.4.3.1.1.1. N - Series
- 5.1.4.3.1.1.2. P - Series
- 5.1.4.3.1.1.3. R - Series
- 5.1.4.3.1.2. European Based Filter Class
- 5.1.4.3.1.2.1. FFP1
- 5.1.4.3.1.2.2. FFP2
- 5.1.4.3.1.2.3. FFP3
- 5.1.4.3.1.1. US Based Filter Class
- 5.1.4.3.1. By Filter Standard
- 5.1.5. Sanitizers
- 5.1.5.1. By Format
- 5.1.5.1.1. Gel
- 5.1.5.1.2. Foam
- 5.1.5.1.3. Liquid
- 5.1.5.1.4. Wipe
- 5.1.5.1.5. Spray
- 5.1.5.1. By Format
- 5.1.6. Gloves
- 5.1.6.1. By Material Type
- 5.1.6.1.1. Rubber
- 5.1.6.1.2. Poly(vinyl Chloride)
- 5.1.6.1.3. Poly Chloroprene
- 5.1.6.1.4. Nitrile
- 5.1.6.1. By Material Type
- 5.1.7. Medical Gowns (Coveralls)
- 5.1.7.1. By Usage
- 5.1.7.1.1. Disposable
- 5.1.7.1.2. Re-usable
- 5.1.7.1. By Usage
- 5.1.8. Others (
- 5.1.1. Temperature Device
- 5.2. Market Analysis, Insights and Forecast - by Region
- 5.2.1. North America
- 5.2.2. Europe
- 5.2.3. Asia Pacific
- 5.2.4. Rest of the World
- 5.1. Market Analysis, Insights and Forecast - by Product/Equipment Type
- 6. North America COVID-19 Safety and Prevention Products Analysis, Insights and Forecast, 2019-2031
- 6.1. Market Analysis, Insights and Forecast - by Product/Equipment Type
- 6.1.1. Temperature Device
- 6.1.1.1. By Type
- 6.1.1.1.1. Infrared Thermometer
- 6.1.1.1.2. Thermal Imagers
- 6.1.1.1. By Type
- 6.1.2. Ventilators
- 6.1.2.1. Invasive/Mechanical Ventilators
- 6.1.2.2. Non-invasive Ventilators
- 6.1.3. Isolation Chambers
- 6.1.4. Protective Face Masks
- 6.1.4.1. Cloth Based Face Masks
- 6.1.4.2. Surgical Masks
- 6.1.4.3. Respirators
- 6.1.4.3.1. By Filter Standard
- 6.1.4.3.1.1. US Based Filter Class
- 6.1.4.3.1.1.1. N - Series
- 6.1.4.3.1.1.2. P - Series
- 6.1.4.3.1.1.3. R - Series
- 6.1.4.3.1.2. European Based Filter Class
- 6.1.4.3.1.2.1. FFP1
- 6.1.4.3.1.2.2. FFP2
- 6.1.4.3.1.2.3. FFP3
- 6.1.4.3.1.1. US Based Filter Class
- 6.1.4.3.1. By Filter Standard
- 6.1.5. Sanitizers
- 6.1.5.1. By Format
- 6.1.5.1.1. Gel
- 6.1.5.1.2. Foam
- 6.1.5.1.3. Liquid
- 6.1.5.1.4. Wipe
- 6.1.5.1.5. Spray
- 6.1.5.1. By Format
- 6.1.6. Gloves
- 6.1.6.1. By Material Type
- 6.1.6.1.1. Rubber
- 6.1.6.1.2. Poly(vinyl Chloride)
- 6.1.6.1.3. Poly Chloroprene
- 6.1.6.1.4. Nitrile
- 6.1.6.1. By Material Type
- 6.1.7. Medical Gowns (Coveralls)
- 6.1.7.1. By Usage
- 6.1.7.1.1. Disposable
- 6.1.7.1.2. Re-usable
- 6.1.7.1. By Usage
- 6.1.8. Others (
- 6.1.1. Temperature Device
- 6.1. Market Analysis, Insights and Forecast - by Product/Equipment Type
- 7. Europe COVID-19 Safety and Prevention Products Analysis, Insights and Forecast, 2019-2031
- 7.1. Market Analysis, Insights and Forecast - by Product/Equipment Type
- 7.1.1. Temperature Device
- 7.1.1.1. By Type
- 7.1.1.1.1. Infrared Thermometer
- 7.1.1.1.2. Thermal Imagers
- 7.1.1.1. By Type
- 7.1.2. Ventilators
- 7.1.2.1. Invasive/Mechanical Ventilators
- 7.1.2.2. Non-invasive Ventilators
- 7.1.3. Isolation Chambers
- 7.1.4. Protective Face Masks
- 7.1.4.1. Cloth Based Face Masks
- 7.1.4.2. Surgical Masks
- 7.1.4.3. Respirators
- 7.1.4.3.1. By Filter Standard
- 7.1.4.3.1.1. US Based Filter Class
- 7.1.4.3.1.1.1. N - Series
- 7.1.4.3.1.1.2. P - Series
- 7.1.4.3.1.1.3. R - Series
- 7.1.4.3.1.2. European Based Filter Class
- 7.1.4.3.1.2.1. FFP1
- 7.1.4.3.1.2.2. FFP2
- 7.1.4.3.1.2.3. FFP3
- 7.1.4.3.1.1. US Based Filter Class
- 7.1.4.3.1. By Filter Standard
- 7.1.5. Sanitizers
- 7.1.5.1. By Format
- 7.1.5.1.1. Gel
- 7.1.5.1.2. Foam
- 7.1.5.1.3. Liquid
- 7.1.5.1.4. Wipe
- 7.1.5.1.5. Spray
- 7.1.5.1. By Format
- 7.1.6. Gloves
- 7.1.6.1. By Material Type
- 7.1.6.1.1. Rubber
- 7.1.6.1.2. Poly(vinyl Chloride)
- 7.1.6.1.3. Poly Chloroprene
- 7.1.6.1.4. Nitrile
- 7.1.6.1. By Material Type
- 7.1.7. Medical Gowns (Coveralls)
- 7.1.7.1. By Usage
- 7.1.7.1.1. Disposable
- 7.1.7.1.2. Re-usable
- 7.1.7.1. By Usage
- 7.1.8. Others (
- 7.1.1. Temperature Device
- 7.1. Market Analysis, Insights and Forecast - by Product/Equipment Type
- 8. Asia Pacific COVID-19 Safety and Prevention Products Analysis, Insights and Forecast, 2019-2031
- 8.1. Market Analysis, Insights and Forecast - by Product/Equipment Type
- 8.1.1. Temperature Device
- 8.1.1.1. By Type
- 8.1.1.1.1. Infrared Thermometer
- 8.1.1.1.2. Thermal Imagers
- 8.1.1.1. By Type
- 8.1.2. Ventilators
- 8.1.2.1. Invasive/Mechanical Ventilators
- 8.1.2.2. Non-invasive Ventilators
- 8.1.3. Isolation Chambers
- 8.1.4. Protective Face Masks
- 8.1.4.1. Cloth Based Face Masks
- 8.1.4.2. Surgical Masks
- 8.1.4.3. Respirators
- 8.1.4.3.1. By Filter Standard
- 8.1.4.3.1.1. US Based Filter Class
- 8.1.4.3.1.1.1. N - Series
- 8.1.4.3.1.1.2. P - Series
- 8.1.4.3.1.1.3. R - Series
- 8.1.4.3.1.2. European Based Filter Class
- 8.1.4.3.1.2.1. FFP1
- 8.1.4.3.1.2.2. FFP2
- 8.1.4.3.1.2.3. FFP3
- 8.1.4.3.1.1. US Based Filter Class
- 8.1.4.3.1. By Filter Standard
- 8.1.5. Sanitizers
- 8.1.5.1. By Format
- 8.1.5.1.1. Gel
- 8.1.5.1.2. Foam
- 8.1.5.1.3. Liquid
- 8.1.5.1.4. Wipe
- 8.1.5.1.5. Spray
- 8.1.5.1. By Format
- 8.1.6. Gloves
- 8.1.6.1. By Material Type
- 8.1.6.1.1. Rubber
- 8.1.6.1.2. Poly(vinyl Chloride)
- 8.1.6.1.3. Poly Chloroprene
- 8.1.6.1.4. Nitrile
- 8.1.6.1. By Material Type
- 8.1.7. Medical Gowns (Coveralls)
- 8.1.7.1. By Usage
- 8.1.7.1.1. Disposable
- 8.1.7.1.2. Re-usable
- 8.1.7.1. By Usage
- 8.1.8. Others (
- 8.1.1. Temperature Device
- 8.1. Market Analysis, Insights and Forecast - by Product/Equipment Type
- 9. Rest of the World COVID-19 Safety and Prevention Products Analysis, Insights and Forecast, 2019-2031
- 9.1. Market Analysis, Insights and Forecast - by Product/Equipment Type
- 9.1.1. Temperature Device
- 9.1.1.1. By Type
- 9.1.1.1.1. Infrared Thermometer
- 9.1.1.1.2. Thermal Imagers
- 9.1.1.1. By Type
- 9.1.2. Ventilators
- 9.1.2.1. Invasive/Mechanical Ventilators
- 9.1.2.2. Non-invasive Ventilators
- 9.1.3. Isolation Chambers
- 9.1.4. Protective Face Masks
- 9.1.4.1. Cloth Based Face Masks
- 9.1.4.2. Surgical Masks
- 9.1.4.3. Respirators
- 9.1.4.3.1. By Filter Standard
- 9.1.4.3.1.1. US Based Filter Class
- 9.1.4.3.1.1.1. N - Series
- 9.1.4.3.1.1.2. P - Series
- 9.1.4.3.1.1.3. R - Series
- 9.1.4.3.1.2. European Based Filter Class
- 9.1.4.3.1.2.1. FFP1
- 9.1.4.3.1.2.2. FFP2
- 9.1.4.3.1.2.3. FFP3
- 9.1.4.3.1.1. US Based Filter Class
- 9.1.4.3.1. By Filter Standard
- 9.1.5. Sanitizers
- 9.1.5.1. By Format
- 9.1.5.1.1. Gel
- 9.1.5.1.2. Foam
- 9.1.5.1.3. Liquid
- 9.1.5.1.4. Wipe
- 9.1.5.1.5. Spray
- 9.1.5.1. By Format
- 9.1.6. Gloves
- 9.1.6.1. By Material Type
- 9.1.6.1.1. Rubber
- 9.1.6.1.2. Poly(vinyl Chloride)
- 9.1.6.1.3. Poly Chloroprene
- 9.1.6.1.4. Nitrile
- 9.1.6.1. By Material Type
- 9.1.7. Medical Gowns (Coveralls)
- 9.1.7.1. By Usage
- 9.1.7.1.1. Disposable
- 9.1.7.1.2. Re-usable
- 9.1.7.1. By Usage
- 9.1.8. Others (
- 9.1.1. Temperature Device
- 9.1. Market Analysis, Insights and Forecast - by Product/Equipment Type
- 10. North America COVID-19 Safety and Prevention Products Analysis, Insights and Forecast, 2019-2031
- 10.1. Market Analysis, Insights and Forecast - By Country/Sub-region
- 10.1.1 United States
- 10.1.2 Canada
- 10.1.3 Mexico
- 11. Europe COVID-19 Safety and Prevention Products Analysis, Insights and Forecast, 2019-2031
- 11.1. Market Analysis, Insights and Forecast - By Country/Sub-region
- 11.1.1 Germany
- 11.1.2 United Kingdom
- 11.1.3 France
- 11.1.4 Spain
- 11.1.5 Italy
- 11.1.6 Spain
- 11.1.7 Belgium
- 11.1.8 Netherland
- 11.1.9 Nordics
- 11.1.10 Rest of Europe
- 12. Asia Pacific COVID-19 Safety and Prevention Products Analysis, Insights and Forecast, 2019-2031
- 12.1. Market Analysis, Insights and Forecast - By Country/Sub-region
- 12.1.1 China
- 12.1.2 Japan
- 12.1.3 India
- 12.1.4 South Korea
- 12.1.5 Southeast Asia
- 12.1.6 Australia
- 12.1.7 Indonesia
- 12.1.8 Phillipes
- 12.1.9 Singapore
- 12.1.10 Thailandc
- 12.1.11 Rest of Asia Pacific
- 13. South America COVID-19 Safety and Prevention Products Analysis, Insights and Forecast, 2019-2031
- 13.1. Market Analysis, Insights and Forecast - By Country/Sub-region
- 13.1.1 Brazil
- 13.1.2 Argentina
- 13.1.3 Peru
- 13.1.4 Chile
- 13.1.5 Colombia
- 13.1.6 Ecuador
- 13.1.7 Venezuela
- 13.1.8 Rest of South America
- 14. North America COVID-19 Safety and Prevention Products Analysis, Insights and Forecast, 2019-2031
- 14.1. Market Analysis, Insights and Forecast - By Country/Sub-region
- 14.1.1 United States
- 14.1.2 Canada
- 14.1.3 Mexico
- 15. MEA COVID-19 Safety and Prevention Products Analysis, Insights and Forecast, 2019-2031
- 15.1. Market Analysis, Insights and Forecast - By Country/Sub-region
- 15.1.1 United Arab Emirates
- 15.1.2 Saudi Arabia
- 15.1.3 South Africa
- 15.1.4 Rest of Middle East and Africa
- 16. Competitive Analysis
- 16.1. Global Market Share Analysis 2024
- 16.2. Company Profiles
- 16.2.1 Sterisets International BV
- 16.2.1.1. Overview
- 16.2.1.2. Products
- 16.2.1.3. SWOT Analysis
- 16.2.1.4. Recent Developments
- 16.2.1.5. Financials (Based on Availability)
- 16.2.2 Reckitt Benckiser Group PLC
- 16.2.2.1. Overview
- 16.2.2.2. Products
- 16.2.2.3. SWOT Analysis
- 16.2.2.4. Recent Developments
- 16.2.2.5. Financials (Based on Availability)
- 16.2.3 Ansell Ltd
- 16.2.3.1. Overview
- 16.2.3.2. Products
- 16.2.3.3. SWOT Analysis
- 16.2.3.4. Recent Developments
- 16.2.3.5. Financials (Based on Availability)
- 16.2.4 Medica Europe BV
- 16.2.4.1. Overview
- 16.2.4.2. Products
- 16.2.4.3. SWOT Analysis
- 16.2.4.4. Recent Developments
- 16.2.4.5. Financials (Based on Availability)
- 16.2.5 HEYER Medical AG
- 16.2.5.1. Overview
- 16.2.5.2. Products
- 16.2.5.3. SWOT Analysis
- 16.2.5.4. Recent Developments
- 16.2.5.5. Financials (Based on Availability)
- 16.2.6 Guangzhou Pidegree Medical Technology Co Ltd
- 16.2.6.1. Overview
- 16.2.6.2. Products
- 16.2.6.3. SWOT Analysis
- 16.2.6.4. Recent Developments
- 16.2.6.5. Financials (Based on Availability)
- 16.2.7 Dynarex Corporation
- 16.2.7.1. Overview
- 16.2.7.2. Products
- 16.2.7.3. SWOT Analysis
- 16.2.7.4. Recent Developments
- 16.2.7.5. Financials (Based on Availability)
- 16.2.8 Koninklijke Philips N V
- 16.2.8.1. Overview
- 16.2.8.2. Products
- 16.2.8.3. SWOT Analysis
- 16.2.8.4. Recent Developments
- 16.2.8.5. Financials (Based on Availability)
- 16.2.9 Cardinal Health Inc
- 16.2.9.1. Overview
- 16.2.9.2. Products
- 16.2.9.3. SWOT Analysis
- 16.2.9.4. Recent Developments
- 16.2.9.5. Financials (Based on Availability)
- 16.2.10 DUPONT de Nemours Inc
- 16.2.10.1. Overview
- 16.2.10.2. Products
- 16.2.10.3. SWOT Analysis
- 16.2.10.4. Recent Developments
- 16.2.10.5. Financials (Based on Availability)
- 16.2.11 3M Company
- 16.2.11.1. Overview
- 16.2.11.2. Products
- 16.2.11.3. SWOT Analysis
- 16.2.11.4. Recent Developments
- 16.2.11.5. Financials (Based on Availability)
- 16.2.12 Medtronic PLC
- 16.2.12.1. Overview
- 16.2.12.2. Products
- 16.2.12.3. SWOT Analysis
- 16.2.12.4. Recent Developments
- 16.2.12.5. Financials (Based on Availability)
- 16.2.13 A&D Company Limited*List Not Exhaustive
- 16.2.13.1. Overview
- 16.2.13.2. Products
- 16.2.13.3. SWOT Analysis
- 16.2.13.4. Recent Developments
- 16.2.13.5. Financials (Based on Availability)
- 16.2.14 Shandong Yuyuan Latex Gloves Co Ltd
- 16.2.14.1. Overview
- 16.2.14.2. Products
- 16.2.14.3. SWOT Analysis
- 16.2.14.4. Recent Developments
- 16.2.14.5. Financials (Based on Availability)
- 16.2.15 Shield Scientific
- 16.2.15.1. Overview
- 16.2.15.2. Products
- 16.2.15.3. SWOT Analysis
- 16.2.15.4. Recent Developments
- 16.2.15.5. Financials (Based on Availability)
- 16.2.16 Microgen Hygiene Pvt Ltd
- 16.2.16.1. Overview
- 16.2.16.2. Products
- 16.2.16.3. SWOT Analysis
- 16.2.16.4. Recent Developments
- 16.2.16.5. Financials (Based on Availability)
- 16.2.17 Procter & Gamble (P&G) Company
- 16.2.17.1. Overview
- 16.2.17.2. Products
- 16.2.17.3. SWOT Analysis
- 16.2.17.4. Recent Developments
- 16.2.17.5. Financials (Based on Availability)
- 16.2.18 ResMed Inc
- 16.2.18.1. Overview
- 16.2.18.2. Products
- 16.2.18.3. SWOT Analysis
- 16.2.18.4. Recent Developments
- 16.2.18.5. Financials (Based on Availability)
- 16.2.19 Smiths Medical Inc
- 16.2.19.1. Overview
- 16.2.19.2. Products
- 16.2.19.3. SWOT Analysis
- 16.2.19.4. Recent Developments
- 16.2.19.5. Financials (Based on Availability)
- 16.2.20 Kimberly Clark Corporation
- 16.2.20.1. Overview
- 16.2.20.2. Products
- 16.2.20.3. SWOT Analysis
- 16.2.20.4. Recent Developments
- 16.2.20.5. Financials (Based on Availability)
- 16.2.1 Sterisets International BV
List of Figures
- Figure 1: Global COVID-19 Safety and Prevention Products Revenue Breakdown (Million, %) by Region 2024 & 2032
- Figure 2: North America COVID-19 Safety and Prevention Products Revenue (Million), by Country 2024 & 2032
- Figure 3: North America COVID-19 Safety and Prevention Products Revenue Share (%), by Country 2024 & 2032
- Figure 4: Europe COVID-19 Safety and Prevention Products Revenue (Million), by Country 2024 & 2032
- Figure 5: Europe COVID-19 Safety and Prevention Products Revenue Share (%), by Country 2024 & 2032
- Figure 6: Asia Pacific COVID-19 Safety and Prevention Products Revenue (Million), by Country 2024 & 2032
- Figure 7: Asia Pacific COVID-19 Safety and Prevention Products Revenue Share (%), by Country 2024 & 2032
- Figure 8: South America COVID-19 Safety and Prevention Products Revenue (Million), by Country 2024 & 2032
- Figure 9: South America COVID-19 Safety and Prevention Products Revenue Share (%), by Country 2024 & 2032
- Figure 10: North America COVID-19 Safety and Prevention Products Revenue (Million), by Country 2024 & 2032
- Figure 11: North America COVID-19 Safety and Prevention Products Revenue Share (%), by Country 2024 & 2032
- Figure 12: MEA COVID-19 Safety and Prevention Products Revenue (Million), by Country 2024 & 2032
- Figure 13: MEA COVID-19 Safety and Prevention Products Revenue Share (%), by Country 2024 & 2032
- Figure 14: North America COVID-19 Safety and Prevention Products Revenue (Million), by Product/Equipment Type 2024 & 2032
- Figure 15: North America COVID-19 Safety and Prevention Products Revenue Share (%), by Product/Equipment Type 2024 & 2032
- Figure 16: North America COVID-19 Safety and Prevention Products Revenue (Million), by Country 2024 & 2032
- Figure 17: North America COVID-19 Safety and Prevention Products Revenue Share (%), by Country 2024 & 2032
- Figure 18: Europe COVID-19 Safety and Prevention Products Revenue (Million), by Product/Equipment Type 2024 & 2032
- Figure 19: Europe COVID-19 Safety and Prevention Products Revenue Share (%), by Product/Equipment Type 2024 & 2032
- Figure 20: Europe COVID-19 Safety and Prevention Products Revenue (Million), by Country 2024 & 2032
- Figure 21: Europe COVID-19 Safety and Prevention Products Revenue Share (%), by Country 2024 & 2032
- Figure 22: Asia Pacific COVID-19 Safety and Prevention Products Revenue (Million), by Product/Equipment Type 2024 & 2032
- Figure 23: Asia Pacific COVID-19 Safety and Prevention Products Revenue Share (%), by Product/Equipment Type 2024 & 2032
- Figure 24: Asia Pacific COVID-19 Safety and Prevention Products Revenue (Million), by Country 2024 & 2032
- Figure 25: Asia Pacific COVID-19 Safety and Prevention Products Revenue Share (%), by Country 2024 & 2032
- Figure 26: Rest of the World COVID-19 Safety and Prevention Products Revenue (Million), by Product/Equipment Type 2024 & 2032
- Figure 27: Rest of the World COVID-19 Safety and Prevention Products Revenue Share (%), by Product/Equipment Type 2024 & 2032
- Figure 28: Rest of the World COVID-19 Safety and Prevention Products Revenue (Million), by Country 2024 & 2032
- Figure 29: Rest of the World COVID-19 Safety and Prevention Products Revenue Share (%), by Country 2024 & 2032
List of Tables
- Table 1: Global COVID-19 Safety and Prevention Products Revenue Million Forecast, by Region 2019 & 2032
- Table 2: Global COVID-19 Safety and Prevention Products Revenue Million Forecast, by Product/Equipment Type 2019 & 2032
- Table 3: Global COVID-19 Safety and Prevention Products Revenue Million Forecast, by Region 2019 & 2032
- Table 4: Global COVID-19 Safety and Prevention Products Revenue Million Forecast, by Country 2019 & 2032
- Table 5: United States COVID-19 Safety and Prevention Products Revenue (Million) Forecast, by Application 2019 & 2032
- Table 6: Canada COVID-19 Safety and Prevention Products Revenue (Million) Forecast, by Application 2019 & 2032
- Table 7: Mexico COVID-19 Safety and Prevention Products Revenue (Million) Forecast, by Application 2019 & 2032
- Table 8: Global COVID-19 Safety and Prevention Products Revenue Million Forecast, by Country 2019 & 2032
- Table 9: Germany COVID-19 Safety and Prevention Products Revenue (Million) Forecast, by Application 2019 & 2032
- Table 10: United Kingdom COVID-19 Safety and Prevention Products Revenue (Million) Forecast, by Application 2019 & 2032
- Table 11: France COVID-19 Safety and Prevention Products Revenue (Million) Forecast, by Application 2019 & 2032
- Table 12: Spain COVID-19 Safety and Prevention Products Revenue (Million) Forecast, by Application 2019 & 2032
- Table 13: Italy COVID-19 Safety and Prevention Products Revenue (Million) Forecast, by Application 2019 & 2032
- Table 14: Spain COVID-19 Safety and Prevention Products Revenue (Million) Forecast, by Application 2019 & 2032
- Table 15: Belgium COVID-19 Safety and Prevention Products Revenue (Million) Forecast, by Application 2019 & 2032
- Table 16: Netherland COVID-19 Safety and Prevention Products Revenue (Million) Forecast, by Application 2019 & 2032
- Table 17: Nordics COVID-19 Safety and Prevention Products Revenue (Million) Forecast, by Application 2019 & 2032
- Table 18: Rest of Europe COVID-19 Safety and Prevention Products Revenue (Million) Forecast, by Application 2019 & 2032
- Table 19: Global COVID-19 Safety and Prevention Products Revenue Million Forecast, by Country 2019 & 2032
- Table 20: China COVID-19 Safety and Prevention Products Revenue (Million) Forecast, by Application 2019 & 2032
- Table 21: Japan COVID-19 Safety and Prevention Products Revenue (Million) Forecast, by Application 2019 & 2032
- Table 22: India COVID-19 Safety and Prevention Products Revenue (Million) Forecast, by Application 2019 & 2032
- Table 23: South Korea COVID-19 Safety and Prevention Products Revenue (Million) Forecast, by Application 2019 & 2032
- Table 24: Southeast Asia COVID-19 Safety and Prevention Products Revenue (Million) Forecast, by Application 2019 & 2032
- Table 25: Australia COVID-19 Safety and Prevention Products Revenue (Million) Forecast, by Application 2019 & 2032
- Table 26: Indonesia COVID-19 Safety and Prevention Products Revenue (Million) Forecast, by Application 2019 & 2032
- Table 27: Phillipes COVID-19 Safety and Prevention Products Revenue (Million) Forecast, by Application 2019 & 2032
- Table 28: Singapore COVID-19 Safety and Prevention Products Revenue (Million) Forecast, by Application 2019 & 2032
- Table 29: Thailandc COVID-19 Safety and Prevention Products Revenue (Million) Forecast, by Application 2019 & 2032
- Table 30: Rest of Asia Pacific COVID-19 Safety and Prevention Products Revenue (Million) Forecast, by Application 2019 & 2032
- Table 31: Global COVID-19 Safety and Prevention Products Revenue Million Forecast, by Country 2019 & 2032
- Table 32: Brazil COVID-19 Safety and Prevention Products Revenue (Million) Forecast, by Application 2019 & 2032
- Table 33: Argentina COVID-19 Safety and Prevention Products Revenue (Million) Forecast, by Application 2019 & 2032
- Table 34: Peru COVID-19 Safety and Prevention Products Revenue (Million) Forecast, by Application 2019 & 2032
- Table 35: Chile COVID-19 Safety and Prevention Products Revenue (Million) Forecast, by Application 2019 & 2032
- Table 36: Colombia COVID-19 Safety and Prevention Products Revenue (Million) Forecast, by Application 2019 & 2032
- Table 37: Ecuador COVID-19 Safety and Prevention Products Revenue (Million) Forecast, by Application 2019 & 2032
- Table 38: Venezuela COVID-19 Safety and Prevention Products Revenue (Million) Forecast, by Application 2019 & 2032
- Table 39: Rest of South America COVID-19 Safety and Prevention Products Revenue (Million) Forecast, by Application 2019 & 2032
- Table 40: Global COVID-19 Safety and Prevention Products Revenue Million Forecast, by Country 2019 & 2032
- Table 41: United States COVID-19 Safety and Prevention Products Revenue (Million) Forecast, by Application 2019 & 2032
- Table 42: Canada COVID-19 Safety and Prevention Products Revenue (Million) Forecast, by Application 2019 & 2032
- Table 43: Mexico COVID-19 Safety and Prevention Products Revenue (Million) Forecast, by Application 2019 & 2032
- Table 44: Global COVID-19 Safety and Prevention Products Revenue Million Forecast, by Country 2019 & 2032
- Table 45: United Arab Emirates COVID-19 Safety and Prevention Products Revenue (Million) Forecast, by Application 2019 & 2032
- Table 46: Saudi Arabia COVID-19 Safety and Prevention Products Revenue (Million) Forecast, by Application 2019 & 2032
- Table 47: South Africa COVID-19 Safety and Prevention Products Revenue (Million) Forecast, by Application 2019 & 2032
- Table 48: Rest of Middle East and Africa COVID-19 Safety and Prevention Products Revenue (Million) Forecast, by Application 2019 & 2032
- Table 49: Global COVID-19 Safety and Prevention Products Revenue Million Forecast, by Product/Equipment Type 2019 & 2032
- Table 50: Global COVID-19 Safety and Prevention Products Revenue Million Forecast, by Country 2019 & 2032
- Table 51: Global COVID-19 Safety and Prevention Products Revenue Million Forecast, by Product/Equipment Type 2019 & 2032
- Table 52: Global COVID-19 Safety and Prevention Products Revenue Million Forecast, by Country 2019 & 2032
- Table 53: Global COVID-19 Safety and Prevention Products Revenue Million Forecast, by Product/Equipment Type 2019 & 2032
- Table 54: Global COVID-19 Safety and Prevention Products Revenue Million Forecast, by Country 2019 & 2032
- Table 55: Global COVID-19 Safety and Prevention Products Revenue Million Forecast, by Product/Equipment Type 2019 & 2032
- Table 56: Global COVID-19 Safety and Prevention Products Revenue Million Forecast, by Country 2019 & 2032
Frequently Asked Questions
1. What is the projected Compound Annual Growth Rate (CAGR) of the COVID-19 Safety and Prevention Products?
The projected CAGR is approximately 7.20%.
2. Which companies are prominent players in the COVID-19 Safety and Prevention Products?
Key companies in the market include Sterisets International BV, Reckitt Benckiser Group PLC, Ansell Ltd, Medica Europe BV, HEYER Medical AG, Guangzhou Pidegree Medical Technology Co Ltd, Dynarex Corporation, Koninklijke Philips N V, Cardinal Health Inc, DUPONT de Nemours Inc, 3M Company, Medtronic PLC, A&D Company Limited*List Not Exhaustive, Shandong Yuyuan Latex Gloves Co Ltd, Shield Scientific, Microgen Hygiene Pvt Ltd, Procter & Gamble (P&G) Company, ResMed Inc, Smiths Medical Inc, Kimberly Clark Corporation.
3. What are the main segments of the COVID-19 Safety and Prevention Products?
The market segments include Product/Equipment Type.
4. Can you provide details about the market size?
The market size is estimated to be USD XX Million as of 2022.
5. What are some drivers contributing to market growth?
; Rising EXIM of Medical Grade Supplies; Reduced Tariff on Protective Equipment.
6. What are the notable trends driving market growth?
Ventilators to Record a Major Share of the Market Studied.
7. Are there any restraints impacting market growth?
; Inadequate Supply of Safety Products Creating a Price Pressure.
8. Can you provide examples of recent developments in the market?
N/A
9. What pricing options are available for accessing the report?
Pricing options include single-user, multi-user, and enterprise licenses priced at USD 4750, USD 5250, and USD 8750 respectively.
10. Is the market size provided in terms of value or volume?
The market size is provided in terms of value, measured in Million.
11. Are there any specific market keywords associated with the report?
Yes, the market keyword associated with the report is "COVID-19 Safety and Prevention Products," which aids in identifying and referencing the specific market segment covered.
12. How do I determine which pricing option suits my needs best?
The pricing options vary based on user requirements and access needs. Individual users may opt for single-user licenses, while businesses requiring broader access may choose multi-user or enterprise licenses for cost-effective access to the report.
13. Are there any additional resources or data provided in the COVID-19 Safety and Prevention Products report?
While the report offers comprehensive insights, it's advisable to review the specific contents or supplementary materials provided to ascertain if additional resources or data are available.
14. How can I stay updated on further developments or reports in the COVID-19 Safety and Prevention Products?
To stay informed about further developments, trends, and reports in the COVID-19 Safety and Prevention Products, consider subscribing to industry newsletters, following relevant companies and organizations, or regularly checking reputable industry news sources and publications.
Methodology
Step 1 - Identification of Relevant Samples Size from Population Database


Step 2 - Approaches for Defining Global Market Size (Value, Volume* & Price*)

Note*: In applicable scenarios
Step 3 - Data Sources
Primary Research
- Web Analytics
- Survey Reports
- Research Institute
- Latest Research Reports
- Opinion Leaders
Secondary Research
- Annual Reports
- White Paper
- Latest Press Release
- Industry Association
- Paid Database
- Investor Presentations

Step 4 - Data Triangulation
Involves using different sources of information in order to increase the validity of a study
These sources are likely to be stakeholders in a program - participants, other researchers, program staff, other community members, and so on.
Then we put all data in single framework & apply various statistical tools to find out the dynamic on the market.
During the analysis stage, feedback from the stakeholder groups would be compared to determine areas of agreement as well as areas of divergence
