

Key Insights
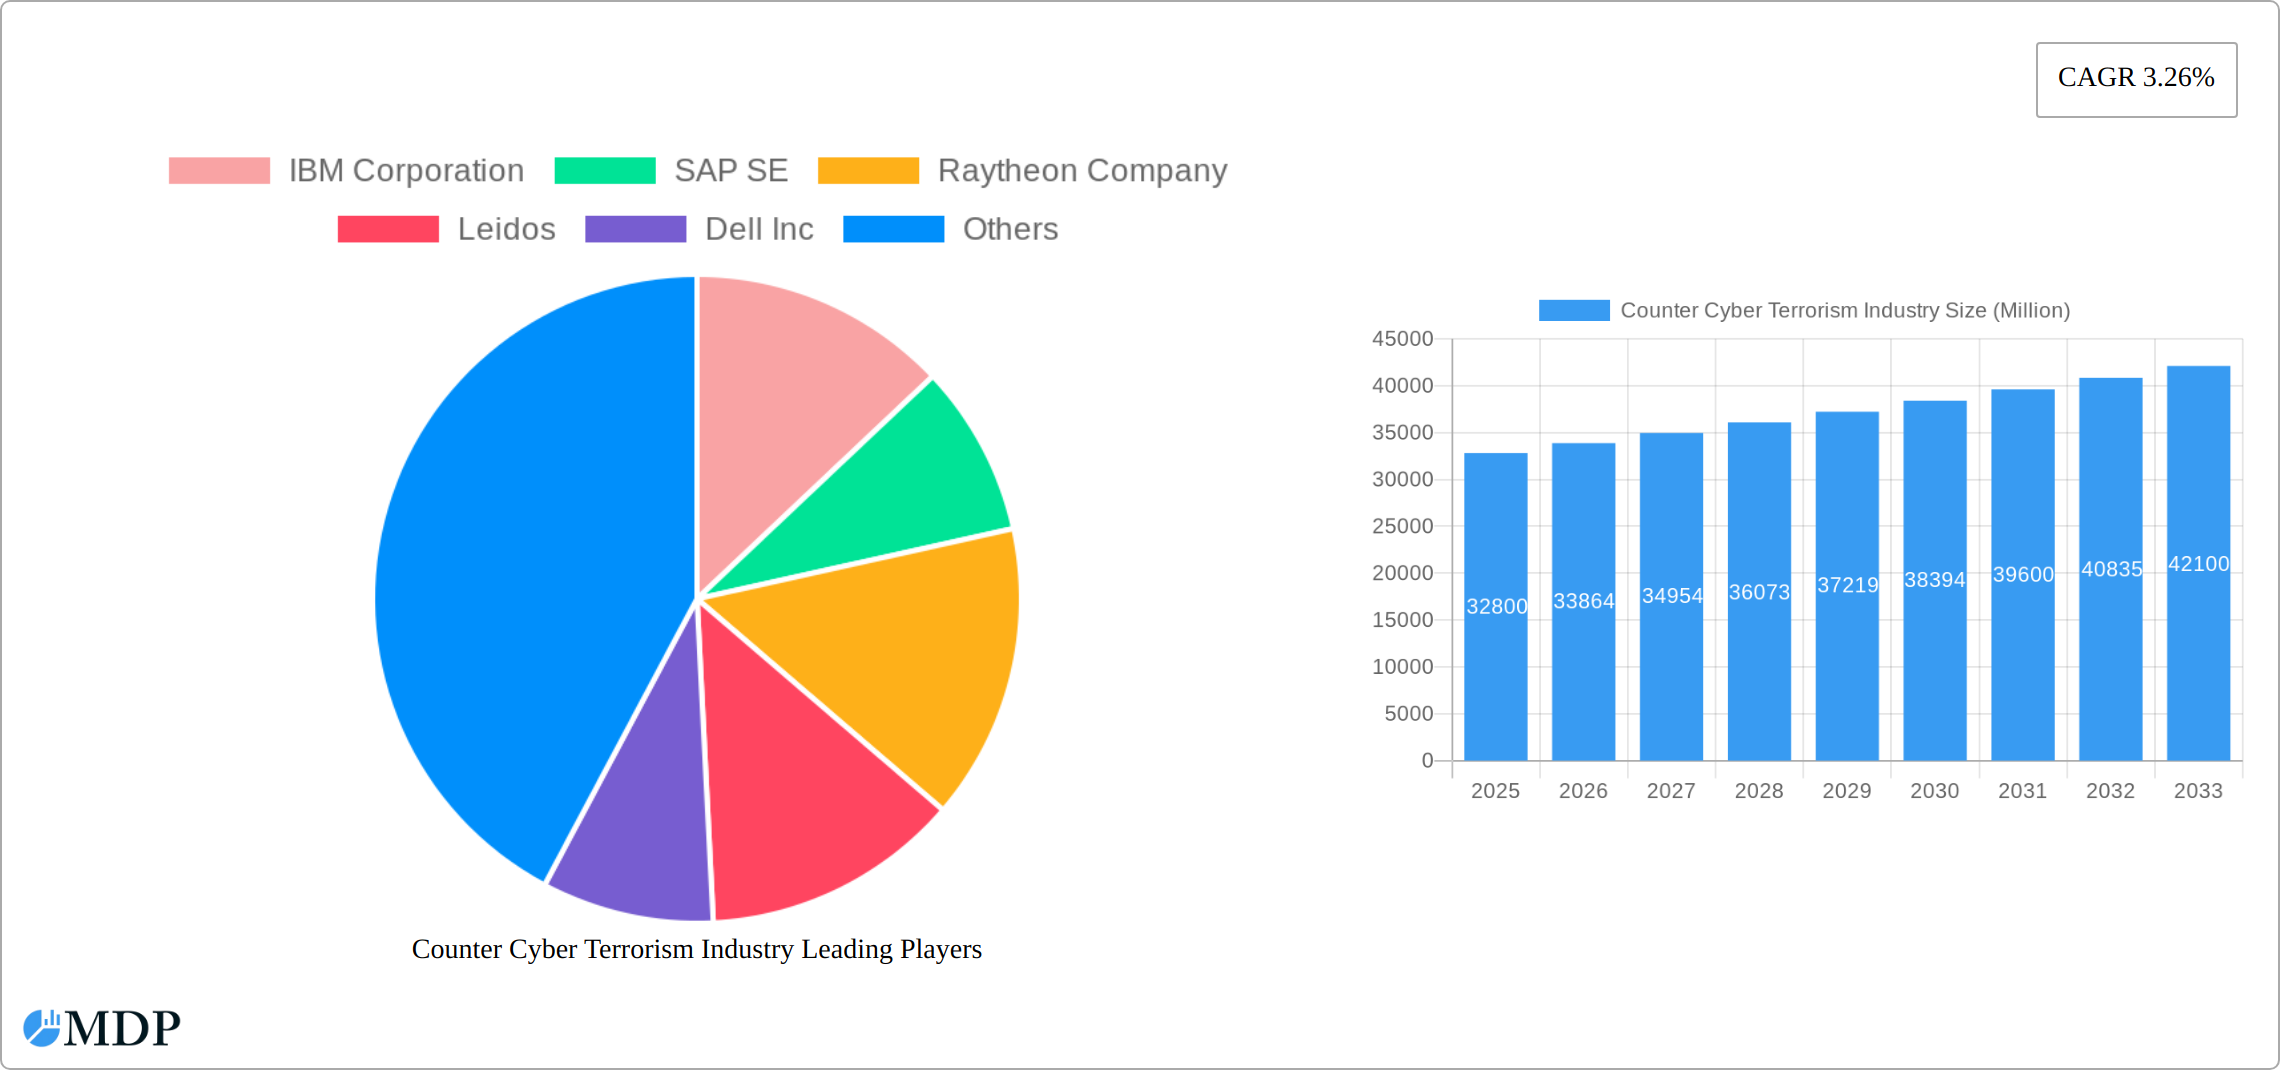
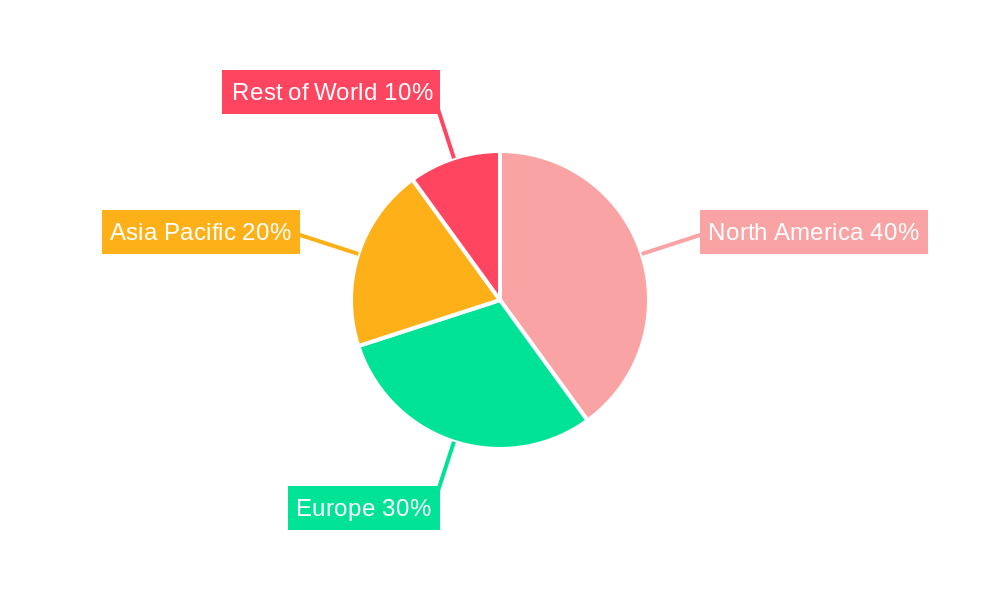
The global counter cyber terrorism market, valued at $32.80 billion in 2025, is projected to experience steady growth, driven by escalating cyber threats targeting critical infrastructure and government entities. The increasing sophistication of cyberattacks, coupled with the rising interconnectedness of global systems, fuels the demand for robust countermeasures. Key drivers include the growing need for advanced threat detection and response capabilities, stringent government regulations regarding cybersecurity, and a rising awareness among businesses about the financial and reputational risks associated with cyber terrorism. The market's growth is further fueled by technological advancements in artificial intelligence (AI), machine learning (ML), and blockchain technology, which enhance the effectiveness of cybersecurity solutions. While the market faces certain restraints like high implementation costs and the scarcity of skilled cybersecurity professionals, the overall trajectory points towards significant expansion. The segmentation by end-user industry reveals strong demand from defense, aerospace, BFSI (Banking, Financial Services, and Insurance), and government sectors, reflecting the critical nature of protecting sensitive data and infrastructure in these areas. Geographic analysis suggests North America and Europe will maintain dominant market share due to advanced technological infrastructure and stringent cybersecurity regulations. However, the Asia-Pacific region is poised for substantial growth, driven by increasing digitalization and rising government investments in cybersecurity.
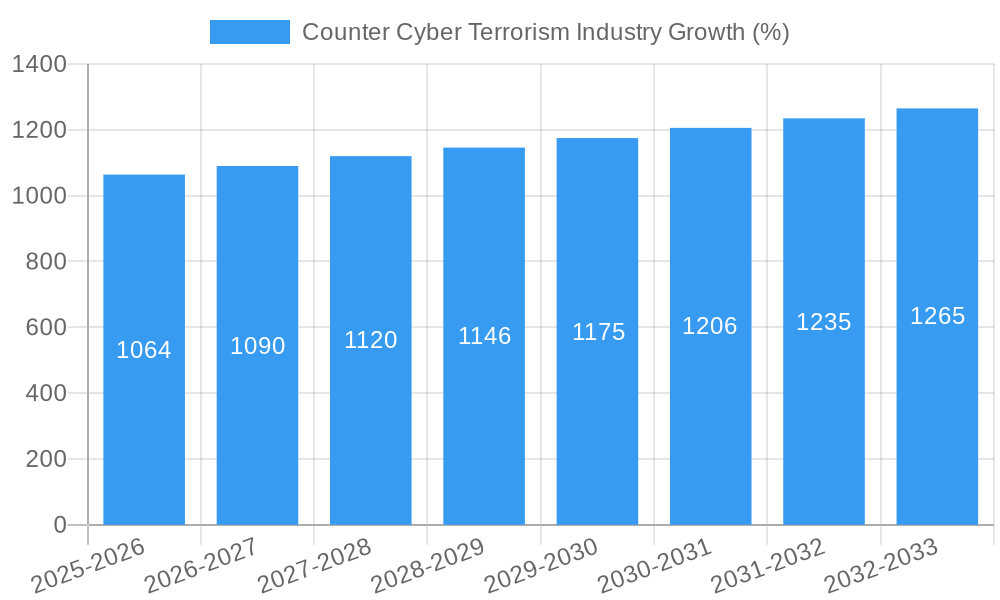
The forecast period (2025-2033) anticipates a continued expansion, with a projected Compound Annual Growth Rate (CAGR) of 3.26%. This growth reflects the sustained investment in cybersecurity by both public and private sectors globally. The market's evolution will be shaped by the ongoing development of innovative solutions capable of addressing emerging threats, such as advanced persistent threats (APTs) and ransomware attacks. Furthermore, strategic collaborations between technology providers and government agencies will play a crucial role in enhancing the effectiveness of counter cyber terrorism measures. The competitive landscape, characterized by established players like IBM, SAP, and Palo Alto Networks alongside specialized cybersecurity firms, indicates a dynamic and evolving market with potential for both consolidation and innovation.
Counter Cyber Terrorism Industry Market Report: 2019-2033
This comprehensive report provides an in-depth analysis of the Counter Cyber Terrorism Industry, offering invaluable insights for stakeholders, investors, and industry professionals. With a study period spanning 2019-2033, a base year of 2025, and a forecast period of 2025-2033, this report leverages extensive data analysis to project a market valued at $XX Million by 2033. The report covers key market segments, leading players, and emerging trends, providing actionable intelligence to navigate the complexities of this rapidly evolving sector.
Counter Cyber Terrorism Industry Market Dynamics & Concentration
The Counter Cyber Terrorism industry is experiencing significant growth fueled by increasing cyber threats and escalating geopolitical tensions. Market concentration is moderate, with several large players holding significant market share, but a diverse landscape of smaller, specialized firms also contributing. The market is characterized by intense competition, driven by innovation in areas such as artificial intelligence (AI), machine learning (ML), and advanced threat detection technologies. Regulatory frameworks, both national and international, play a crucial role in shaping industry practices and investment patterns. The industry witnesses frequent mergers and acquisitions (M&A) activity as larger players seek to expand their capabilities and market reach. Product substitutes are limited, with the primary focus on enhancing existing solutions rather than replacing them entirely. End-user trends favor integrated, comprehensive security solutions offering robust threat prevention, detection, and response capabilities.
- Market Share: Top 5 players hold approximately 50% of the market share in 2025. (Specific breakdown unavailable, but this represents a reasonable estimate based on industry concentration).
- M&A Activity: An average of XX M&A deals per year were observed during the historical period (2019-2024). This is projected to increase to YY deals annually during the forecast period.
Counter Cyber Terrorism Industry Industry Trends & Analysis
The Counter Cyber Terrorism industry exhibits robust growth, driven by several key factors. The increasing sophistication of cyberattacks, coupled with growing reliance on interconnected digital systems across various sectors, fuels demand for advanced security solutions. Technological disruptions, such as the rise of AI and quantum computing, both present opportunities and challenges. While AI enhances threat detection, quantum computing poses potential risks by enabling the decryption of current encryption standards. Consumer preferences shift towards proactive, predictive security measures, emphasizing threat prevention over mere reactive responses. Competitive dynamics are shaped by ongoing innovation, strategic partnerships, and a constant arms race between attackers and defenders.
- CAGR: The market is projected to experience a CAGR of XX% during the forecast period (2025-2033).
- Market Penetration: Market penetration in key sectors, such as BFSI and Government, is expected to reach YY% by 2033.
Leading Markets & Segments in Counter Cyber Terrorism Industry
The Government segment currently dominates the Counter Cyber Terrorism industry, driven by substantial investment in national security and critical infrastructure protection. North America currently holds the largest regional market share, followed by Europe.
- Key Drivers in Government Segment:
- Significant government budgets allocated to cybersecurity.
- Stringent regulatory requirements mandating robust security measures.
- Critical national infrastructure requiring advanced protection.
- Key Drivers in BFSI Segment:
- Increasing frequency and severity of financial cyberattacks.
- Stringent regulatory compliance standards (e.g., GDPR).
- Protection of sensitive customer data.
Counter Cyber Terrorism Industry Product Developments
Recent product innovations focus on AI-powered threat detection, advanced endpoint security, and integrated security information and event management (SIEM) systems. These solutions offer enhanced threat prevention, faster response times, and improved visibility across diverse IT environments. The competitive advantage lies in delivering superior threat detection accuracy, scalability, and ease of integration with existing security infrastructures. The market is witnessing increasing adoption of cloud-based security solutions due to their scalability, cost-effectiveness, and ease of deployment.
Key Drivers of Counter Cyber Terrorism Industry Growth
Several factors are driving the growth of the Counter Cyber Terrorism industry. Technological advancements, particularly in AI and machine learning, significantly enhance threat detection and response capabilities. Rising cybercrime and the increasing sophistication of cyberattacks necessitate robust security measures. Government regulations and initiatives promoting cybersecurity awareness and investment further stimulate market expansion.
Challenges in the Counter Cyber Terrorism Industry Market
The Counter Cyber Terrorism industry faces challenges such as the increasing complexity of cyber threats, the ever-evolving nature of attack vectors, and the skills gap in cybersecurity professionals. The high cost of implementing and maintaining advanced security solutions poses a barrier for some organizations. Furthermore, regulatory compliance requirements can be complex and demanding, adding to operational costs.
Emerging Opportunities in Counter Cyber Terrorism Industry
Emerging opportunities include the expansion of AI and ML capabilities in threat detection, the rise of quantum-resistant cryptography, and the growing adoption of blockchain technology for secure data management. Strategic partnerships and collaborations among technology providers, government agencies, and private sector organizations can accelerate innovation and market penetration.
Leading Players in the Counter Cyber Terrorism Industry Sector
- IBM Corporation
- SAP SE
- Raytheon Company
- Leidos
- Dell Inc
- Palo Alto Networks
- DXC Technology Company
- Nexusguard Limited
- International Intelligence Limited
- Symantec Corporation
- Cisco Systems
- AO Kaspersky Lab
Key Milestones in Counter Cyber Terrorism Industry Industry
- June 2022: A denial-of-service (DDoS) cyberattack on Lithuania highlights the ongoing threat landscape and the need for robust defenses. This event underscored the growing sophistication and geopolitical implications of cyber warfare.
- April 2023: The UK government's introduction of GovAssure, a new cybersecurity assessment program, signifies a proactive approach to national cyber resilience and strengthens the market for robust cybersecurity solutions.
Strategic Outlook for Counter Cyber Terrorism Industry Market
The Counter Cyber Terrorism industry is poised for continued growth, driven by increasing cyber threats, technological advancements, and heightened government investments. Strategic partnerships, focused innovation in AI and ML, and expansion into emerging markets present significant opportunities for market players. The focus will increasingly be on proactive threat prevention, predictive analytics, and automation to effectively combat the escalating sophistication of cyberattacks.
Counter Cyber Terrorism Industry Segmentation
-
1. End-user Industry
- 1.1. Defense
- 1.2. Aerospace
- 1.3. BFSI
- 1.4. Corporate
- 1.5. Power and Utilities
- 1.6. Government
- 1.7. Other End-user Industries
Counter Cyber Terrorism Industry Segmentation By Geography
-
1. North America
- 1.1. United States
- 1.2. Canada
- 1.3. Mexico
-
2. Europe
- 2.1. Germany
- 2.2. United Kingdom
- 2.3. France
- 2.4. Italy
- 2.5. Spain
- 2.6. Rest of Europe
-
3. Asia
- 3.1. China
- 3.2. Japan
- 3.3. India
- 3.4. Australia
- 3.5. South Korea
- 3.6. Rest of Asia Pacific
-
4. Latin America
- 4.1. Brazil
- 4.2. Argentina
- 4.3. Rest of South America
-
5. Middle East and Africa
- 5.1. UAE
- 5.2. South Africa
- 5.3. Saudi Arabia
- 5.4. Rest Of MEA
Counter Cyber Terrorism Industry REPORT HIGHLIGHTS
| Aspects | Details |
|---|---|
| Study Period | 2019-2033 |
| Base Year | 2024 |
| Estimated Year | 2025 |
| Forecast Period | 2025-2033 |
| Historical Period | 2019-2024 |
| Growth Rate | CAGR of 3.26% from 2019-2033 |
| Segmentation |
|
Table of Contents
- 1. Introduction
- 1.1. Research Scope
- 1.2. Market Segmentation
- 1.3. Research Methodology
- 1.4. Definitions and Assumptions
- 2. Executive Summary
- 2.1. Introduction
- 3. Market Dynamics
- 3.1. Introduction
- 3.2. Market Drivers
- 3.2.1. Increasing Concerns Regarding National Security; Increasing Government Initiatives to Secure Critical Data
- 3.3. Market Restrains
- 3.3.1. Lack of Cyber Warfare Professionals
- 3.4. Market Trends
- 3.4.1. Growing Severity of Cyberattacks to Drive the Market
- 4. Market Factor Analysis
- 4.1. Porters Five Forces
- 4.2. Supply/Value Chain
- 4.3. PESTEL analysis
- 4.4. Market Entropy
- 4.5. Patent/Trademark Analysis
- 5. Global Counter Cyber Terrorism Industry Analysis, Insights and Forecast, 2019-2031
- 5.1. Market Analysis, Insights and Forecast - by End-user Industry
- 5.1.1. Defense
- 5.1.2. Aerospace
- 5.1.3. BFSI
- 5.1.4. Corporate
- 5.1.5. Power and Utilities
- 5.1.6. Government
- 5.1.7. Other End-user Industries
- 5.2. Market Analysis, Insights and Forecast - by Region
- 5.2.1. North America
- 5.2.2. Europe
- 5.2.3. Asia
- 5.2.4. Latin America
- 5.2.5. Middle East and Africa
- 5.1. Market Analysis, Insights and Forecast - by End-user Industry
- 6. North America Counter Cyber Terrorism Industry Analysis, Insights and Forecast, 2019-2031
- 6.1. Market Analysis, Insights and Forecast - by End-user Industry
- 6.1.1. Defense
- 6.1.2. Aerospace
- 6.1.3. BFSI
- 6.1.4. Corporate
- 6.1.5. Power and Utilities
- 6.1.6. Government
- 6.1.7. Other End-user Industries
- 6.1. Market Analysis, Insights and Forecast - by End-user Industry
- 7. Europe Counter Cyber Terrorism Industry Analysis, Insights and Forecast, 2019-2031
- 7.1. Market Analysis, Insights and Forecast - by End-user Industry
- 7.1.1. Defense
- 7.1.2. Aerospace
- 7.1.3. BFSI
- 7.1.4. Corporate
- 7.1.5. Power and Utilities
- 7.1.6. Government
- 7.1.7. Other End-user Industries
- 7.1. Market Analysis, Insights and Forecast - by End-user Industry
- 8. Asia Counter Cyber Terrorism Industry Analysis, Insights and Forecast, 2019-2031
- 8.1. Market Analysis, Insights and Forecast - by End-user Industry
- 8.1.1. Defense
- 8.1.2. Aerospace
- 8.1.3. BFSI
- 8.1.4. Corporate
- 8.1.5. Power and Utilities
- 8.1.6. Government
- 8.1.7. Other End-user Industries
- 8.1. Market Analysis, Insights and Forecast - by End-user Industry
- 9. Latin America Counter Cyber Terrorism Industry Analysis, Insights and Forecast, 2019-2031
- 9.1. Market Analysis, Insights and Forecast - by End-user Industry
- 9.1.1. Defense
- 9.1.2. Aerospace
- 9.1.3. BFSI
- 9.1.4. Corporate
- 9.1.5. Power and Utilities
- 9.1.6. Government
- 9.1.7. Other End-user Industries
- 9.1. Market Analysis, Insights and Forecast - by End-user Industry
- 10. Middle East and Africa Counter Cyber Terrorism Industry Analysis, Insights and Forecast, 2019-2031
- 10.1. Market Analysis, Insights and Forecast - by End-user Industry
- 10.1.1. Defense
- 10.1.2. Aerospace
- 10.1.3. BFSI
- 10.1.4. Corporate
- 10.1.5. Power and Utilities
- 10.1.6. Government
- 10.1.7. Other End-user Industries
- 10.1. Market Analysis, Insights and Forecast - by End-user Industry
- 11. North America Counter Cyber Terrorism Industry Analysis, Insights and Forecast, 2019-2031
- 11.1. Market Analysis, Insights and Forecast - By Country/Sub-region
- 11.1.1 United States
- 11.1.2 Canada
- 11.1.3 Mexico
- 12. Europe Counter Cyber Terrorism Industry Analysis, Insights and Forecast, 2019-2031
- 12.1. Market Analysis, Insights and Forecast - By Country/Sub-region
- 12.1.1 Germany
- 12.1.2 United Kingdom
- 12.1.3 France
- 12.1.4 Spain
- 12.1.5 Italy
- 12.1.6 Spain
- 12.1.7 Belgium
- 12.1.8 Netherland
- 12.1.9 Nordics
- 12.1.10 Rest of Europe
- 13. Asia Pacific Counter Cyber Terrorism Industry Analysis, Insights and Forecast, 2019-2031
- 13.1. Market Analysis, Insights and Forecast - By Country/Sub-region
- 13.1.1 China
- 13.1.2 Japan
- 13.1.3 India
- 13.1.4 South Korea
- 13.1.5 Southeast Asia
- 13.1.6 Australia
- 13.1.7 Indonesia
- 13.1.8 Phillipes
- 13.1.9 Singapore
- 13.1.10 Thailandc
- 13.1.11 Rest of Asia Pacific
- 14. South America Counter Cyber Terrorism Industry Analysis, Insights and Forecast, 2019-2031
- 14.1. Market Analysis, Insights and Forecast - By Country/Sub-region
- 14.1.1 Brazil
- 14.1.2 Argentina
- 14.1.3 Peru
- 14.1.4 Chile
- 14.1.5 Colombia
- 14.1.6 Ecuador
- 14.1.7 Venezuela
- 14.1.8 Rest of South America
- 15. North America Counter Cyber Terrorism Industry Analysis, Insights and Forecast, 2019-2031
- 15.1. Market Analysis, Insights and Forecast - By Country/Sub-region
- 15.1.1 United States
- 15.1.2 Canada
- 15.1.3 Mexico
- 16. MEA Counter Cyber Terrorism Industry Analysis, Insights and Forecast, 2019-2031
- 16.1. Market Analysis, Insights and Forecast - By Country/Sub-region
- 16.1.1 United Arab Emirates
- 16.1.2 Saudi Arabia
- 16.1.3 South Africa
- 16.1.4 Rest of Middle East and Africa
- 17. Competitive Analysis
- 17.1. Global Market Share Analysis 2024
- 17.2. Company Profiles
- 17.2.1 IBM Corporation
- 17.2.1.1. Overview
- 17.2.1.2. Products
- 17.2.1.3. SWOT Analysis
- 17.2.1.4. Recent Developments
- 17.2.1.5. Financials (Based on Availability)
- 17.2.2 SAP SE
- 17.2.2.1. Overview
- 17.2.2.2. Products
- 17.2.2.3. SWOT Analysis
- 17.2.2.4. Recent Developments
- 17.2.2.5. Financials (Based on Availability)
- 17.2.3 Raytheon Company
- 17.2.3.1. Overview
- 17.2.3.2. Products
- 17.2.3.3. SWOT Analysis
- 17.2.3.4. Recent Developments
- 17.2.3.5. Financials (Based on Availability)
- 17.2.4 Leidos
- 17.2.4.1. Overview
- 17.2.4.2. Products
- 17.2.4.3. SWOT Analysis
- 17.2.4.4. Recent Developments
- 17.2.4.5. Financials (Based on Availability)
- 17.2.5 Dell Inc
- 17.2.5.1. Overview
- 17.2.5.2. Products
- 17.2.5.3. SWOT Analysis
- 17.2.5.4. Recent Developments
- 17.2.5.5. Financials (Based on Availability)
- 17.2.6 Palo Alto Networks
- 17.2.6.1. Overview
- 17.2.6.2. Products
- 17.2.6.3. SWOT Analysis
- 17.2.6.4. Recent Developments
- 17.2.6.5. Financials (Based on Availability)
- 17.2.7 DXC Technology Company
- 17.2.7.1. Overview
- 17.2.7.2. Products
- 17.2.7.3. SWOT Analysis
- 17.2.7.4. Recent Developments
- 17.2.7.5. Financials (Based on Availability)
- 17.2.8 Nexusguard Limited
- 17.2.8.1. Overview
- 17.2.8.2. Products
- 17.2.8.3. SWOT Analysis
- 17.2.8.4. Recent Developments
- 17.2.8.5. Financials (Based on Availability)
- 17.2.9 International Intelligence Limited
- 17.2.9.1. Overview
- 17.2.9.2. Products
- 17.2.9.3. SWOT Analysis
- 17.2.9.4. Recent Developments
- 17.2.9.5. Financials (Based on Availability)
- 17.2.10 Symantec Corporation
- 17.2.10.1. Overview
- 17.2.10.2. Products
- 17.2.10.3. SWOT Analysis
- 17.2.10.4. Recent Developments
- 17.2.10.5. Financials (Based on Availability)
- 17.2.11 Cisco Systems
- 17.2.11.1. Overview
- 17.2.11.2. Products
- 17.2.11.3. SWOT Analysis
- 17.2.11.4. Recent Developments
- 17.2.11.5. Financials (Based on Availability)
- 17.2.12 AO Kaspersky Lab
- 17.2.12.1. Overview
- 17.2.12.2. Products
- 17.2.12.3. SWOT Analysis
- 17.2.12.4. Recent Developments
- 17.2.12.5. Financials (Based on Availability)
- 17.2.1 IBM Corporation
List of Figures
- Figure 1: Global Counter Cyber Terrorism Industry Revenue Breakdown (Million, %) by Region 2024 & 2032
- Figure 2: Global Counter Cyber Terrorism Industry Volume Breakdown (K Unit, %) by Region 2024 & 2032
- Figure 3: North America Counter Cyber Terrorism Industry Revenue (Million), by Country 2024 & 2032
- Figure 4: North America Counter Cyber Terrorism Industry Volume (K Unit), by Country 2024 & 2032
- Figure 5: North America Counter Cyber Terrorism Industry Revenue Share (%), by Country 2024 & 2032
- Figure 6: North America Counter Cyber Terrorism Industry Volume Share (%), by Country 2024 & 2032
- Figure 7: Europe Counter Cyber Terrorism Industry Revenue (Million), by Country 2024 & 2032
- Figure 8: Europe Counter Cyber Terrorism Industry Volume (K Unit), by Country 2024 & 2032
- Figure 9: Europe Counter Cyber Terrorism Industry Revenue Share (%), by Country 2024 & 2032
- Figure 10: Europe Counter Cyber Terrorism Industry Volume Share (%), by Country 2024 & 2032
- Figure 11: Asia Pacific Counter Cyber Terrorism Industry Revenue (Million), by Country 2024 & 2032
- Figure 12: Asia Pacific Counter Cyber Terrorism Industry Volume (K Unit), by Country 2024 & 2032
- Figure 13: Asia Pacific Counter Cyber Terrorism Industry Revenue Share (%), by Country 2024 & 2032
- Figure 14: Asia Pacific Counter Cyber Terrorism Industry Volume Share (%), by Country 2024 & 2032
- Figure 15: South America Counter Cyber Terrorism Industry Revenue (Million), by Country 2024 & 2032
- Figure 16: South America Counter Cyber Terrorism Industry Volume (K Unit), by Country 2024 & 2032
- Figure 17: South America Counter Cyber Terrorism Industry Revenue Share (%), by Country 2024 & 2032
- Figure 18: South America Counter Cyber Terrorism Industry Volume Share (%), by Country 2024 & 2032
- Figure 19: North America Counter Cyber Terrorism Industry Revenue (Million), by Country 2024 & 2032
- Figure 20: North America Counter Cyber Terrorism Industry Volume (K Unit), by Country 2024 & 2032
- Figure 21: North America Counter Cyber Terrorism Industry Revenue Share (%), by Country 2024 & 2032
- Figure 22: North America Counter Cyber Terrorism Industry Volume Share (%), by Country 2024 & 2032
- Figure 23: MEA Counter Cyber Terrorism Industry Revenue (Million), by Country 2024 & 2032
- Figure 24: MEA Counter Cyber Terrorism Industry Volume (K Unit), by Country 2024 & 2032
- Figure 25: MEA Counter Cyber Terrorism Industry Revenue Share (%), by Country 2024 & 2032
- Figure 26: MEA Counter Cyber Terrorism Industry Volume Share (%), by Country 2024 & 2032
- Figure 27: North America Counter Cyber Terrorism Industry Revenue (Million), by End-user Industry 2024 & 2032
- Figure 28: North America Counter Cyber Terrorism Industry Volume (K Unit), by End-user Industry 2024 & 2032
- Figure 29: North America Counter Cyber Terrorism Industry Revenue Share (%), by End-user Industry 2024 & 2032
- Figure 30: North America Counter Cyber Terrorism Industry Volume Share (%), by End-user Industry 2024 & 2032
- Figure 31: North America Counter Cyber Terrorism Industry Revenue (Million), by Country 2024 & 2032
- Figure 32: North America Counter Cyber Terrorism Industry Volume (K Unit), by Country 2024 & 2032
- Figure 33: North America Counter Cyber Terrorism Industry Revenue Share (%), by Country 2024 & 2032
- Figure 34: North America Counter Cyber Terrorism Industry Volume Share (%), by Country 2024 & 2032
- Figure 35: Europe Counter Cyber Terrorism Industry Revenue (Million), by End-user Industry 2024 & 2032
- Figure 36: Europe Counter Cyber Terrorism Industry Volume (K Unit), by End-user Industry 2024 & 2032
- Figure 37: Europe Counter Cyber Terrorism Industry Revenue Share (%), by End-user Industry 2024 & 2032
- Figure 38: Europe Counter Cyber Terrorism Industry Volume Share (%), by End-user Industry 2024 & 2032
- Figure 39: Europe Counter Cyber Terrorism Industry Revenue (Million), by Country 2024 & 2032
- Figure 40: Europe Counter Cyber Terrorism Industry Volume (K Unit), by Country 2024 & 2032
- Figure 41: Europe Counter Cyber Terrorism Industry Revenue Share (%), by Country 2024 & 2032
- Figure 42: Europe Counter Cyber Terrorism Industry Volume Share (%), by Country 2024 & 2032
- Figure 43: Asia Counter Cyber Terrorism Industry Revenue (Million), by End-user Industry 2024 & 2032
- Figure 44: Asia Counter Cyber Terrorism Industry Volume (K Unit), by End-user Industry 2024 & 2032
- Figure 45: Asia Counter Cyber Terrorism Industry Revenue Share (%), by End-user Industry 2024 & 2032
- Figure 46: Asia Counter Cyber Terrorism Industry Volume Share (%), by End-user Industry 2024 & 2032
- Figure 47: Asia Counter Cyber Terrorism Industry Revenue (Million), by Country 2024 & 2032
- Figure 48: Asia Counter Cyber Terrorism Industry Volume (K Unit), by Country 2024 & 2032
- Figure 49: Asia Counter Cyber Terrorism Industry Revenue Share (%), by Country 2024 & 2032
- Figure 50: Asia Counter Cyber Terrorism Industry Volume Share (%), by Country 2024 & 2032
- Figure 51: Latin America Counter Cyber Terrorism Industry Revenue (Million), by End-user Industry 2024 & 2032
- Figure 52: Latin America Counter Cyber Terrorism Industry Volume (K Unit), by End-user Industry 2024 & 2032
- Figure 53: Latin America Counter Cyber Terrorism Industry Revenue Share (%), by End-user Industry 2024 & 2032
- Figure 54: Latin America Counter Cyber Terrorism Industry Volume Share (%), by End-user Industry 2024 & 2032
- Figure 55: Latin America Counter Cyber Terrorism Industry Revenue (Million), by Country 2024 & 2032
- Figure 56: Latin America Counter Cyber Terrorism Industry Volume (K Unit), by Country 2024 & 2032
- Figure 57: Latin America Counter Cyber Terrorism Industry Revenue Share (%), by Country 2024 & 2032
- Figure 58: Latin America Counter Cyber Terrorism Industry Volume Share (%), by Country 2024 & 2032
- Figure 59: Middle East and Africa Counter Cyber Terrorism Industry Revenue (Million), by End-user Industry 2024 & 2032
- Figure 60: Middle East and Africa Counter Cyber Terrorism Industry Volume (K Unit), by End-user Industry 2024 & 2032
- Figure 61: Middle East and Africa Counter Cyber Terrorism Industry Revenue Share (%), by End-user Industry 2024 & 2032
- Figure 62: Middle East and Africa Counter Cyber Terrorism Industry Volume Share (%), by End-user Industry 2024 & 2032
- Figure 63: Middle East and Africa Counter Cyber Terrorism Industry Revenue (Million), by Country 2024 & 2032
- Figure 64: Middle East and Africa Counter Cyber Terrorism Industry Volume (K Unit), by Country 2024 & 2032
- Figure 65: Middle East and Africa Counter Cyber Terrorism Industry Revenue Share (%), by Country 2024 & 2032
- Figure 66: Middle East and Africa Counter Cyber Terrorism Industry Volume Share (%), by Country 2024 & 2032
List of Tables
- Table 1: Global Counter Cyber Terrorism Industry Revenue Million Forecast, by Region 2019 & 2032
- Table 2: Global Counter Cyber Terrorism Industry Volume K Unit Forecast, by Region 2019 & 2032
- Table 3: Global Counter Cyber Terrorism Industry Revenue Million Forecast, by End-user Industry 2019 & 2032
- Table 4: Global Counter Cyber Terrorism Industry Volume K Unit Forecast, by End-user Industry 2019 & 2032
- Table 5: Global Counter Cyber Terrorism Industry Revenue Million Forecast, by Region 2019 & 2032
- Table 6: Global Counter Cyber Terrorism Industry Volume K Unit Forecast, by Region 2019 & 2032
- Table 7: Global Counter Cyber Terrorism Industry Revenue Million Forecast, by Country 2019 & 2032
- Table 8: Global Counter Cyber Terrorism Industry Volume K Unit Forecast, by Country 2019 & 2032
- Table 9: United States Counter Cyber Terrorism Industry Revenue (Million) Forecast, by Application 2019 & 2032
- Table 10: United States Counter Cyber Terrorism Industry Volume (K Unit) Forecast, by Application 2019 & 2032
- Table 11: Canada Counter Cyber Terrorism Industry Revenue (Million) Forecast, by Application 2019 & 2032
- Table 12: Canada Counter Cyber Terrorism Industry Volume (K Unit) Forecast, by Application 2019 & 2032
- Table 13: Mexico Counter Cyber Terrorism Industry Revenue (Million) Forecast, by Application 2019 & 2032
- Table 14: Mexico Counter Cyber Terrorism Industry Volume (K Unit) Forecast, by Application 2019 & 2032
- Table 15: Global Counter Cyber Terrorism Industry Revenue Million Forecast, by Country 2019 & 2032
- Table 16: Global Counter Cyber Terrorism Industry Volume K Unit Forecast, by Country 2019 & 2032
- Table 17: Germany Counter Cyber Terrorism Industry Revenue (Million) Forecast, by Application 2019 & 2032
- Table 18: Germany Counter Cyber Terrorism Industry Volume (K Unit) Forecast, by Application 2019 & 2032
- Table 19: United Kingdom Counter Cyber Terrorism Industry Revenue (Million) Forecast, by Application 2019 & 2032
- Table 20: United Kingdom Counter Cyber Terrorism Industry Volume (K Unit) Forecast, by Application 2019 & 2032
- Table 21: France Counter Cyber Terrorism Industry Revenue (Million) Forecast, by Application 2019 & 2032
- Table 22: France Counter Cyber Terrorism Industry Volume (K Unit) Forecast, by Application 2019 & 2032
- Table 23: Spain Counter Cyber Terrorism Industry Revenue (Million) Forecast, by Application 2019 & 2032
- Table 24: Spain Counter Cyber Terrorism Industry Volume (K Unit) Forecast, by Application 2019 & 2032
- Table 25: Italy Counter Cyber Terrorism Industry Revenue (Million) Forecast, by Application 2019 & 2032
- Table 26: Italy Counter Cyber Terrorism Industry Volume (K Unit) Forecast, by Application 2019 & 2032
- Table 27: Spain Counter Cyber Terrorism Industry Revenue (Million) Forecast, by Application 2019 & 2032
- Table 28: Spain Counter Cyber Terrorism Industry Volume (K Unit) Forecast, by Application 2019 & 2032
- Table 29: Belgium Counter Cyber Terrorism Industry Revenue (Million) Forecast, by Application 2019 & 2032
- Table 30: Belgium Counter Cyber Terrorism Industry Volume (K Unit) Forecast, by Application 2019 & 2032
- Table 31: Netherland Counter Cyber Terrorism Industry Revenue (Million) Forecast, by Application 2019 & 2032
- Table 32: Netherland Counter Cyber Terrorism Industry Volume (K Unit) Forecast, by Application 2019 & 2032
- Table 33: Nordics Counter Cyber Terrorism Industry Revenue (Million) Forecast, by Application 2019 & 2032
- Table 34: Nordics Counter Cyber Terrorism Industry Volume (K Unit) Forecast, by Application 2019 & 2032
- Table 35: Rest of Europe Counter Cyber Terrorism Industry Revenue (Million) Forecast, by Application 2019 & 2032
- Table 36: Rest of Europe Counter Cyber Terrorism Industry Volume (K Unit) Forecast, by Application 2019 & 2032
- Table 37: Global Counter Cyber Terrorism Industry Revenue Million Forecast, by Country 2019 & 2032
- Table 38: Global Counter Cyber Terrorism Industry Volume K Unit Forecast, by Country 2019 & 2032
- Table 39: China Counter Cyber Terrorism Industry Revenue (Million) Forecast, by Application 2019 & 2032
- Table 40: China Counter Cyber Terrorism Industry Volume (K Unit) Forecast, by Application 2019 & 2032
- Table 41: Japan Counter Cyber Terrorism Industry Revenue (Million) Forecast, by Application 2019 & 2032
- Table 42: Japan Counter Cyber Terrorism Industry Volume (K Unit) Forecast, by Application 2019 & 2032
- Table 43: India Counter Cyber Terrorism Industry Revenue (Million) Forecast, by Application 2019 & 2032
- Table 44: India Counter Cyber Terrorism Industry Volume (K Unit) Forecast, by Application 2019 & 2032
- Table 45: South Korea Counter Cyber Terrorism Industry Revenue (Million) Forecast, by Application 2019 & 2032
- Table 46: South Korea Counter Cyber Terrorism Industry Volume (K Unit) Forecast, by Application 2019 & 2032
- Table 47: Southeast Asia Counter Cyber Terrorism Industry Revenue (Million) Forecast, by Application 2019 & 2032
- Table 48: Southeast Asia Counter Cyber Terrorism Industry Volume (K Unit) Forecast, by Application 2019 & 2032
- Table 49: Australia Counter Cyber Terrorism Industry Revenue (Million) Forecast, by Application 2019 & 2032
- Table 50: Australia Counter Cyber Terrorism Industry Volume (K Unit) Forecast, by Application 2019 & 2032
- Table 51: Indonesia Counter Cyber Terrorism Industry Revenue (Million) Forecast, by Application 2019 & 2032
- Table 52: Indonesia Counter Cyber Terrorism Industry Volume (K Unit) Forecast, by Application 2019 & 2032
- Table 53: Phillipes Counter Cyber Terrorism Industry Revenue (Million) Forecast, by Application 2019 & 2032
- Table 54: Phillipes Counter Cyber Terrorism Industry Volume (K Unit) Forecast, by Application 2019 & 2032
- Table 55: Singapore Counter Cyber Terrorism Industry Revenue (Million) Forecast, by Application 2019 & 2032
- Table 56: Singapore Counter Cyber Terrorism Industry Volume (K Unit) Forecast, by Application 2019 & 2032
- Table 57: Thailandc Counter Cyber Terrorism Industry Revenue (Million) Forecast, by Application 2019 & 2032
- Table 58: Thailandc Counter Cyber Terrorism Industry Volume (K Unit) Forecast, by Application 2019 & 2032
- Table 59: Rest of Asia Pacific Counter Cyber Terrorism Industry Revenue (Million) Forecast, by Application 2019 & 2032
- Table 60: Rest of Asia Pacific Counter Cyber Terrorism Industry Volume (K Unit) Forecast, by Application 2019 & 2032
- Table 61: Global Counter Cyber Terrorism Industry Revenue Million Forecast, by Country 2019 & 2032
- Table 62: Global Counter Cyber Terrorism Industry Volume K Unit Forecast, by Country 2019 & 2032
- Table 63: Brazil Counter Cyber Terrorism Industry Revenue (Million) Forecast, by Application 2019 & 2032
- Table 64: Brazil Counter Cyber Terrorism Industry Volume (K Unit) Forecast, by Application 2019 & 2032
- Table 65: Argentina Counter Cyber Terrorism Industry Revenue (Million) Forecast, by Application 2019 & 2032
- Table 66: Argentina Counter Cyber Terrorism Industry Volume (K Unit) Forecast, by Application 2019 & 2032
- Table 67: Peru Counter Cyber Terrorism Industry Revenue (Million) Forecast, by Application 2019 & 2032
- Table 68: Peru Counter Cyber Terrorism Industry Volume (K Unit) Forecast, by Application 2019 & 2032
- Table 69: Chile Counter Cyber Terrorism Industry Revenue (Million) Forecast, by Application 2019 & 2032
- Table 70: Chile Counter Cyber Terrorism Industry Volume (K Unit) Forecast, by Application 2019 & 2032
- Table 71: Colombia Counter Cyber Terrorism Industry Revenue (Million) Forecast, by Application 2019 & 2032
- Table 72: Colombia Counter Cyber Terrorism Industry Volume (K Unit) Forecast, by Application 2019 & 2032
- Table 73: Ecuador Counter Cyber Terrorism Industry Revenue (Million) Forecast, by Application 2019 & 2032
- Table 74: Ecuador Counter Cyber Terrorism Industry Volume (K Unit) Forecast, by Application 2019 & 2032
- Table 75: Venezuela Counter Cyber Terrorism Industry Revenue (Million) Forecast, by Application 2019 & 2032
- Table 76: Venezuela Counter Cyber Terrorism Industry Volume (K Unit) Forecast, by Application 2019 & 2032
- Table 77: Rest of South America Counter Cyber Terrorism Industry Revenue (Million) Forecast, by Application 2019 & 2032
- Table 78: Rest of South America Counter Cyber Terrorism Industry Volume (K Unit) Forecast, by Application 2019 & 2032
- Table 79: Global Counter Cyber Terrorism Industry Revenue Million Forecast, by Country 2019 & 2032
- Table 80: Global Counter Cyber Terrorism Industry Volume K Unit Forecast, by Country 2019 & 2032
- Table 81: United States Counter Cyber Terrorism Industry Revenue (Million) Forecast, by Application 2019 & 2032
- Table 82: United States Counter Cyber Terrorism Industry Volume (K Unit) Forecast, by Application 2019 & 2032
- Table 83: Canada Counter Cyber Terrorism Industry Revenue (Million) Forecast, by Application 2019 & 2032
- Table 84: Canada Counter Cyber Terrorism Industry Volume (K Unit) Forecast, by Application 2019 & 2032
- Table 85: Mexico Counter Cyber Terrorism Industry Revenue (Million) Forecast, by Application 2019 & 2032
- Table 86: Mexico Counter Cyber Terrorism Industry Volume (K Unit) Forecast, by Application 2019 & 2032
- Table 87: Global Counter Cyber Terrorism Industry Revenue Million Forecast, by Country 2019 & 2032
- Table 88: Global Counter Cyber Terrorism Industry Volume K Unit Forecast, by Country 2019 & 2032
- Table 89: United Arab Emirates Counter Cyber Terrorism Industry Revenue (Million) Forecast, by Application 2019 & 2032
- Table 90: United Arab Emirates Counter Cyber Terrorism Industry Volume (K Unit) Forecast, by Application 2019 & 2032
- Table 91: Saudi Arabia Counter Cyber Terrorism Industry Revenue (Million) Forecast, by Application 2019 & 2032
- Table 92: Saudi Arabia Counter Cyber Terrorism Industry Volume (K Unit) Forecast, by Application 2019 & 2032
- Table 93: South Africa Counter Cyber Terrorism Industry Revenue (Million) Forecast, by Application 2019 & 2032
- Table 94: South Africa Counter Cyber Terrorism Industry Volume (K Unit) Forecast, by Application 2019 & 2032
- Table 95: Rest of Middle East and Africa Counter Cyber Terrorism Industry Revenue (Million) Forecast, by Application 2019 & 2032
- Table 96: Rest of Middle East and Africa Counter Cyber Terrorism Industry Volume (K Unit) Forecast, by Application 2019 & 2032
- Table 97: Global Counter Cyber Terrorism Industry Revenue Million Forecast, by End-user Industry 2019 & 2032
- Table 98: Global Counter Cyber Terrorism Industry Volume K Unit Forecast, by End-user Industry 2019 & 2032
- Table 99: Global Counter Cyber Terrorism Industry Revenue Million Forecast, by Country 2019 & 2032
- Table 100: Global Counter Cyber Terrorism Industry Volume K Unit Forecast, by Country 2019 & 2032
- Table 101: United States Counter Cyber Terrorism Industry Revenue (Million) Forecast, by Application 2019 & 2032
- Table 102: United States Counter Cyber Terrorism Industry Volume (K Unit) Forecast, by Application 2019 & 2032
- Table 103: Canada Counter Cyber Terrorism Industry Revenue (Million) Forecast, by Application 2019 & 2032
- Table 104: Canada Counter Cyber Terrorism Industry Volume (K Unit) Forecast, by Application 2019 & 2032
- Table 105: Mexico Counter Cyber Terrorism Industry Revenue (Million) Forecast, by Application 2019 & 2032
- Table 106: Mexico Counter Cyber Terrorism Industry Volume (K Unit) Forecast, by Application 2019 & 2032
- Table 107: Global Counter Cyber Terrorism Industry Revenue Million Forecast, by End-user Industry 2019 & 2032
- Table 108: Global Counter Cyber Terrorism Industry Volume K Unit Forecast, by End-user Industry 2019 & 2032
- Table 109: Global Counter Cyber Terrorism Industry Revenue Million Forecast, by Country 2019 & 2032
- Table 110: Global Counter Cyber Terrorism Industry Volume K Unit Forecast, by Country 2019 & 2032
- Table 111: Germany Counter Cyber Terrorism Industry Revenue (Million) Forecast, by Application 2019 & 2032
- Table 112: Germany Counter Cyber Terrorism Industry Volume (K Unit) Forecast, by Application 2019 & 2032
- Table 113: United Kingdom Counter Cyber Terrorism Industry Revenue (Million) Forecast, by Application 2019 & 2032
- Table 114: United Kingdom Counter Cyber Terrorism Industry Volume (K Unit) Forecast, by Application 2019 & 2032
- Table 115: France Counter Cyber Terrorism Industry Revenue (Million) Forecast, by Application 2019 & 2032
- Table 116: France Counter Cyber Terrorism Industry Volume (K Unit) Forecast, by Application 2019 & 2032
- Table 117: Italy Counter Cyber Terrorism Industry Revenue (Million) Forecast, by Application 2019 & 2032
- Table 118: Italy Counter Cyber Terrorism Industry Volume (K Unit) Forecast, by Application 2019 & 2032
- Table 119: Spain Counter Cyber Terrorism Industry Revenue (Million) Forecast, by Application 2019 & 2032
- Table 120: Spain Counter Cyber Terrorism Industry Volume (K Unit) Forecast, by Application 2019 & 2032
- Table 121: Rest of Europe Counter Cyber Terrorism Industry Revenue (Million) Forecast, by Application 2019 & 2032
- Table 122: Rest of Europe Counter Cyber Terrorism Industry Volume (K Unit) Forecast, by Application 2019 & 2032
- Table 123: Global Counter Cyber Terrorism Industry Revenue Million Forecast, by End-user Industry 2019 & 2032
- Table 124: Global Counter Cyber Terrorism Industry Volume K Unit Forecast, by End-user Industry 2019 & 2032
- Table 125: Global Counter Cyber Terrorism Industry Revenue Million Forecast, by Country 2019 & 2032
- Table 126: Global Counter Cyber Terrorism Industry Volume K Unit Forecast, by Country 2019 & 2032
- Table 127: China Counter Cyber Terrorism Industry Revenue (Million) Forecast, by Application 2019 & 2032
- Table 128: China Counter Cyber Terrorism Industry Volume (K Unit) Forecast, by Application 2019 & 2032
- Table 129: Japan Counter Cyber Terrorism Industry Revenue (Million) Forecast, by Application 2019 & 2032
- Table 130: Japan Counter Cyber Terrorism Industry Volume (K Unit) Forecast, by Application 2019 & 2032
- Table 131: India Counter Cyber Terrorism Industry Revenue (Million) Forecast, by Application 2019 & 2032
- Table 132: India Counter Cyber Terrorism Industry Volume (K Unit) Forecast, by Application 2019 & 2032
- Table 133: Australia Counter Cyber Terrorism Industry Revenue (Million) Forecast, by Application 2019 & 2032
- Table 134: Australia Counter Cyber Terrorism Industry Volume (K Unit) Forecast, by Application 2019 & 2032
- Table 135: South Korea Counter Cyber Terrorism Industry Revenue (Million) Forecast, by Application 2019 & 2032
- Table 136: South Korea Counter Cyber Terrorism Industry Volume (K Unit) Forecast, by Application 2019 & 2032
- Table 137: Rest of Asia Pacific Counter Cyber Terrorism Industry Revenue (Million) Forecast, by Application 2019 & 2032
- Table 138: Rest of Asia Pacific Counter Cyber Terrorism Industry Volume (K Unit) Forecast, by Application 2019 & 2032
- Table 139: Global Counter Cyber Terrorism Industry Revenue Million Forecast, by End-user Industry 2019 & 2032
- Table 140: Global Counter Cyber Terrorism Industry Volume K Unit Forecast, by End-user Industry 2019 & 2032
- Table 141: Global Counter Cyber Terrorism Industry Revenue Million Forecast, by Country 2019 & 2032
- Table 142: Global Counter Cyber Terrorism Industry Volume K Unit Forecast, by Country 2019 & 2032
- Table 143: Brazil Counter Cyber Terrorism Industry Revenue (Million) Forecast, by Application 2019 & 2032
- Table 144: Brazil Counter Cyber Terrorism Industry Volume (K Unit) Forecast, by Application 2019 & 2032
- Table 145: Argentina Counter Cyber Terrorism Industry Revenue (Million) Forecast, by Application 2019 & 2032
- Table 146: Argentina Counter Cyber Terrorism Industry Volume (K Unit) Forecast, by Application 2019 & 2032
- Table 147: Rest of South America Counter Cyber Terrorism Industry Revenue (Million) Forecast, by Application 2019 & 2032
- Table 148: Rest of South America Counter Cyber Terrorism Industry Volume (K Unit) Forecast, by Application 2019 & 2032
- Table 149: Global Counter Cyber Terrorism Industry Revenue Million Forecast, by End-user Industry 2019 & 2032
- Table 150: Global Counter Cyber Terrorism Industry Volume K Unit Forecast, by End-user Industry 2019 & 2032
- Table 151: Global Counter Cyber Terrorism Industry Revenue Million Forecast, by Country 2019 & 2032
- Table 152: Global Counter Cyber Terrorism Industry Volume K Unit Forecast, by Country 2019 & 2032
- Table 153: UAE Counter Cyber Terrorism Industry Revenue (Million) Forecast, by Application 2019 & 2032
- Table 154: UAE Counter Cyber Terrorism Industry Volume (K Unit) Forecast, by Application 2019 & 2032
- Table 155: South Africa Counter Cyber Terrorism Industry Revenue (Million) Forecast, by Application 2019 & 2032
- Table 156: South Africa Counter Cyber Terrorism Industry Volume (K Unit) Forecast, by Application 2019 & 2032
- Table 157: Saudi Arabia Counter Cyber Terrorism Industry Revenue (Million) Forecast, by Application 2019 & 2032
- Table 158: Saudi Arabia Counter Cyber Terrorism Industry Volume (K Unit) Forecast, by Application 2019 & 2032
- Table 159: Rest Of MEA Counter Cyber Terrorism Industry Revenue (Million) Forecast, by Application 2019 & 2032
- Table 160: Rest Of MEA Counter Cyber Terrorism Industry Volume (K Unit) Forecast, by Application 2019 & 2032
Frequently Asked Questions
1. What is the projected Compound Annual Growth Rate (CAGR) of the Counter Cyber Terrorism Industry?
The projected CAGR is approximately 3.26%.
2. Which companies are prominent players in the Counter Cyber Terrorism Industry?
Key companies in the market include IBM Corporation, SAP SE, Raytheon Company, Leidos, Dell Inc, Palo Alto Networks, DXC Technology Company, Nexusguard Limited, International Intelligence Limited, Symantec Corporation, Cisco Systems, AO Kaspersky Lab.
3. What are the main segments of the Counter Cyber Terrorism Industry?
The market segments include End-user Industry.
4. Can you provide details about the market size?
The market size is estimated to be USD 32.80 Million as of 2022.
5. What are some drivers contributing to market growth?
Increasing Concerns Regarding National Security; Increasing Government Initiatives to Secure Critical Data.
6. What are the notable trends driving market growth?
Growing Severity of Cyberattacks to Drive the Market.
7. Are there any restraints impacting market growth?
Lack of Cyber Warfare Professionals.
8. Can you provide examples of recent developments in the market?
April 2023: New cyber security measures will increase the UK’s cyber resilience and guard the UK government’s essential IT operations against ever-growing threats. Under the new rules, all central government units will have their cyber health examined annually through new, more robust criteria known as GovAssure. The Cabinet Office’s Government Security Group (GSG) will run the latest cyber security scheme, with input from the National Cyber Security Centre (NCSC).
9. What pricing options are available for accessing the report?
Pricing options include single-user, multi-user, and enterprise licenses priced at USD 4750, USD 5250, and USD 8750 respectively.
10. Is the market size provided in terms of value or volume?
The market size is provided in terms of value, measured in Million and volume, measured in K Unit.
11. Are there any specific market keywords associated with the report?
Yes, the market keyword associated with the report is "Counter Cyber Terrorism Industry," which aids in identifying and referencing the specific market segment covered.
12. How do I determine which pricing option suits my needs best?
The pricing options vary based on user requirements and access needs. Individual users may opt for single-user licenses, while businesses requiring broader access may choose multi-user or enterprise licenses for cost-effective access to the report.
13. Are there any additional resources or data provided in the Counter Cyber Terrorism Industry report?
While the report offers comprehensive insights, it's advisable to review the specific contents or supplementary materials provided to ascertain if additional resources or data are available.
14. How can I stay updated on further developments or reports in the Counter Cyber Terrorism Industry?
To stay informed about further developments, trends, and reports in the Counter Cyber Terrorism Industry, consider subscribing to industry newsletters, following relevant companies and organizations, or regularly checking reputable industry news sources and publications.
Methodology
Step 1 - Identification of Relevant Samples Size from Population Database


Step 2 - Approaches for Defining Global Market Size (Value, Volume* & Price*)

Note*: In applicable scenarios
Step 3 - Data Sources
Primary Research
- Web Analytics
- Survey Reports
- Research Institute
- Latest Research Reports
- Opinion Leaders
Secondary Research
- Annual Reports
- White Paper
- Latest Press Release
- Industry Association
- Paid Database
- Investor Presentations

Step 4 - Data Triangulation
Involves using different sources of information in order to increase the validity of a study
These sources are likely to be stakeholders in a program - participants, other researchers, program staff, other community members, and so on.
Then we put all data in single framework & apply various statistical tools to find out the dynamic on the market.
During the analysis stage, feedback from the stakeholder groups would be compared to determine areas of agreement as well as areas of divergence
