

Key Insights
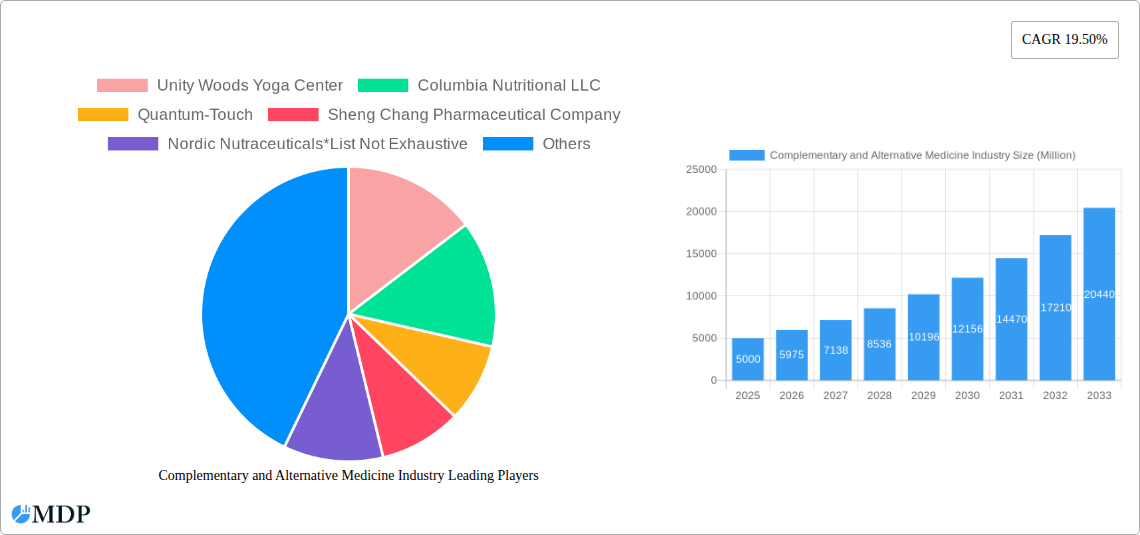
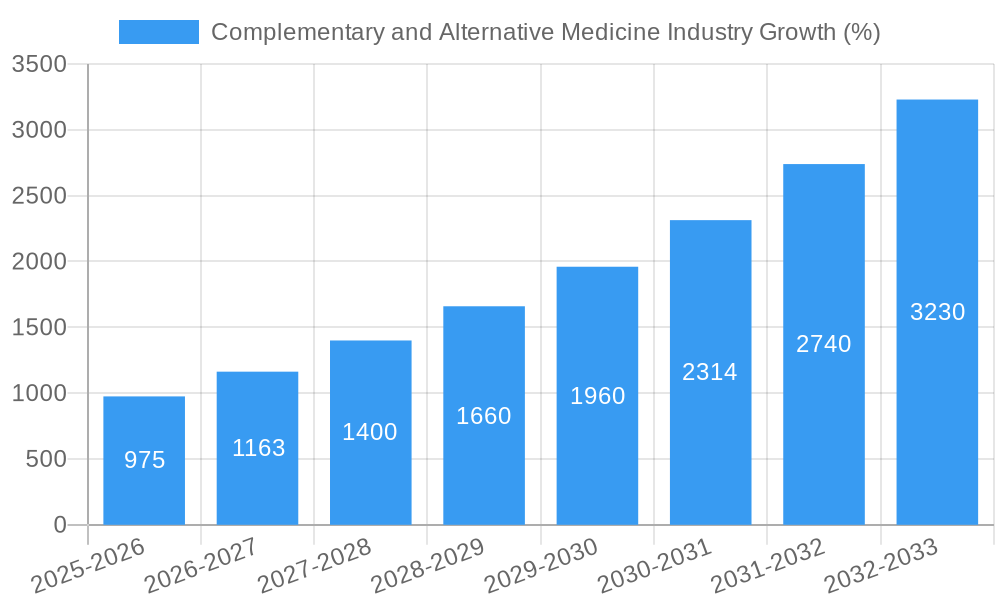
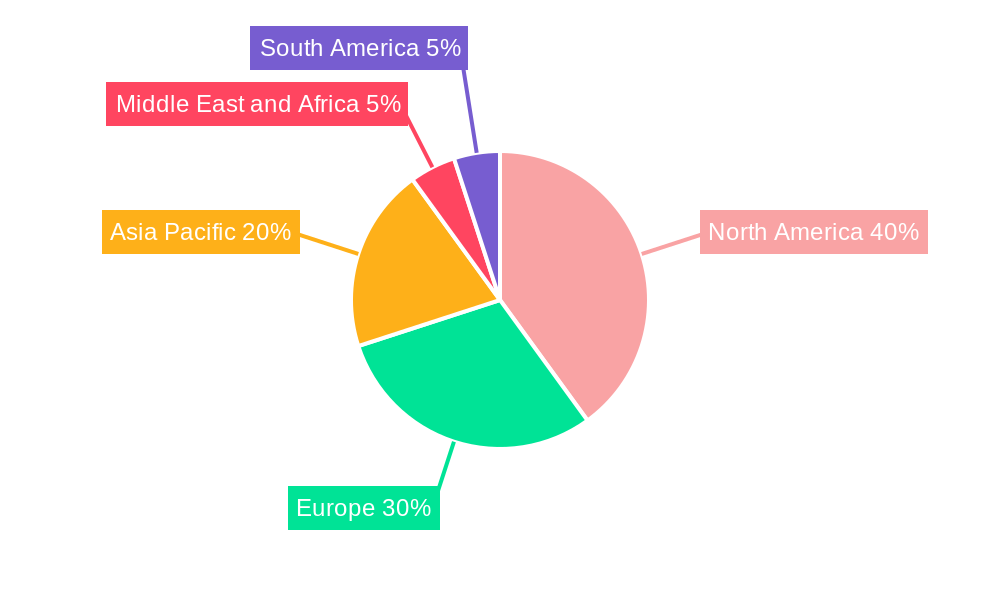
The Complementary and Alternative Medicine (CAM) industry is experiencing robust growth, projected to reach a substantial market size by 2033. A compound annual growth rate (CAGR) of 19.50% from 2025 to 2033 indicates significant expansion, driven by several key factors. Increasing prevalence of chronic diseases like arthritis, cancer, and diabetes, coupled with dissatisfaction with conventional treatments and a rising preference for holistic wellness approaches, fuels market expansion. The growing popularity of yoga, mindfulness practices, and various body therapies contributes significantly to this trend. The market is segmented by application (arthritis, cancer, diabetes, cardiovascular, neurology, and others), distribution channel (direct sales, online sales, distance correspondence), and type (traditional alternative therapeutics, body therapy, mind therapy, sensory therapy, and others). North America and Europe currently dominate the market, but the Asia-Pacific region is expected to witness significant growth due to increasing awareness and adoption of CAM practices, particularly in countries like China and India. While the industry faces certain restraints, such as regulatory hurdles and varying levels of scientific evidence supporting certain therapies, the overall growth trajectory remains positive.
The diverse range of CAM therapies caters to a broad spectrum of needs and preferences. The incorporation of digital platforms for online sales and distance correspondence is expanding market reach and accessibility. The rise of personalized medicine and integration of CAM with conventional treatments also presents significant opportunities for growth. Leading companies are focusing on research and development to enhance the efficacy and safety of their offerings. This includes developing standardized protocols, improving quality control, and promoting evidence-based practices to gain wider acceptance and integration within the mainstream healthcare system. The future of the CAM market points towards greater integration with conventional medicine, leading to a more holistic and patient-centered approach to healthcare. This holistic approach, coupled with continued technological advancements and increasing consumer awareness, positions the CAM market for continued, substantial growth in the coming years.
Complementary and Alternative Medicine (CAM) Industry Market Report: 2019-2033
A comprehensive analysis of the $XX Million CAM market, providing actionable insights for stakeholders. This report offers a detailed examination of the Complementary and Alternative Medicine industry, covering market dynamics, leading players, emerging trends, and future growth projections from 2019 to 2033. With a focus on key segments – including Traditional Alternative Therapeutics, Body Therapy, Mind Therapy, and Sensory Therapy – and distribution channels like Direct Sales and Online Sales, this report is essential for businesses, investors, and researchers seeking to understand and capitalize on this rapidly expanding market.
Complementary and Alternative Medicine Industry Market Dynamics & Concentration
The Complementary and Alternative Medicine (CAM) industry, valued at $XX Million in 2025, is characterized by a moderately fragmented market structure. While a few large players exist, numerous smaller businesses and independent practitioners contribute significantly to the overall market size. Market concentration is expected to increase slightly over the forecast period (2025-2033) due to mergers and acquisitions (M&A) activity and the consolidation of larger players. Innovation within the CAM sector is driven by ongoing research into the efficacy of various therapies, coupled with the increasing demand for holistic and personalized healthcare solutions. Regulatory frameworks vary significantly across different regions and countries, creating both opportunities and challenges for businesses operating in this space. Product substitutes, such as conventional pharmaceuticals, pose a competitive threat, particularly for certain CAM therapies. Consumer trends are shifting towards preventative healthcare, wellness, and self-care, driving demand for CAM products and services.
Key Metrics:
- Market Share: The top 5 players hold an estimated XX% market share in 2025.
- M&A Deal Counts: An estimated XX M&A deals occurred in the CAM sector between 2019 and 2024.
Complementary and Alternative Medicine Industry Industry Trends & Analysis
The CAM market is experiencing robust growth, driven primarily by increasing consumer awareness of the benefits of holistic healthcare, rising prevalence of chronic diseases, and a growing dissatisfaction with conventional medical approaches. Technological advancements, such as telehealth and digital health platforms, are expanding market accessibility and creating new avenues for service delivery. Consumer preferences are shifting towards personalized and integrated healthcare solutions, driving demand for customized CAM therapies. The competitive landscape is dynamic, with both established players and new entrants vying for market share.
- CAGR: The CAM market is projected to register a CAGR of XX% during the forecast period (2025-2033).
- Market Penetration: Market penetration of CAM therapies is expected to increase from XX% in 2025 to XX% by 2033.
Leading Markets & Segments in Complementary and Alternative Medicine Industry
The North American region currently dominates the global CAM market, driven by factors such as high disposable incomes, increased awareness of alternative therapies, and a supportive regulatory environment. Within the market segments, Arthritis and Cancer applications represent the largest segments by application, reflecting a significant need for pain management and supportive care in these conditions. Online sales are rapidly gaining traction, surpassing Direct Sales as the preferred distribution channel for many CAM products. Traditional Alternative Therapeutics and Body Therapy are currently the most significant segments by type.
Key Drivers:
- North America: Strong consumer demand, high healthcare expenditure, and established regulatory frameworks.
- Arthritis & Cancer Applications: High prevalence of these conditions, leading to significant demand for pain relief and complementary treatments.
- Online Sales: Growing preference for convenience, accessibility, and wider product availability.
- Traditional Alternative Therapeutics & Body Therapy: Well-established practices with a significant consumer base.
Complementary and Alternative Medicine Industry Product Developments
Recent product innovations focus on integrating technology into existing therapies and developing more convenient and personalized CAM solutions. For instance, the incorporation of AI-powered diagnostic tools in traditional Chinese medicine is enhancing treatment accuracy and accessibility. The market is also witnessing the rise of hybrid products and services that combine aspects of conventional and alternative medicine approaches to provide comprehensive patient care.
Key Drivers of Complementary and Alternative Medicine Industry Growth
The CAM industry's growth is propelled by several factors:
- Rising prevalence of chronic diseases: Increased demand for complementary treatment options.
- Growing consumer interest in preventative health and wellness: Proactive healthcare spending.
- Technological advancements: Improved access and personalized treatments.
- Favorable regulatory environments (in some regions): Supporting innovation and market expansion.
Challenges in the Complementary and Alternative Medicine Industry Market
The CAM industry faces several challenges:
- Regulatory uncertainties: Varying regulations across different jurisdictions and inconsistent standards.
- Lack of robust clinical evidence: Concerns about the efficacy of some CAM therapies.
- High competition: From both established players and new entrants.
- Supply chain disruptions: Impacting the availability and cost of raw materials and finished products.
Emerging Opportunities in Complementary and Alternative Medicine Industry
The future of the CAM market looks promising. Technological advancements such as AI-driven diagnostics and personalized treatment plans present substantial opportunities. Strategic partnerships between CAM practitioners and conventional healthcare providers are emerging, creating integrated care models. Expansion into new geographic markets with growing demand for CAM services also presents substantial potential for growth.
Leading Players in the Complementary and Alternative Medicine Industry Sector
- Unity Woods Yoga Center
- Columbia Nutritional LLC
- Quantum-Touch
- Sheng Chang Pharmaceutical Company
- Nordic Nutraceuticals
- Ramamani Iyengar Memorial Yoga Institute
- Pure encapsulations LLC
- Herb Pharm
- Yoga Tree Studios Inc
- John Schumacher Unity Woods Yoga Centre
- Healing Company Ltd
- Ayush Ayurvedic Pte Ltd
Key Milestones in Complementary and Alternative Medicine Industry Industry
- December 2022: Adoratherapy launched its Alkemie Chakra Healing collection, expanding the aromatherapy product market and introducing a new line of scented products.
- October 2022: Coworth Park launched a Hebridean sound treatment, showcasing the growth of sound therapy within the wellness sector.
Strategic Outlook for Complementary and Alternative Medicine Industry Market
The CAM market is poised for continued expansion, driven by increasing consumer demand for holistic healthcare solutions, technological advancements, and favorable regulatory developments in key markets. Strategic opportunities include investing in research and development to enhance the efficacy and safety of CAM therapies, expanding distribution channels to reach new customer segments, and forging strategic alliances to create integrated care models. The future of CAM lies in innovation, personalization, and integration with conventional medicine.
Complementary and Alternative Medicine Industry Segmentation
-
1. Type
- 1.1. Traditional Alternative Therapeutics
- 1.2. Body Therapy
- 1.3. Mind Therapy
- 1.4. Sensory Therapy
- 1.5. Other Types
-
2. Application
- 2.1. Arthritis
- 2.2. Cancer
- 2.3. Diabetes
- 2.4. Cardiovascular
- 2.5. Neurlogy
- 2.6. Other Applications
-
3. Distribution Channel
- 3.1. Direct Sales
- 3.2. Online Sales
- 3.3. Distance Correspondance
Complementary and Alternative Medicine Industry Segmentation By Geography
-
1. North America
- 1.1. United States
- 1.2. Canada
- 1.3. Mexico
-
2. Europe
- 2.1. Germany
- 2.2. United Kingdom
- 2.3. France
- 2.4. Italy
- 2.5. Spain
- 2.6. Rest of Europe
-
3. Asia Pacific
- 3.1. China
- 3.2. Japan
- 3.3. India
- 3.4. Australia
- 3.5. South Korea
- 3.6. Rest of Asia Pacific
-
4. Middle East and Africa
- 4.1. GCC
- 4.2. South Africa
- 4.3. Rest of Middle East and Africa
-
5. South America
- 5.1. Brazil
- 5.2. Argentina
- 5.3. Rest of South America
Complementary and Alternative Medicine Industry REPORT HIGHLIGHTS
| Aspects | Details |
|---|---|
| Study Period | 2019-2033 |
| Base Year | 2024 |
| Estimated Year | 2025 |
| Forecast Period | 2025-2033 |
| Historical Period | 2019-2024 |
| Growth Rate | CAGR of 19.50% from 2019-2033 |
| Segmentation |
|
Table of Contents
- 1. Introduction
- 1.1. Research Scope
- 1.2. Market Segmentation
- 1.3. Research Methodology
- 1.4. Definitions and Assumptions
- 2. Executive Summary
- 2.1. Introduction
- 3. Market Dynamics
- 3.1. Introduction
- 3.2. Market Drivers
- 3.2.1. Increasing Awareness About the Benefits of Complementary and Alternative Medicines; Growing Government Initiative and Growing Acceptance
- 3.3. Market Restrains
- 3.3.1. Lack of Proper Scientific Evidence and Less Understanding About Alternative Medicine
- 3.4. Market Trends
- 3.4.1. Cancer Is Expected to Hold a Significant Share Over the Forecast Period
- 4. Market Factor Analysis
- 4.1. Porters Five Forces
- 4.2. Supply/Value Chain
- 4.3. PESTEL analysis
- 4.4. Market Entropy
- 4.5. Patent/Trademark Analysis
- 5. Global Complementary and Alternative Medicine Industry Analysis, Insights and Forecast, 2019-2031
- 5.1. Market Analysis, Insights and Forecast - by Type
- 5.1.1. Traditional Alternative Therapeutics
- 5.1.2. Body Therapy
- 5.1.3. Mind Therapy
- 5.1.4. Sensory Therapy
- 5.1.5. Other Types
- 5.2. Market Analysis, Insights and Forecast - by Application
- 5.2.1. Arthritis
- 5.2.2. Cancer
- 5.2.3. Diabetes
- 5.2.4. Cardiovascular
- 5.2.5. Neurlogy
- 5.2.6. Other Applications
- 5.3. Market Analysis, Insights and Forecast - by Distribution Channel
- 5.3.1. Direct Sales
- 5.3.2. Online Sales
- 5.3.3. Distance Correspondance
- 5.4. Market Analysis, Insights and Forecast - by Region
- 5.4.1. North America
- 5.4.2. Europe
- 5.4.3. Asia Pacific
- 5.4.4. Middle East and Africa
- 5.4.5. South America
- 5.1. Market Analysis, Insights and Forecast - by Type
- 6. North America Complementary and Alternative Medicine Industry Analysis, Insights and Forecast, 2019-2031
- 6.1. Market Analysis, Insights and Forecast - by Type
- 6.1.1. Traditional Alternative Therapeutics
- 6.1.2. Body Therapy
- 6.1.3. Mind Therapy
- 6.1.4. Sensory Therapy
- 6.1.5. Other Types
- 6.2. Market Analysis, Insights and Forecast - by Application
- 6.2.1. Arthritis
- 6.2.2. Cancer
- 6.2.3. Diabetes
- 6.2.4. Cardiovascular
- 6.2.5. Neurlogy
- 6.2.6. Other Applications
- 6.3. Market Analysis, Insights and Forecast - by Distribution Channel
- 6.3.1. Direct Sales
- 6.3.2. Online Sales
- 6.3.3. Distance Correspondance
- 6.1. Market Analysis, Insights and Forecast - by Type
- 7. Europe Complementary and Alternative Medicine Industry Analysis, Insights and Forecast, 2019-2031
- 7.1. Market Analysis, Insights and Forecast - by Type
- 7.1.1. Traditional Alternative Therapeutics
- 7.1.2. Body Therapy
- 7.1.3. Mind Therapy
- 7.1.4. Sensory Therapy
- 7.1.5. Other Types
- 7.2. Market Analysis, Insights and Forecast - by Application
- 7.2.1. Arthritis
- 7.2.2. Cancer
- 7.2.3. Diabetes
- 7.2.4. Cardiovascular
- 7.2.5. Neurlogy
- 7.2.6. Other Applications
- 7.3. Market Analysis, Insights and Forecast - by Distribution Channel
- 7.3.1. Direct Sales
- 7.3.2. Online Sales
- 7.3.3. Distance Correspondance
- 7.1. Market Analysis, Insights and Forecast - by Type
- 8. Asia Pacific Complementary and Alternative Medicine Industry Analysis, Insights and Forecast, 2019-2031
- 8.1. Market Analysis, Insights and Forecast - by Type
- 8.1.1. Traditional Alternative Therapeutics
- 8.1.2. Body Therapy
- 8.1.3. Mind Therapy
- 8.1.4. Sensory Therapy
- 8.1.5. Other Types
- 8.2. Market Analysis, Insights and Forecast - by Application
- 8.2.1. Arthritis
- 8.2.2. Cancer
- 8.2.3. Diabetes
- 8.2.4. Cardiovascular
- 8.2.5. Neurlogy
- 8.2.6. Other Applications
- 8.3. Market Analysis, Insights and Forecast - by Distribution Channel
- 8.3.1. Direct Sales
- 8.3.2. Online Sales
- 8.3.3. Distance Correspondance
- 8.1. Market Analysis, Insights and Forecast - by Type
- 9. Middle East and Africa Complementary and Alternative Medicine Industry Analysis, Insights and Forecast, 2019-2031
- 9.1. Market Analysis, Insights and Forecast - by Type
- 9.1.1. Traditional Alternative Therapeutics
- 9.1.2. Body Therapy
- 9.1.3. Mind Therapy
- 9.1.4. Sensory Therapy
- 9.1.5. Other Types
- 9.2. Market Analysis, Insights and Forecast - by Application
- 9.2.1. Arthritis
- 9.2.2. Cancer
- 9.2.3. Diabetes
- 9.2.4. Cardiovascular
- 9.2.5. Neurlogy
- 9.2.6. Other Applications
- 9.3. Market Analysis, Insights and Forecast - by Distribution Channel
- 9.3.1. Direct Sales
- 9.3.2. Online Sales
- 9.3.3. Distance Correspondance
- 9.1. Market Analysis, Insights and Forecast - by Type
- 10. South America Complementary and Alternative Medicine Industry Analysis, Insights and Forecast, 2019-2031
- 10.1. Market Analysis, Insights and Forecast - by Type
- 10.1.1. Traditional Alternative Therapeutics
- 10.1.2. Body Therapy
- 10.1.3. Mind Therapy
- 10.1.4. Sensory Therapy
- 10.1.5. Other Types
- 10.2. Market Analysis, Insights and Forecast - by Application
- 10.2.1. Arthritis
- 10.2.2. Cancer
- 10.2.3. Diabetes
- 10.2.4. Cardiovascular
- 10.2.5. Neurlogy
- 10.2.6. Other Applications
- 10.3. Market Analysis, Insights and Forecast - by Distribution Channel
- 10.3.1. Direct Sales
- 10.3.2. Online Sales
- 10.3.3. Distance Correspondance
- 10.1. Market Analysis, Insights and Forecast - by Type
- 11. North America Complementary and Alternative Medicine Industry Analysis, Insights and Forecast, 2019-2031
- 11.1. Market Analysis, Insights and Forecast - By Country/Sub-region
- 11.1.1 United States
- 11.1.2 Canada
- 11.1.3 Mexico
- 12. Europe Complementary and Alternative Medicine Industry Analysis, Insights and Forecast, 2019-2031
- 12.1. Market Analysis, Insights and Forecast - By Country/Sub-region
- 12.1.1 Germany
- 12.1.2 United Kingdom
- 12.1.3 France
- 12.1.4 Italy
- 12.1.5 Spain
- 12.1.6 Rest of Europe
- 13. Asia Pacific Complementary and Alternative Medicine Industry Analysis, Insights and Forecast, 2019-2031
- 13.1. Market Analysis, Insights and Forecast - By Country/Sub-region
- 13.1.1 China
- 13.1.2 Japan
- 13.1.3 India
- 13.1.4 Australia
- 13.1.5 South Korea
- 13.1.6 Rest of Asia Pacific
- 14. Middle East and Africa Complementary and Alternative Medicine Industry Analysis, Insights and Forecast, 2019-2031
- 14.1. Market Analysis, Insights and Forecast - By Country/Sub-region
- 14.1.1 GCC
- 14.1.2 South Africa
- 14.1.3 Rest of Middle East and Africa
- 15. South America Complementary and Alternative Medicine Industry Analysis, Insights and Forecast, 2019-2031
- 15.1. Market Analysis, Insights and Forecast - By Country/Sub-region
- 15.1.1 Brazil
- 15.1.2 Argentina
- 15.1.3 Rest of South America
- 16. Competitive Analysis
- 16.1. Global Market Share Analysis 2024
- 16.2. Company Profiles
- 16.2.1 Unity Woods Yoga Center
- 16.2.1.1. Overview
- 16.2.1.2. Products
- 16.2.1.3. SWOT Analysis
- 16.2.1.4. Recent Developments
- 16.2.1.5. Financials (Based on Availability)
- 16.2.2 Columbia Nutritional LLC
- 16.2.2.1. Overview
- 16.2.2.2. Products
- 16.2.2.3. SWOT Analysis
- 16.2.2.4. Recent Developments
- 16.2.2.5. Financials (Based on Availability)
- 16.2.3 Quantum-Touch
- 16.2.3.1. Overview
- 16.2.3.2. Products
- 16.2.3.3. SWOT Analysis
- 16.2.3.4. Recent Developments
- 16.2.3.5. Financials (Based on Availability)
- 16.2.4 Sheng Chang Pharmaceutical Company
- 16.2.4.1. Overview
- 16.2.4.2. Products
- 16.2.4.3. SWOT Analysis
- 16.2.4.4. Recent Developments
- 16.2.4.5. Financials (Based on Availability)
- 16.2.5 Nordic Nutraceuticals*List Not Exhaustive
- 16.2.5.1. Overview
- 16.2.5.2. Products
- 16.2.5.3. SWOT Analysis
- 16.2.5.4. Recent Developments
- 16.2.5.5. Financials (Based on Availability)
- 16.2.6 Ramamani Iyengar Memorial Yoga Institute
- 16.2.6.1. Overview
- 16.2.6.2. Products
- 16.2.6.3. SWOT Analysis
- 16.2.6.4. Recent Developments
- 16.2.6.5. Financials (Based on Availability)
- 16.2.7 Pure encapsulations LLC
- 16.2.7.1. Overview
- 16.2.7.2. Products
- 16.2.7.3. SWOT Analysis
- 16.2.7.4. Recent Developments
- 16.2.7.5. Financials (Based on Availability)
- 16.2.8 Herb Pharm
- 16.2.8.1. Overview
- 16.2.8.2. Products
- 16.2.8.3. SWOT Analysis
- 16.2.8.4. Recent Developments
- 16.2.8.5. Financials (Based on Availability)
- 16.2.9 Yoga Tree Studios Inc
- 16.2.9.1. Overview
- 16.2.9.2. Products
- 16.2.9.3. SWOT Analysis
- 16.2.9.4. Recent Developments
- 16.2.9.5. Financials (Based on Availability)
- 16.2.10 John Schumacher Unity Woods Yoga Centre
- 16.2.10.1. Overview
- 16.2.10.2. Products
- 16.2.10.3. SWOT Analysis
- 16.2.10.4. Recent Developments
- 16.2.10.5. Financials (Based on Availability)
- 16.2.11 Healing Company Ltd
- 16.2.11.1. Overview
- 16.2.11.2. Products
- 16.2.11.3. SWOT Analysis
- 16.2.11.4. Recent Developments
- 16.2.11.5. Financials (Based on Availability)
- 16.2.12 Ayush Ayurvedic Pte Ltd
- 16.2.12.1. Overview
- 16.2.12.2. Products
- 16.2.12.3. SWOT Analysis
- 16.2.12.4. Recent Developments
- 16.2.12.5. Financials (Based on Availability)
- 16.2.1 Unity Woods Yoga Center
List of Figures
- Figure 1: Global Complementary and Alternative Medicine Industry Revenue Breakdown (Million, %) by Region 2024 & 2032
- Figure 2: North America Complementary and Alternative Medicine Industry Revenue (Million), by Country 2024 & 2032
- Figure 3: North America Complementary and Alternative Medicine Industry Revenue Share (%), by Country 2024 & 2032
- Figure 4: Europe Complementary and Alternative Medicine Industry Revenue (Million), by Country 2024 & 2032
- Figure 5: Europe Complementary and Alternative Medicine Industry Revenue Share (%), by Country 2024 & 2032
- Figure 6: Asia Pacific Complementary and Alternative Medicine Industry Revenue (Million), by Country 2024 & 2032
- Figure 7: Asia Pacific Complementary and Alternative Medicine Industry Revenue Share (%), by Country 2024 & 2032
- Figure 8: Middle East and Africa Complementary and Alternative Medicine Industry Revenue (Million), by Country 2024 & 2032
- Figure 9: Middle East and Africa Complementary and Alternative Medicine Industry Revenue Share (%), by Country 2024 & 2032
- Figure 10: South America Complementary and Alternative Medicine Industry Revenue (Million), by Country 2024 & 2032
- Figure 11: South America Complementary and Alternative Medicine Industry Revenue Share (%), by Country 2024 & 2032
- Figure 12: North America Complementary and Alternative Medicine Industry Revenue (Million), by Type 2024 & 2032
- Figure 13: North America Complementary and Alternative Medicine Industry Revenue Share (%), by Type 2024 & 2032
- Figure 14: North America Complementary and Alternative Medicine Industry Revenue (Million), by Application 2024 & 2032
- Figure 15: North America Complementary and Alternative Medicine Industry Revenue Share (%), by Application 2024 & 2032
- Figure 16: North America Complementary and Alternative Medicine Industry Revenue (Million), by Distribution Channel 2024 & 2032
- Figure 17: North America Complementary and Alternative Medicine Industry Revenue Share (%), by Distribution Channel 2024 & 2032
- Figure 18: North America Complementary and Alternative Medicine Industry Revenue (Million), by Country 2024 & 2032
- Figure 19: North America Complementary and Alternative Medicine Industry Revenue Share (%), by Country 2024 & 2032
- Figure 20: Europe Complementary and Alternative Medicine Industry Revenue (Million), by Type 2024 & 2032
- Figure 21: Europe Complementary and Alternative Medicine Industry Revenue Share (%), by Type 2024 & 2032
- Figure 22: Europe Complementary and Alternative Medicine Industry Revenue (Million), by Application 2024 & 2032
- Figure 23: Europe Complementary and Alternative Medicine Industry Revenue Share (%), by Application 2024 & 2032
- Figure 24: Europe Complementary and Alternative Medicine Industry Revenue (Million), by Distribution Channel 2024 & 2032
- Figure 25: Europe Complementary and Alternative Medicine Industry Revenue Share (%), by Distribution Channel 2024 & 2032
- Figure 26: Europe Complementary and Alternative Medicine Industry Revenue (Million), by Country 2024 & 2032
- Figure 27: Europe Complementary and Alternative Medicine Industry Revenue Share (%), by Country 2024 & 2032
- Figure 28: Asia Pacific Complementary and Alternative Medicine Industry Revenue (Million), by Type 2024 & 2032
- Figure 29: Asia Pacific Complementary and Alternative Medicine Industry Revenue Share (%), by Type 2024 & 2032
- Figure 30: Asia Pacific Complementary and Alternative Medicine Industry Revenue (Million), by Application 2024 & 2032
- Figure 31: Asia Pacific Complementary and Alternative Medicine Industry Revenue Share (%), by Application 2024 & 2032
- Figure 32: Asia Pacific Complementary and Alternative Medicine Industry Revenue (Million), by Distribution Channel 2024 & 2032
- Figure 33: Asia Pacific Complementary and Alternative Medicine Industry Revenue Share (%), by Distribution Channel 2024 & 2032
- Figure 34: Asia Pacific Complementary and Alternative Medicine Industry Revenue (Million), by Country 2024 & 2032
- Figure 35: Asia Pacific Complementary and Alternative Medicine Industry Revenue Share (%), by Country 2024 & 2032
- Figure 36: Middle East and Africa Complementary and Alternative Medicine Industry Revenue (Million), by Type 2024 & 2032
- Figure 37: Middle East and Africa Complementary and Alternative Medicine Industry Revenue Share (%), by Type 2024 & 2032
- Figure 38: Middle East and Africa Complementary and Alternative Medicine Industry Revenue (Million), by Application 2024 & 2032
- Figure 39: Middle East and Africa Complementary and Alternative Medicine Industry Revenue Share (%), by Application 2024 & 2032
- Figure 40: Middle East and Africa Complementary and Alternative Medicine Industry Revenue (Million), by Distribution Channel 2024 & 2032
- Figure 41: Middle East and Africa Complementary and Alternative Medicine Industry Revenue Share (%), by Distribution Channel 2024 & 2032
- Figure 42: Middle East and Africa Complementary and Alternative Medicine Industry Revenue (Million), by Country 2024 & 2032
- Figure 43: Middle East and Africa Complementary and Alternative Medicine Industry Revenue Share (%), by Country 2024 & 2032
- Figure 44: South America Complementary and Alternative Medicine Industry Revenue (Million), by Type 2024 & 2032
- Figure 45: South America Complementary and Alternative Medicine Industry Revenue Share (%), by Type 2024 & 2032
- Figure 46: South America Complementary and Alternative Medicine Industry Revenue (Million), by Application 2024 & 2032
- Figure 47: South America Complementary and Alternative Medicine Industry Revenue Share (%), by Application 2024 & 2032
- Figure 48: South America Complementary and Alternative Medicine Industry Revenue (Million), by Distribution Channel 2024 & 2032
- Figure 49: South America Complementary and Alternative Medicine Industry Revenue Share (%), by Distribution Channel 2024 & 2032
- Figure 50: South America Complementary and Alternative Medicine Industry Revenue (Million), by Country 2024 & 2032
- Figure 51: South America Complementary and Alternative Medicine Industry Revenue Share (%), by Country 2024 & 2032
List of Tables
- Table 1: Global Complementary and Alternative Medicine Industry Revenue Million Forecast, by Region 2019 & 2032
- Table 2: Global Complementary and Alternative Medicine Industry Revenue Million Forecast, by Type 2019 & 2032
- Table 3: Global Complementary and Alternative Medicine Industry Revenue Million Forecast, by Application 2019 & 2032
- Table 4: Global Complementary and Alternative Medicine Industry Revenue Million Forecast, by Distribution Channel 2019 & 2032
- Table 5: Global Complementary and Alternative Medicine Industry Revenue Million Forecast, by Region 2019 & 2032
- Table 6: Global Complementary and Alternative Medicine Industry Revenue Million Forecast, by Country 2019 & 2032
- Table 7: United States Complementary and Alternative Medicine Industry Revenue (Million) Forecast, by Application 2019 & 2032
- Table 8: Canada Complementary and Alternative Medicine Industry Revenue (Million) Forecast, by Application 2019 & 2032
- Table 9: Mexico Complementary and Alternative Medicine Industry Revenue (Million) Forecast, by Application 2019 & 2032
- Table 10: Global Complementary and Alternative Medicine Industry Revenue Million Forecast, by Country 2019 & 2032
- Table 11: Germany Complementary and Alternative Medicine Industry Revenue (Million) Forecast, by Application 2019 & 2032
- Table 12: United Kingdom Complementary and Alternative Medicine Industry Revenue (Million) Forecast, by Application 2019 & 2032
- Table 13: France Complementary and Alternative Medicine Industry Revenue (Million) Forecast, by Application 2019 & 2032
- Table 14: Italy Complementary and Alternative Medicine Industry Revenue (Million) Forecast, by Application 2019 & 2032
- Table 15: Spain Complementary and Alternative Medicine Industry Revenue (Million) Forecast, by Application 2019 & 2032
- Table 16: Rest of Europe Complementary and Alternative Medicine Industry Revenue (Million) Forecast, by Application 2019 & 2032
- Table 17: Global Complementary and Alternative Medicine Industry Revenue Million Forecast, by Country 2019 & 2032
- Table 18: China Complementary and Alternative Medicine Industry Revenue (Million) Forecast, by Application 2019 & 2032
- Table 19: Japan Complementary and Alternative Medicine Industry Revenue (Million) Forecast, by Application 2019 & 2032
- Table 20: India Complementary and Alternative Medicine Industry Revenue (Million) Forecast, by Application 2019 & 2032
- Table 21: Australia Complementary and Alternative Medicine Industry Revenue (Million) Forecast, by Application 2019 & 2032
- Table 22: South Korea Complementary and Alternative Medicine Industry Revenue (Million) Forecast, by Application 2019 & 2032
- Table 23: Rest of Asia Pacific Complementary and Alternative Medicine Industry Revenue (Million) Forecast, by Application 2019 & 2032
- Table 24: Global Complementary and Alternative Medicine Industry Revenue Million Forecast, by Country 2019 & 2032
- Table 25: GCC Complementary and Alternative Medicine Industry Revenue (Million) Forecast, by Application 2019 & 2032
- Table 26: South Africa Complementary and Alternative Medicine Industry Revenue (Million) Forecast, by Application 2019 & 2032
- Table 27: Rest of Middle East and Africa Complementary and Alternative Medicine Industry Revenue (Million) Forecast, by Application 2019 & 2032
- Table 28: Global Complementary and Alternative Medicine Industry Revenue Million Forecast, by Country 2019 & 2032
- Table 29: Brazil Complementary and Alternative Medicine Industry Revenue (Million) Forecast, by Application 2019 & 2032
- Table 30: Argentina Complementary and Alternative Medicine Industry Revenue (Million) Forecast, by Application 2019 & 2032
- Table 31: Rest of South America Complementary and Alternative Medicine Industry Revenue (Million) Forecast, by Application 2019 & 2032
- Table 32: Global Complementary and Alternative Medicine Industry Revenue Million Forecast, by Type 2019 & 2032
- Table 33: Global Complementary and Alternative Medicine Industry Revenue Million Forecast, by Application 2019 & 2032
- Table 34: Global Complementary and Alternative Medicine Industry Revenue Million Forecast, by Distribution Channel 2019 & 2032
- Table 35: Global Complementary and Alternative Medicine Industry Revenue Million Forecast, by Country 2019 & 2032
- Table 36: United States Complementary and Alternative Medicine Industry Revenue (Million) Forecast, by Application 2019 & 2032
- Table 37: Canada Complementary and Alternative Medicine Industry Revenue (Million) Forecast, by Application 2019 & 2032
- Table 38: Mexico Complementary and Alternative Medicine Industry Revenue (Million) Forecast, by Application 2019 & 2032
- Table 39: Global Complementary and Alternative Medicine Industry Revenue Million Forecast, by Type 2019 & 2032
- Table 40: Global Complementary and Alternative Medicine Industry Revenue Million Forecast, by Application 2019 & 2032
- Table 41: Global Complementary and Alternative Medicine Industry Revenue Million Forecast, by Distribution Channel 2019 & 2032
- Table 42: Global Complementary and Alternative Medicine Industry Revenue Million Forecast, by Country 2019 & 2032
- Table 43: Germany Complementary and Alternative Medicine Industry Revenue (Million) Forecast, by Application 2019 & 2032
- Table 44: United Kingdom Complementary and Alternative Medicine Industry Revenue (Million) Forecast, by Application 2019 & 2032
- Table 45: France Complementary and Alternative Medicine Industry Revenue (Million) Forecast, by Application 2019 & 2032
- Table 46: Italy Complementary and Alternative Medicine Industry Revenue (Million) Forecast, by Application 2019 & 2032
- Table 47: Spain Complementary and Alternative Medicine Industry Revenue (Million) Forecast, by Application 2019 & 2032
- Table 48: Rest of Europe Complementary and Alternative Medicine Industry Revenue (Million) Forecast, by Application 2019 & 2032
- Table 49: Global Complementary and Alternative Medicine Industry Revenue Million Forecast, by Type 2019 & 2032
- Table 50: Global Complementary and Alternative Medicine Industry Revenue Million Forecast, by Application 2019 & 2032
- Table 51: Global Complementary and Alternative Medicine Industry Revenue Million Forecast, by Distribution Channel 2019 & 2032
- Table 52: Global Complementary and Alternative Medicine Industry Revenue Million Forecast, by Country 2019 & 2032
- Table 53: China Complementary and Alternative Medicine Industry Revenue (Million) Forecast, by Application 2019 & 2032
- Table 54: Japan Complementary and Alternative Medicine Industry Revenue (Million) Forecast, by Application 2019 & 2032
- Table 55: India Complementary and Alternative Medicine Industry Revenue (Million) Forecast, by Application 2019 & 2032
- Table 56: Australia Complementary and Alternative Medicine Industry Revenue (Million) Forecast, by Application 2019 & 2032
- Table 57: South Korea Complementary and Alternative Medicine Industry Revenue (Million) Forecast, by Application 2019 & 2032
- Table 58: Rest of Asia Pacific Complementary and Alternative Medicine Industry Revenue (Million) Forecast, by Application 2019 & 2032
- Table 59: Global Complementary and Alternative Medicine Industry Revenue Million Forecast, by Type 2019 & 2032
- Table 60: Global Complementary and Alternative Medicine Industry Revenue Million Forecast, by Application 2019 & 2032
- Table 61: Global Complementary and Alternative Medicine Industry Revenue Million Forecast, by Distribution Channel 2019 & 2032
- Table 62: Global Complementary and Alternative Medicine Industry Revenue Million Forecast, by Country 2019 & 2032
- Table 63: GCC Complementary and Alternative Medicine Industry Revenue (Million) Forecast, by Application 2019 & 2032
- Table 64: South Africa Complementary and Alternative Medicine Industry Revenue (Million) Forecast, by Application 2019 & 2032
- Table 65: Rest of Middle East and Africa Complementary and Alternative Medicine Industry Revenue (Million) Forecast, by Application 2019 & 2032
- Table 66: Global Complementary and Alternative Medicine Industry Revenue Million Forecast, by Type 2019 & 2032
- Table 67: Global Complementary and Alternative Medicine Industry Revenue Million Forecast, by Application 2019 & 2032
- Table 68: Global Complementary and Alternative Medicine Industry Revenue Million Forecast, by Distribution Channel 2019 & 2032
- Table 69: Global Complementary and Alternative Medicine Industry Revenue Million Forecast, by Country 2019 & 2032
- Table 70: Brazil Complementary and Alternative Medicine Industry Revenue (Million) Forecast, by Application 2019 & 2032
- Table 71: Argentina Complementary and Alternative Medicine Industry Revenue (Million) Forecast, by Application 2019 & 2032
- Table 72: Rest of South America Complementary and Alternative Medicine Industry Revenue (Million) Forecast, by Application 2019 & 2032
Frequently Asked Questions
1. What is the projected Compound Annual Growth Rate (CAGR) of the Complementary and Alternative Medicine Industry?
The projected CAGR is approximately 19.50%.
2. Which companies are prominent players in the Complementary and Alternative Medicine Industry?
Key companies in the market include Unity Woods Yoga Center, Columbia Nutritional LLC, Quantum-Touch, Sheng Chang Pharmaceutical Company, Nordic Nutraceuticals*List Not Exhaustive, Ramamani Iyengar Memorial Yoga Institute, Pure encapsulations LLC, Herb Pharm, Yoga Tree Studios Inc, John Schumacher Unity Woods Yoga Centre, Healing Company Ltd, Ayush Ayurvedic Pte Ltd.
3. What are the main segments of the Complementary and Alternative Medicine Industry?
The market segments include Type, Application, Distribution Channel.
4. Can you provide details about the market size?
The market size is estimated to be USD XX Million as of 2022.
5. What are some drivers contributing to market growth?
Increasing Awareness About the Benefits of Complementary and Alternative Medicines; Growing Government Initiative and Growing Acceptance.
6. What are the notable trends driving market growth?
Cancer Is Expected to Hold a Significant Share Over the Forecast Period.
7. Are there any restraints impacting market growth?
Lack of Proper Scientific Evidence and Less Understanding About Alternative Medicine.
8. Can you provide examples of recent developments in the market?
December 2022: Adoratherapy launched its Alkemie Chakra Healing collection, featuring aroma perfume sprays, dry touch body oils, body lotions, and lotion candles all with the same scents. The scents were formulated to balance and heal using aromatherapy principles, in which essential oils are active ingredients.
9. What pricing options are available for accessing the report?
Pricing options include single-user, multi-user, and enterprise licenses priced at USD 4750, USD 5250, and USD 8750 respectively.
10. Is the market size provided in terms of value or volume?
The market size is provided in terms of value, measured in Million.
11. Are there any specific market keywords associated with the report?
Yes, the market keyword associated with the report is "Complementary and Alternative Medicine Industry," which aids in identifying and referencing the specific market segment covered.
12. How do I determine which pricing option suits my needs best?
The pricing options vary based on user requirements and access needs. Individual users may opt for single-user licenses, while businesses requiring broader access may choose multi-user or enterprise licenses for cost-effective access to the report.
13. Are there any additional resources or data provided in the Complementary and Alternative Medicine Industry report?
While the report offers comprehensive insights, it's advisable to review the specific contents or supplementary materials provided to ascertain if additional resources or data are available.
14. How can I stay updated on further developments or reports in the Complementary and Alternative Medicine Industry?
To stay informed about further developments, trends, and reports in the Complementary and Alternative Medicine Industry, consider subscribing to industry newsletters, following relevant companies and organizations, or regularly checking reputable industry news sources and publications.
Methodology
Step 1 - Identification of Relevant Samples Size from Population Database


Step 2 - Approaches for Defining Global Market Size (Value, Volume* & Price*)

Note*: In applicable scenarios
Step 3 - Data Sources
Primary Research
- Web Analytics
- Survey Reports
- Research Institute
- Latest Research Reports
- Opinion Leaders
Secondary Research
- Annual Reports
- White Paper
- Latest Press Release
- Industry Association
- Paid Database
- Investor Presentations

Step 4 - Data Triangulation
Involves using different sources of information in order to increase the validity of a study
These sources are likely to be stakeholders in a program - participants, other researchers, program staff, other community members, and so on.
Then we put all data in single framework & apply various statistical tools to find out the dynamic on the market.
During the analysis stage, feedback from the stakeholder groups would be compared to determine areas of agreement as well as areas of divergence
