

Key Insights
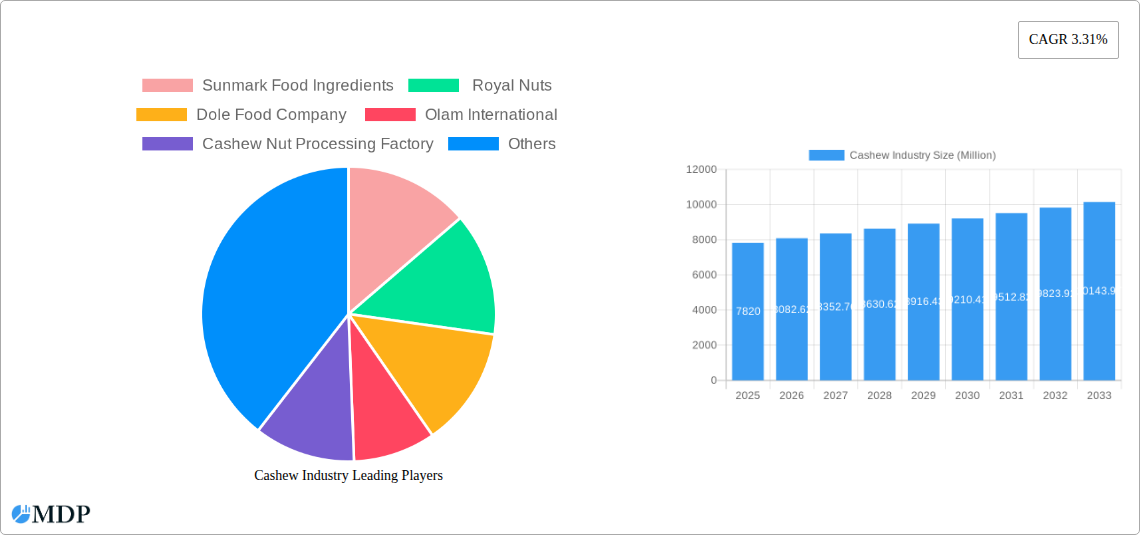
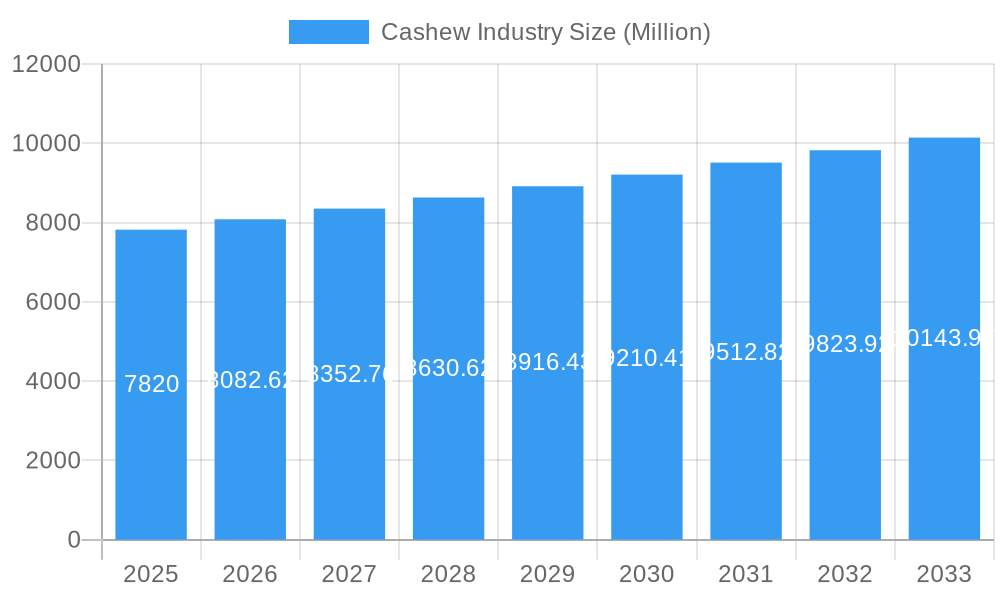
The global cashew industry, valued at $7.82 billion in 2025, is projected to experience steady growth, with a compound annual growth rate (CAGR) of 3.31% from 2025 to 2033. This expansion is fueled by several key drivers. Rising consumer demand for healthy snacks and the increasing popularity of plant-based diets are significantly boosting cashew consumption across various applications. The versatility of cashews, used in snacks, beverages, processed foods, dairy alternatives, and even meat substitutes, contributes to this broad appeal. Furthermore, innovation in cashew processing techniques, leading to a wider variety of products like roasted, salted, and flavored cashews, caters to evolving consumer preferences and expands market opportunities. The industry's segmentation, encompassing different grades (white wholes, scorched wholes, dessert wholes, and pieces) and processing methods (raw, roasted, salted, flavored), allows for targeted marketing and product differentiation, further fueling growth. However, challenges remain, including price volatility due to fluctuating supply and weather conditions impacting cashew harvests. Geopolitical factors and logistical challenges can also disrupt the supply chain. Despite these restraints, the long-term outlook remains positive, particularly in regions like Asia-Pacific and North America, which exhibit strong growth potential due to rising disposable incomes and increasing awareness of health and wellness.
Cashew Industry Market Size (In Billion)
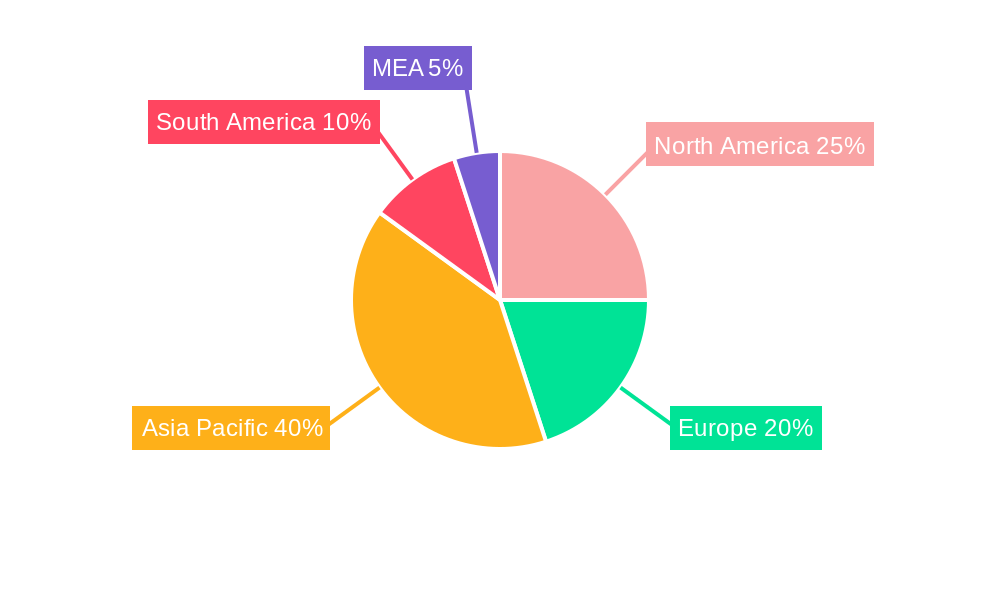
The geographical distribution of the cashew market shows a diverse landscape. While Asia-Pacific currently holds a significant share, driven by large-scale production and consumption in countries like India and China, North America and Europe show robust growth potential due to high per capita consumption and a preference for premium cashew products. Major players like Sunmark Food Ingredients, Royal Nuts, Dole Food Company, Olam International, and Cashew Nut Processing Factory are actively shaping the market through strategic investments in processing, branding, and distribution. Competition is likely to intensify as smaller regional players expand their operations and larger companies pursue strategic acquisitions to secure supply chains and expand market share. Future growth will depend on successful strategies to mitigate supply chain vulnerabilities, capitalize on emerging market trends like sustainable sourcing and ethical production, and effectively cater to the diverse needs of a global consumer base.
Cashew Industry Company Market Share
Cashew Industry Market Report: 2019-2033
Dive deep into the lucrative Cashew Industry with this comprehensive market report, projecting a robust future and offering actionable insights for stakeholders. This in-depth analysis covers market dynamics, leading players, emerging trends, and future growth opportunities within the global cashew market from 2019-2033. Benefit from detailed segmentation by grade (White Wholes, Scorched Wholes, Dessert Wholes, White Pieces, Scorched Pieces, Dessert Pieces), type (Raw, Roasted, Salted, Flavored), and application (Snacks, Beverages, Processed foods, Dairy alternatives, Meat substitutes). Discover key market drivers and challenges, and unlock strategic opportunities for growth. The report uses 2025 as the base and estimated year with a forecast period spanning 2025-2033 and historical data from 2019-2024. The global cashew market exceeded USD 300,000 Million in 2022, demonstrating significant potential.
Cashew Industry Market Dynamics & Concentration
The global cashew market is dynamic, characterized by a moderate level of concentration where key industry leaders significantly influence market trends and pricing. Innovation is a paramount driver, fueled by an escalating consumer appetite for healthier snack options and an increasing demand for diverse cashew-based product formulations. Navigating complex regulatory landscapes, particularly concerning stringent food safety standards and transparent labeling requirements, critically shapes market operations and trade flows. The inherent nature of cashews, with limited perfect substitutes, contributes to market resilience and stability. Evolving end-user preferences, most notably the surge in plant-based diets and a heightened consumer consciousness towards health and wellness, are powerful catalysts for market expansion. Significant consolidation and strategic growth are evident through mergers and acquisitions (M&A) activity, exemplified by Royal Nuts' substantial USD 23 Million investment in Ivory Coast, which underscores the strategic importance of key producing regions for future market shaping.
- Market Share: The top 5 players are projected to command approximately 60-70% of the global market share in 2024, indicating a moderately concentrated market.
- M&A Deal Counts: An estimated 8-12 significant M&A deals have occurred within the cashew industry between 2019 and 2024, signaling active consolidation and investment.
- Innovation Drivers: The increasing demand for convenient, nutritious, and functional cashew-based snacks and ingredients, alongside a growing interest in novel flavor profiles and processing techniques, are the primary drivers of innovation.
- Regulatory Frameworks: Stringent food safety certifications (e.g., HACCP, BRC) and evolving labeling regulations concerning allergens and origin are influencing production practices, quality control, and international trade dynamics.
Cashew Industry Industry Trends & Analysis
The cashew industry is experiencing robust growth, driven by several factors. The Compound Annual Growth Rate (CAGR) from 2019 to 2024 was approximately xx%, and the market penetration rate for processed cashew products is projected to reach xx% by 2033. Technological advancements in processing and packaging enhance efficiency and product quality. Consumer preferences are shifting towards healthier, more convenient options, impacting product development. Competitive dynamics are intensified by increasing market participation, forcing companies to innovate and differentiate their offerings.
Leading Markets & Segments in Cashew Industry
The global cashew industry's landscape is shaped by dominant producing and consuming nations, with India, Vietnam, and Ivory Coast standing out as critical hubs. Within these markets, specific product segments demonstrate significant consumer preference. The Roasted and Salted category overwhelmingly leads the Type segment due to its widespread appeal and convenience. Similarly, the Application segment is heavily dominated by Snacks, reflecting the increasing consumer reliance on cashews as a go-to healthy and portable food option.
Key Drivers by Region:
- India: Characterized by robust domestic consumption, an advanced and well-established processing infrastructure, and supportive government initiatives fostering growth and exports.
- Vietnam: Benefits from an ideal climate for cashew cultivation, highly efficient and technologically advanced processing facilities, and proactive export-oriented trade policies.
- Ivory Coast: Experiencing a notable expansion in its production capacity, attracting significant strategic investments from international players, and witnessing ongoing improvements in its logistical and processing infrastructure.
Segment Dominance Analysis:
- Grade: White Wholes continue to be the most sought-after grade due to their superior visual appeal, consistent quality, and exceptional versatility in various culinary applications.
- Type: Roasted and Salted cashews command the largest market share, driven by their immediate palatability, diverse flavor options, and convenience for direct consumption.
- Application: The Snacks segment demonstrates robust growth, propelled by evolving consumer lifestyles favoring quick, healthy, and on-the-go nutritional options.
Cashew Industry Product Developments
Recent product innovations focus on diverse flavors, value-added processing (e.g., cashew butter, cashew milk), and sustainable packaging. Companies are emphasizing natural ingredients and convenient formats to cater to health-conscious consumers. This evolution enhances market competitiveness, generating new revenue streams and expanding product portfolios. Technological advancements are streamlining production, increasing efficiency, and reducing costs.
Key Drivers of Cashew Industry Growth
Several factors propel the growth of the cashew industry. Technological advancements in processing and automation improve efficiency and product quality. The increasing demand for healthier snacks and plant-based alternatives fuels market expansion. Supportive government policies in key producing regions further stimulate growth. The global expansion of the middle class, particularly in emerging economies, drives consumption.
Challenges in the Cashew Industry Market
The cashew industry grapples with several significant challenges that impact its profitability and operational efficiency. Volatile raw material prices, influenced by weather patterns and global demand-supply dynamics, present a constant hurdle. Supply chain disruptions, ranging from logistical bottlenecks to geopolitical instability, can severely affect product availability and cost. The market is also characterized by intense competition, putting pressure on margins. Furthermore, increasingly stringent regulatory requirements related to food safety, ethical sourcing, and environmental sustainability add layers of complexity and operational cost. The unpredictable effects of climate change on production yields in key growing regions contribute to supply-side instability. Additionally, the rising cost of labor in certain producing nations directly escalates overall production expenses.
Emerging Opportunities in Cashew Industry
The cashew industry presents several promising opportunities for future growth. Technological innovations in processing and packaging will drive cost optimization and product differentiation. Strategic partnerships and mergers and acquisitions will unlock economies of scale and broaden market reach. Expansion into new markets, particularly in regions with growing consumer demand for healthy and convenient food options, offers significant potential.
Leading Players in the Cashew Industry Sector
- Sunmark Food Ingredients
- Royal Nuts
- Dole Food Company
- Olam International
- Cashew Nut Processing Factory
- Olan International
- OMNI Foods
- Blue Diamond Growers
Key Milestones in Cashew Industry Industry
- July 2022: Royal Nuts opens a USD 23 million cashew processing plant in Ivory Coast, boosting global processing capacity.
- September 2022: Julius Berger Nigeria PLC enters the cashew processing sector, enhancing Nigeria's processing capabilities.
- January 2023: The Indian cashew processing industry surpasses USD 300,000 Million in revenue, reflecting strong growth.
Strategic Outlook for Cashew Industry Market
The cashew industry is on a trajectory for sustained and robust growth in the foreseeable future. This expansion will be primarily propelled by the continuously rising global consumer demand for nutritious and versatile nut-based products, coupled with ongoing advancements in processing technology and strategic investments aimed at enhancing production and market reach. To thrive and maintain a competitive edge, companies must prioritize a multifaceted approach that includes relentless focus on product innovation to cater to diverse consumer preferences, the adoption of sustainable and ethical sourcing practices to meet growing consumer and regulatory expectations, and the optimization of supply chains for enhanced efficiency and resilience. Exploring untapped new markets and forging strategic alliances will be critical avenues for unlocking significant growth opportunities and solidifying market positions in the coming years.
Cashew Industry Segmentation
-
1. Grade
- 1.1. White Wholes
- 1.2. Scorched Wholes
- 1.3. Dessert Wholes
- 1.4. White Pieces
- 1.5. Scorched Pieces
- 1.6. Dessert Pieces
-
2. Grade
- 2.1. White Wholes
- 2.2. Scorched Wholes
- 2.3. Dessert Wholes
- 2.4. White Pieces
- 2.5. Scorched Pieces
- 2.6. Dessert Pieces
Cashew Industry Segmentation By Geography
-
1. North America
- 1.1. United States
- 1.2. Canada
- 1.3. Mexico
-
2. Europe
- 2.1. Germany
- 2.2. United Kingdom
- 2.3. France
-
3. Asia Pacific
- 3.1. India
- 3.2. China
- 3.3. Australia
- 3.4. Vietnam
- 3.5. Philippines
- 3.6. Indonesia
-
4. South America
- 4.1. Brazil
- 4.2. Argentina
-
5. Africa
- 5.1. C
- 6. Tanzania
Cashew Industry Regional Market Share
Geographic Coverage of Cashew Industry
Cashew Industry REPORT HIGHLIGHTS
| Aspects | Details |
|---|---|
| Study Period | 2020-2034 |
| Base Year | 2025 |
| Estimated Year | 2026 |
| Forecast Period | 2026-2034 |
| Historical Period | 2020-2025 |
| Growth Rate | CAGR of 3.31% from 2020-2034 |
| Segmentation |
|
Table of Contents
- 1. Introduction
- 1.1. Research Scope
- 1.2. Market Segmentation
- 1.3. Research Objective
- 1.4. Definitions and Assumptions
- 2. Executive Summary
- 2.1. Market Snapshot
- 3. Market Dynamics
- 3.1. Market Drivers
- 3.2. Market Restrains
- 3.3. Market Trends
- 3.4. Market Opportunities
- 4. Market Factor Analysis
- 4.1. Porters Five Forces
- 4.1.1. Bargaining Power of Suppliers
- 4.1.2. Bargaining Power of Buyers
- 4.1.3. Threat of New Entrants
- 4.1.4. Threat of Substitutes
- 4.1.5. Competitive Rivalry
- 4.2. PESTEL analysis
- 4.3. BCG Analysis
- 4.3.1. Stars (High Growth, High Market Share)
- 4.3.2. Cash Cows (Low Growth, High Market Share)
- 4.3.3. Question Mark (High Growth, Low Market Share)
- 4.3.4. Dogs (Low Growth, Low Market Share)
- 4.4. Ansoff Matrix Analysis
- 4.5. Supply Chain Analysis
- 4.6. Regulatory Landscape
- 4.7. Current Market Potential and Opportunity Assessment (TAM–SAM–SOM Framework)
- 4.8. MDP Analyst Note
- 4.1. Porters Five Forces
- 5. Market Analysis, Insights and Forecast 2021-2033
- 5.1. Market Analysis, Insights and Forecast - by Grade
- 5.1.1. White Wholes
- 5.1.2. Scorched Wholes
- 5.1.3. Dessert Wholes
- 5.1.4. White Pieces
- 5.1.5. Scorched Pieces
- 5.1.6. Dessert Pieces
- 5.2. Market Analysis, Insights and Forecast - by Grade
- 5.2.1. White Wholes
- 5.2.2. Scorched Wholes
- 5.2.3. Dessert Wholes
- 5.2.4. White Pieces
- 5.2.5. Scorched Pieces
- 5.2.6. Dessert Pieces
- 5.3. Market Analysis, Insights and Forecast - by Region
- 5.3.1. North America
- 5.3.2. Europe
- 5.3.3. Asia Pacific
- 5.3.4. South America
- 5.3.5. Africa
- 5.3.6. Tanzania
- 5.1. Market Analysis, Insights and Forecast - by Grade
- 6. Global Cashew Industry Analysis, Insights and Forecast, 2021-2033
- 6.1. Market Analysis, Insights and Forecast - by Grade
- 6.1.1. White Wholes
- 6.1.2. Scorched Wholes
- 6.1.3. Dessert Wholes
- 6.1.4. White Pieces
- 6.1.5. Scorched Pieces
- 6.1.6. Dessert Pieces
- 6.2. Market Analysis, Insights and Forecast - by Grade
- 6.2.1. White Wholes
- 6.2.2. Scorched Wholes
- 6.2.3. Dessert Wholes
- 6.2.4. White Pieces
- 6.2.5. Scorched Pieces
- 6.2.6. Dessert Pieces
- 6.1. Market Analysis, Insights and Forecast - by Grade
- 7. North America Cashew Industry Analysis, Insights and Forecast, 2020-2032
- 7.1. Market Analysis, Insights and Forecast - by Grade
- 7.1.1. White Wholes
- 7.1.2. Scorched Wholes
- 7.1.3. Dessert Wholes
- 7.1.4. White Pieces
- 7.1.5. Scorched Pieces
- 7.1.6. Dessert Pieces
- 7.2. Market Analysis, Insights and Forecast - by Grade
- 7.2.1. White Wholes
- 7.2.2. Scorched Wholes
- 7.2.3. Dessert Wholes
- 7.2.4. White Pieces
- 7.2.5. Scorched Pieces
- 7.2.6. Dessert Pieces
- 7.1. Market Analysis, Insights and Forecast - by Grade
- 8. Europe Cashew Industry Analysis, Insights and Forecast, 2020-2032
- 8.1. Market Analysis, Insights and Forecast - by Grade
- 8.1.1. White Wholes
- 8.1.2. Scorched Wholes
- 8.1.3. Dessert Wholes
- 8.1.4. White Pieces
- 8.1.5. Scorched Pieces
- 8.1.6. Dessert Pieces
- 8.2. Market Analysis, Insights and Forecast - by Grade
- 8.2.1. White Wholes
- 8.2.2. Scorched Wholes
- 8.2.3. Dessert Wholes
- 8.2.4. White Pieces
- 8.2.5. Scorched Pieces
- 8.2.6. Dessert Pieces
- 8.1. Market Analysis, Insights and Forecast - by Grade
- 9. Asia Pacific Cashew Industry Analysis, Insights and Forecast, 2020-2032
- 9.1. Market Analysis, Insights and Forecast - by Grade
- 9.1.1. White Wholes
- 9.1.2. Scorched Wholes
- 9.1.3. Dessert Wholes
- 9.1.4. White Pieces
- 9.1.5. Scorched Pieces
- 9.1.6. Dessert Pieces
- 9.2. Market Analysis, Insights and Forecast - by Grade
- 9.2.1. White Wholes
- 9.2.2. Scorched Wholes
- 9.2.3. Dessert Wholes
- 9.2.4. White Pieces
- 9.2.5. Scorched Pieces
- 9.2.6. Dessert Pieces
- 9.1. Market Analysis, Insights and Forecast - by Grade
- 10. South America Cashew Industry Analysis, Insights and Forecast, 2020-2032
- 10.1. Market Analysis, Insights and Forecast - by Grade
- 10.1.1. White Wholes
- 10.1.2. Scorched Wholes
- 10.1.3. Dessert Wholes
- 10.1.4. White Pieces
- 10.1.5. Scorched Pieces
- 10.1.6. Dessert Pieces
- 10.2. Market Analysis, Insights and Forecast - by Grade
- 10.2.1. White Wholes
- 10.2.2. Scorched Wholes
- 10.2.3. Dessert Wholes
- 10.2.4. White Pieces
- 10.2.5. Scorched Pieces
- 10.2.6. Dessert Pieces
- 10.1. Market Analysis, Insights and Forecast - by Grade
- 11. Africa Cashew Industry Analysis, Insights and Forecast, 2020-2032
- 11.1. Market Analysis, Insights and Forecast - by Grade
- 11.1.1. White Wholes
- 11.1.2. Scorched Wholes
- 11.1.3. Dessert Wholes
- 11.1.4. White Pieces
- 11.1.5. Scorched Pieces
- 11.1.6. Dessert Pieces
- 11.2. Market Analysis, Insights and Forecast - by Grade
- 11.2.1. White Wholes
- 11.2.2. Scorched Wholes
- 11.2.3. Dessert Wholes
- 11.2.4. White Pieces
- 11.2.5. Scorched Pieces
- 11.2.6. Dessert Pieces
- 11.1. Market Analysis, Insights and Forecast - by Grade
- 12. Tanzania Cashew Industry Analysis, Insights and Forecast, 2020-2032
- 12.1. Market Analysis, Insights and Forecast - by Grade
- 12.1.1. White Wholes
- 12.1.2. Scorched Wholes
- 12.1.3. Dessert Wholes
- 12.1.4. White Pieces
- 12.1.5. Scorched Pieces
- 12.1.6. Dessert Pieces
- 12.2. Market Analysis, Insights and Forecast - by Grade
- 12.2.1. White Wholes
- 12.2.2. Scorched Wholes
- 12.2.3. Dessert Wholes
- 12.2.4. White Pieces
- 12.2.5. Scorched Pieces
- 12.2.6. Dessert Pieces
- 12.1. Market Analysis, Insights and Forecast - by Grade
- 13. Competitive Analysis
- 13.1. Company Profiles
- 13.1.1 Sunmark Food Ingredients
- 13.1.1.1. Company Overview
- 13.1.1.2. Products
- 13.1.1.3. Company Financials
- 13.1.1.4. SWOT Analysis
- 13.1.2 Royal Nuts
- 13.1.2.1. Company Overview
- 13.1.2.2. Products
- 13.1.2.3. Company Financials
- 13.1.2.4. SWOT Analysis
- 13.1.3 Dole Food Company
- 13.1.3.1. Company Overview
- 13.1.3.2. Products
- 13.1.3.3. Company Financials
- 13.1.3.4. SWOT Analysis
- 13.1.4 Olam International
- 13.1.4.1. Company Overview
- 13.1.4.2. Products
- 13.1.4.3. Company Financials
- 13.1.4.4. SWOT Analysis
- 13.1.5 Cashew Nut Processing Factory
- 13.1.5.1. Company Overview
- 13.1.5.2. Products
- 13.1.5.3. Company Financials
- 13.1.5.4. SWOT Analysis
- 13.1.1 Sunmark Food Ingredients
- 13.2. Market Entropy
- 13.2.1 Company's Key Areas Served
- 13.2.2 Recent Developments
- 13.3. Company Market Share Analysis 2025
- 13.3.1 Top 5 Companies Market Share Analysis
- 13.3.2 Top 3 Companies Market Share Analysis
- 13.4. List of Potential Customers
- 14. Research Methodology
List of Figures
- Figure 1: Global Cashew Industry Revenue Breakdown (Million, %) by Region 2025 & 2033
- Figure 2: Global Cashew Industry Volume Breakdown (Kiloton, %) by Region 2025 & 2033
- Figure 3: North America Cashew Industry Revenue (Million), by Grade 2025 & 2033
- Figure 4: North America Cashew Industry Volume (Kiloton), by Grade 2025 & 2033
- Figure 5: North America Cashew Industry Revenue Share (%), by Grade 2025 & 2033
- Figure 6: North America Cashew Industry Volume Share (%), by Grade 2025 & 2033
- Figure 7: North America Cashew Industry Revenue (Million), by Grade 2025 & 2033
- Figure 8: North America Cashew Industry Volume (Kiloton), by Grade 2025 & 2033
- Figure 9: North America Cashew Industry Revenue Share (%), by Grade 2025 & 2033
- Figure 10: North America Cashew Industry Volume Share (%), by Grade 2025 & 2033
- Figure 11: North America Cashew Industry Revenue (Million), by Country 2025 & 2033
- Figure 12: North America Cashew Industry Volume (Kiloton), by Country 2025 & 2033
- Figure 13: North America Cashew Industry Revenue Share (%), by Country 2025 & 2033
- Figure 14: North America Cashew Industry Volume Share (%), by Country 2025 & 2033
- Figure 15: Europe Cashew Industry Revenue (Million), by Grade 2025 & 2033
- Figure 16: Europe Cashew Industry Volume (Kiloton), by Grade 2025 & 2033
- Figure 17: Europe Cashew Industry Revenue Share (%), by Grade 2025 & 2033
- Figure 18: Europe Cashew Industry Volume Share (%), by Grade 2025 & 2033
- Figure 19: Europe Cashew Industry Revenue (Million), by Grade 2025 & 2033
- Figure 20: Europe Cashew Industry Volume (Kiloton), by Grade 2025 & 2033
- Figure 21: Europe Cashew Industry Revenue Share (%), by Grade 2025 & 2033
- Figure 22: Europe Cashew Industry Volume Share (%), by Grade 2025 & 2033
- Figure 23: Europe Cashew Industry Revenue (Million), by Country 2025 & 2033
- Figure 24: Europe Cashew Industry Volume (Kiloton), by Country 2025 & 2033
- Figure 25: Europe Cashew Industry Revenue Share (%), by Country 2025 & 2033
- Figure 26: Europe Cashew Industry Volume Share (%), by Country 2025 & 2033
- Figure 27: Asia Pacific Cashew Industry Revenue (Million), by Grade 2025 & 2033
- Figure 28: Asia Pacific Cashew Industry Volume (Kiloton), by Grade 2025 & 2033
- Figure 29: Asia Pacific Cashew Industry Revenue Share (%), by Grade 2025 & 2033
- Figure 30: Asia Pacific Cashew Industry Volume Share (%), by Grade 2025 & 2033
- Figure 31: Asia Pacific Cashew Industry Revenue (Million), by Grade 2025 & 2033
- Figure 32: Asia Pacific Cashew Industry Volume (Kiloton), by Grade 2025 & 2033
- Figure 33: Asia Pacific Cashew Industry Revenue Share (%), by Grade 2025 & 2033
- Figure 34: Asia Pacific Cashew Industry Volume Share (%), by Grade 2025 & 2033
- Figure 35: Asia Pacific Cashew Industry Revenue (Million), by Country 2025 & 2033
- Figure 36: Asia Pacific Cashew Industry Volume (Kiloton), by Country 2025 & 2033
- Figure 37: Asia Pacific Cashew Industry Revenue Share (%), by Country 2025 & 2033
- Figure 38: Asia Pacific Cashew Industry Volume Share (%), by Country 2025 & 2033
- Figure 39: South America Cashew Industry Revenue (Million), by Grade 2025 & 2033
- Figure 40: South America Cashew Industry Volume (Kiloton), by Grade 2025 & 2033
- Figure 41: South America Cashew Industry Revenue Share (%), by Grade 2025 & 2033
- Figure 42: South America Cashew Industry Volume Share (%), by Grade 2025 & 2033
- Figure 43: South America Cashew Industry Revenue (Million), by Grade 2025 & 2033
- Figure 44: South America Cashew Industry Volume (Kiloton), by Grade 2025 & 2033
- Figure 45: South America Cashew Industry Revenue Share (%), by Grade 2025 & 2033
- Figure 46: South America Cashew Industry Volume Share (%), by Grade 2025 & 2033
- Figure 47: South America Cashew Industry Revenue (Million), by Country 2025 & 2033
- Figure 48: South America Cashew Industry Volume (Kiloton), by Country 2025 & 2033
- Figure 49: South America Cashew Industry Revenue Share (%), by Country 2025 & 2033
- Figure 50: South America Cashew Industry Volume Share (%), by Country 2025 & 2033
- Figure 51: Africa Cashew Industry Revenue (Million), by Grade 2025 & 2033
- Figure 52: Africa Cashew Industry Volume (Kiloton), by Grade 2025 & 2033
- Figure 53: Africa Cashew Industry Revenue Share (%), by Grade 2025 & 2033
- Figure 54: Africa Cashew Industry Volume Share (%), by Grade 2025 & 2033
- Figure 55: Africa Cashew Industry Revenue (Million), by Grade 2025 & 2033
- Figure 56: Africa Cashew Industry Volume (Kiloton), by Grade 2025 & 2033
- Figure 57: Africa Cashew Industry Revenue Share (%), by Grade 2025 & 2033
- Figure 58: Africa Cashew Industry Volume Share (%), by Grade 2025 & 2033
- Figure 59: Africa Cashew Industry Revenue (Million), by Country 2025 & 2033
- Figure 60: Africa Cashew Industry Volume (Kiloton), by Country 2025 & 2033
- Figure 61: Africa Cashew Industry Revenue Share (%), by Country 2025 & 2033
- Figure 62: Africa Cashew Industry Volume Share (%), by Country 2025 & 2033
- Figure 63: Tanzania Cashew Industry Revenue (Million), by Grade 2025 & 2033
- Figure 64: Tanzania Cashew Industry Volume (Kiloton), by Grade 2025 & 2033
- Figure 65: Tanzania Cashew Industry Revenue Share (%), by Grade 2025 & 2033
- Figure 66: Tanzania Cashew Industry Volume Share (%), by Grade 2025 & 2033
- Figure 67: Tanzania Cashew Industry Revenue (Million), by Grade 2025 & 2033
- Figure 68: Tanzania Cashew Industry Volume (Kiloton), by Grade 2025 & 2033
- Figure 69: Tanzania Cashew Industry Revenue Share (%), by Grade 2025 & 2033
- Figure 70: Tanzania Cashew Industry Volume Share (%), by Grade 2025 & 2033
- Figure 71: Tanzania Cashew Industry Revenue (Million), by Country 2025 & 2033
- Figure 72: Tanzania Cashew Industry Volume (Kiloton), by Country 2025 & 2033
- Figure 73: Tanzania Cashew Industry Revenue Share (%), by Country 2025 & 2033
- Figure 74: Tanzania Cashew Industry Volume Share (%), by Country 2025 & 2033
List of Tables
- Table 1: Global Cashew Industry Revenue Million Forecast, by Grade 2020 & 2033
- Table 2: Global Cashew Industry Volume Kiloton Forecast, by Grade 2020 & 2033
- Table 3: Global Cashew Industry Revenue Million Forecast, by Grade 2020 & 2033
- Table 4: Global Cashew Industry Volume Kiloton Forecast, by Grade 2020 & 2033
- Table 5: Global Cashew Industry Revenue Million Forecast, by Region 2020 & 2033
- Table 6: Global Cashew Industry Volume Kiloton Forecast, by Region 2020 & 2033
- Table 7: Global Cashew Industry Revenue Million Forecast, by Grade 2020 & 2033
- Table 8: Global Cashew Industry Volume Kiloton Forecast, by Grade 2020 & 2033
- Table 9: Global Cashew Industry Revenue Million Forecast, by Grade 2020 & 2033
- Table 10: Global Cashew Industry Volume Kiloton Forecast, by Grade 2020 & 2033
- Table 11: Global Cashew Industry Revenue Million Forecast, by Country 2020 & 2033
- Table 12: Global Cashew Industry Volume Kiloton Forecast, by Country 2020 & 2033
- Table 13: United States Cashew Industry Revenue (Million) Forecast, by Application 2020 & 2033
- Table 14: United States Cashew Industry Volume (Kiloton) Forecast, by Application 2020 & 2033
- Table 15: Canada Cashew Industry Revenue (Million) Forecast, by Application 2020 & 2033
- Table 16: Canada Cashew Industry Volume (Kiloton) Forecast, by Application 2020 & 2033
- Table 17: Mexico Cashew Industry Revenue (Million) Forecast, by Application 2020 & 2033
- Table 18: Mexico Cashew Industry Volume (Kiloton) Forecast, by Application 2020 & 2033
- Table 19: Global Cashew Industry Revenue Million Forecast, by Grade 2020 & 2033
- Table 20: Global Cashew Industry Volume Kiloton Forecast, by Grade 2020 & 2033
- Table 21: Global Cashew Industry Revenue Million Forecast, by Grade 2020 & 2033
- Table 22: Global Cashew Industry Volume Kiloton Forecast, by Grade 2020 & 2033
- Table 23: Global Cashew Industry Revenue Million Forecast, by Country 2020 & 2033
- Table 24: Global Cashew Industry Volume Kiloton Forecast, by Country 2020 & 2033
- Table 25: Germany Cashew Industry Revenue (Million) Forecast, by Application 2020 & 2033
- Table 26: Germany Cashew Industry Volume (Kiloton) Forecast, by Application 2020 & 2033
- Table 27: United Kingdom Cashew Industry Revenue (Million) Forecast, by Application 2020 & 2033
- Table 28: United Kingdom Cashew Industry Volume (Kiloton) Forecast, by Application 2020 & 2033
- Table 29: France Cashew Industry Revenue (Million) Forecast, by Application 2020 & 2033
- Table 30: France Cashew Industry Volume (Kiloton) Forecast, by Application 2020 & 2033
- Table 31: Global Cashew Industry Revenue Million Forecast, by Grade 2020 & 2033
- Table 32: Global Cashew Industry Volume Kiloton Forecast, by Grade 2020 & 2033
- Table 33: Global Cashew Industry Revenue Million Forecast, by Grade 2020 & 2033
- Table 34: Global Cashew Industry Volume Kiloton Forecast, by Grade 2020 & 2033
- Table 35: Global Cashew Industry Revenue Million Forecast, by Country 2020 & 2033
- Table 36: Global Cashew Industry Volume Kiloton Forecast, by Country 2020 & 2033
- Table 37: India Cashew Industry Revenue (Million) Forecast, by Application 2020 & 2033
- Table 38: India Cashew Industry Volume (Kiloton) Forecast, by Application 2020 & 2033
- Table 39: China Cashew Industry Revenue (Million) Forecast, by Application 2020 & 2033
- Table 40: China Cashew Industry Volume (Kiloton) Forecast, by Application 2020 & 2033
- Table 41: Australia Cashew Industry Revenue (Million) Forecast, by Application 2020 & 2033
- Table 42: Australia Cashew Industry Volume (Kiloton) Forecast, by Application 2020 & 2033
- Table 43: Vietnam Cashew Industry Revenue (Million) Forecast, by Application 2020 & 2033
- Table 44: Vietnam Cashew Industry Volume (Kiloton) Forecast, by Application 2020 & 2033
- Table 45: Philippines Cashew Industry Revenue (Million) Forecast, by Application 2020 & 2033
- Table 46: Philippines Cashew Industry Volume (Kiloton) Forecast, by Application 2020 & 2033
- Table 47: Indonesia Cashew Industry Revenue (Million) Forecast, by Application 2020 & 2033
- Table 48: Indonesia Cashew Industry Volume (Kiloton) Forecast, by Application 2020 & 2033
- Table 49: Global Cashew Industry Revenue Million Forecast, by Grade 2020 & 2033
- Table 50: Global Cashew Industry Volume Kiloton Forecast, by Grade 2020 & 2033
- Table 51: Global Cashew Industry Revenue Million Forecast, by Grade 2020 & 2033
- Table 52: Global Cashew Industry Volume Kiloton Forecast, by Grade 2020 & 2033
- Table 53: Global Cashew Industry Revenue Million Forecast, by Country 2020 & 2033
- Table 54: Global Cashew Industry Volume Kiloton Forecast, by Country 2020 & 2033
- Table 55: Brazil Cashew Industry Revenue (Million) Forecast, by Application 2020 & 2033
- Table 56: Brazil Cashew Industry Volume (Kiloton) Forecast, by Application 2020 & 2033
- Table 57: Argentina Cashew Industry Revenue (Million) Forecast, by Application 2020 & 2033
- Table 58: Argentina Cashew Industry Volume (Kiloton) Forecast, by Application 2020 & 2033
- Table 59: Global Cashew Industry Revenue Million Forecast, by Grade 2020 & 2033
- Table 60: Global Cashew Industry Volume Kiloton Forecast, by Grade 2020 & 2033
- Table 61: Global Cashew Industry Revenue Million Forecast, by Grade 2020 & 2033
- Table 62: Global Cashew Industry Volume Kiloton Forecast, by Grade 2020 & 2033
- Table 63: Global Cashew Industry Revenue Million Forecast, by Country 2020 & 2033
- Table 64: Global Cashew Industry Volume Kiloton Forecast, by Country 2020 & 2033
- Table 65: C Cashew Industry Revenue (Million) Forecast, by Application 2020 & 2033
- Table 66: C Cashew Industry Volume (Kiloton) Forecast, by Application 2020 & 2033
- Table 67: Global Cashew Industry Revenue Million Forecast, by Grade 2020 & 2033
- Table 68: Global Cashew Industry Volume Kiloton Forecast, by Grade 2020 & 2033
- Table 69: Global Cashew Industry Revenue Million Forecast, by Grade 2020 & 2033
- Table 70: Global Cashew Industry Volume Kiloton Forecast, by Grade 2020 & 2033
- Table 71: Global Cashew Industry Revenue Million Forecast, by Country 2020 & 2033
- Table 72: Global Cashew Industry Volume Kiloton Forecast, by Country 2020 & 2033
Frequently Asked Questions
1. What is the projected Compound Annual Growth Rate (CAGR) of the Cashew Industry?
The projected CAGR is approximately 3.31%.
2. Which companies are prominent players in the Cashew Industry?
Key companies in the market include Sunmark Food Ingredients, Royal Nuts , Dole Food Company , Olam International , Cashew Nut Processing Factory.
3. What are the main segments of the Cashew Industry?
The market segments include Grade, Grade.
4. Can you provide details about the market size?
The market size is estimated to be USD 7.82 Million as of 2022.
5. What are some drivers contributing to market growth?
Rising Consumption of Cashew Nuts as a Healthy Snack; Increasing Government initiatives; Growing Cashew Nut Imports in The United States.
6. What are the notable trends driving market growth?
Rising Consumption of Cashew Nuts as a Healthy Snack.
7. Are there any restraints impacting market growth?
Hazardous Climatic Condition Hinders Cashew Production; Stringent Regulations Related To Food Quality Standards.
8. Can you provide examples of recent developments in the market?
January 2023: According to CRISIL (an Indian consulting firm offering ratings, analysis, risk, and policy advice) and a branch of S&P Global, the Indian cashew processing industry is driving demand for cashews, which extended beyond USD 300,000 million in 2022, an increase of 15% year-on-year growth in revenue.
9. What pricing options are available for accessing the report?
Pricing options include single-user, multi-user, and enterprise licenses priced at USD 4750, USD 5250, and USD 8750 respectively.
10. Is the market size provided in terms of value or volume?
The market size is provided in terms of value, measured in Million and volume, measured in Kiloton.
11. Are there any specific market keywords associated with the report?
Yes, the market keyword associated with the report is "Cashew Industry," which aids in identifying and referencing the specific market segment covered.
12. How do I determine which pricing option suits my needs best?
The pricing options vary based on user requirements and access needs. Individual users may opt for single-user licenses, while businesses requiring broader access may choose multi-user or enterprise licenses for cost-effective access to the report.
13. Are there any additional resources or data provided in the Cashew Industry report?
While the report offers comprehensive insights, it's advisable to review the specific contents or supplementary materials provided to ascertain if additional resources or data are available.
14. How can I stay updated on further developments or reports in the Cashew Industry?
To stay informed about further developments, trends, and reports in the Cashew Industry, consider subscribing to industry newsletters, following relevant companies and organizations, or regularly checking reputable industry news sources and publications.
Methodology
Step 1 - Identification of Relevant Samples Size from Population Database


Step 2 - Approaches for Defining Global Market Size (Value, Volume* & Price*)

Note*: In applicable scenarios
Step 3 - Data Sources
Primary Research
- Web Analytics
- Survey Reports
- Research Institute
- Latest Research Reports
- Opinion Leaders
Secondary Research
- Annual Reports
- White Paper
- Latest Press Release
- Industry Association
- Paid Database
- Investor Presentations

Step 4 - Data Triangulation
Involves using different sources of information in order to increase the validity of a study
These sources are likely to be stakeholders in a program - participants, other researchers, program staff, other community members, and so on.
Then we put all data in single framework & apply various statistical tools to find out the dynamic on the market.
During the analysis stage, feedback from the stakeholder groups would be compared to determine areas of agreement as well as areas of divergence