

Key Insights
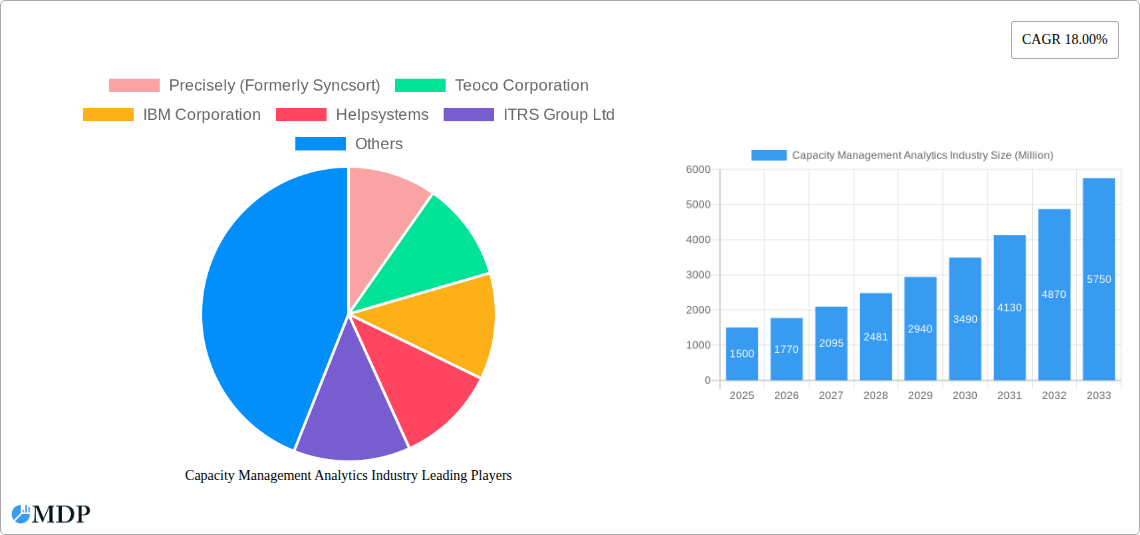
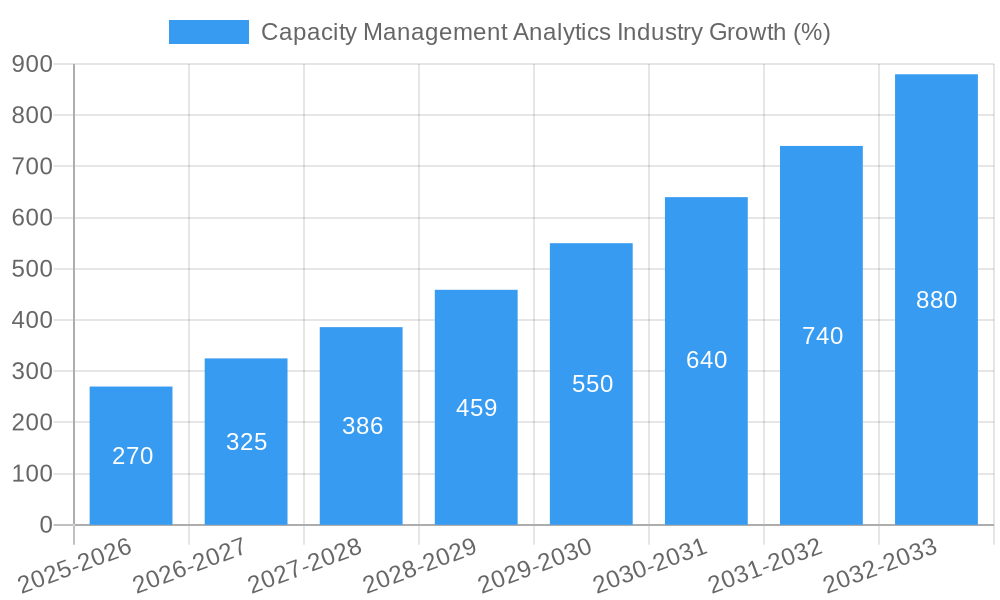
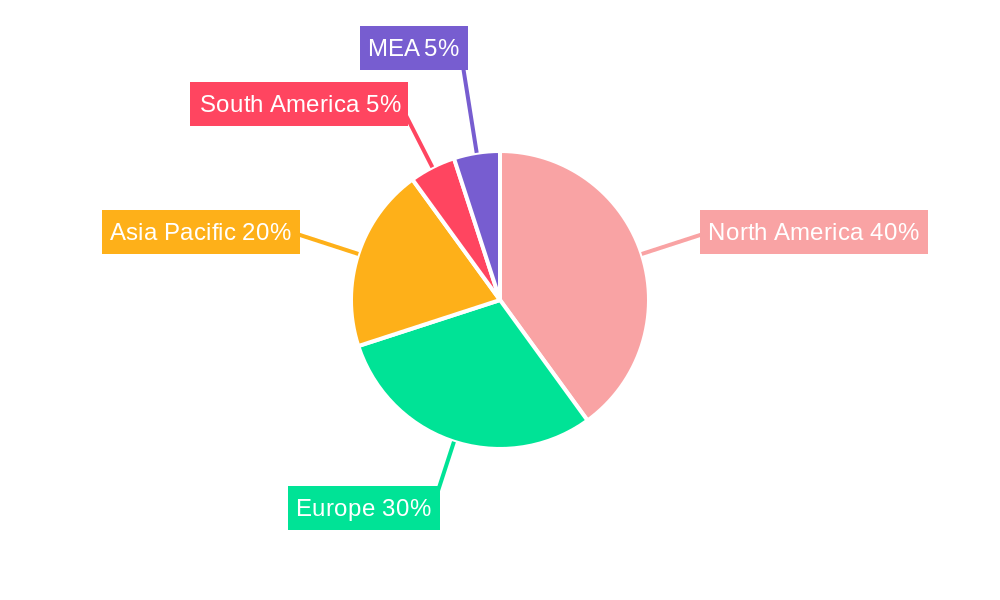
The Capacity Management Analytics market is experiencing robust growth, projected to reach a substantial size by 2033. A compound annual growth rate (CAGR) of 18% from 2025 to 2033 signifies significant market expansion, driven primarily by the increasing need for efficient IT infrastructure management across various sectors. The rising adoption of cloud computing, alongside the surge in data volumes generated by businesses, necessitates sophisticated capacity planning and optimization solutions. Furthermore, the growing emphasis on proactive IT operations and reduced operational costs fuels the demand for advanced analytics capabilities. Key end-user industries like IT & Telecom, Healthcare, and BFSI are leading the adoption, leveraging capacity management analytics to improve service levels, enhance resource utilization, and prevent costly outages. The market is segmented by deployment (on-premise and cloud), with cloud-based solutions gaining traction due to their scalability and flexibility. Competitive players like Precisely (formerly Syncsort), IBM, and Hewlett Packard Enterprise are actively shaping the market landscape through technological innovation and strategic partnerships. The geographical distribution reveals strong growth potential in North America and Asia Pacific, regions characterized by high technology adoption and substantial investments in IT infrastructure. While challenges such as the complexity of implementing these solutions and the need for skilled professionals exist, the overall market trajectory remains positive, promising substantial growth opportunities in the coming years.
The competitive landscape features a mix of established players and emerging vendors, indicating a dynamic market with ongoing innovation. The ongoing evolution of cloud technologies and the increasing adoption of Artificial Intelligence (AI) and Machine Learning (ML) within capacity management tools further propel market expansion. Government regulations focused on data security and compliance are also influencing market dynamics, leading to increased demand for secure and compliant capacity management solutions. Furthermore, the rising adoption of hybrid cloud environments presents both opportunities and challenges for vendors, necessitating the development of solutions that seamlessly integrate on-premise and cloud-based infrastructure. The continuous need for enhanced data visualization and reporting capabilities drives the demand for sophisticated analytics dashboards and reporting tools. Future growth is expected to be driven by advancements in predictive analytics, improved integration with existing IT systems, and a greater focus on automation within capacity management processes.
Capacity Management Analytics Market: A Comprehensive Report (2019-2033)
This comprehensive report provides a detailed analysis of the Capacity Management Analytics market, offering invaluable insights for stakeholders across the industry. With a study period spanning 2019-2033, a base year of 2025, and an estimated year of 2025, this report projects a robust forecast period from 2025-2033. The report covers key market dynamics, leading players, emerging trends, and future growth opportunities, making it an essential resource for informed decision-making. The market is expected to reach xx Million by 2033, exhibiting a CAGR of xx% during the forecast period.
Capacity Management Analytics Industry Market Dynamics & Concentration
The Capacity Management Analytics market is characterized by a moderately concentrated landscape, with several established players holding significant market share. Precisely (Formerly Syncsort), IBM Corporation, and VMware Inc. are among the key players, collectively accounting for an estimated xx% of the market in 2025. However, the market also exhibits a dynamic competitive environment with ongoing innovation, mergers and acquisitions (M&A), and the entry of new players driving competition.
Market Concentration:
- High concentration among established players (xx% market share in 2025).
- Increased competition from smaller players and new entrants.
- Strategic partnerships and collaborations influencing market dynamics.
Innovation Drivers:
- Advancements in AI and machine learning for predictive analytics.
- Development of cloud-based solutions and SaaS offerings.
- Growing demand for real-time capacity monitoring and optimization.
Regulatory Frameworks:
- Compliance regulations (e.g., data privacy) impacting market growth.
- Government initiatives promoting digital transformation creating opportunities.
Product Substitutes:
- Traditional capacity planning methods posing limited competition.
- The rise of specialized software solutions strengthening market position.
End-User Trends:
- Increasing adoption of digital transformation strategies across various sectors.
- Growing need for efficient resource management and cost optimization.
M&A Activities:
- A total of xx M&A deals were observed during the historical period (2019-2024).
- Consolidation expected to continue, driving market concentration.
Capacity Management Analytics Industry Industry Trends & Analysis
The Capacity Management Analytics market is experiencing robust growth fueled by several key factors. The increasing adoption of cloud computing, the rise of big data, and the growing need for real-time capacity monitoring and optimization are driving market expansion. The global shift towards digital transformation across industries is further boosting demand for sophisticated capacity management solutions. Technological advancements, particularly in artificial intelligence (AI) and machine learning (ML), are enabling the development of more accurate and predictive analytics tools. Consumer preference is shifting towards cloud-based, scalable, and cost-effective solutions. Competitive dynamics are characterized by innovation, strategic partnerships, and M&A activity. The market's CAGR is projected to be xx% from 2025 to 2033, with a significant market penetration rate expected in the IT & Telecom and BFSI sectors.
Leading Markets & Segments in Capacity Management Analytics Industry
The IT & Telecom sector currently dominates the Capacity Management Analytics market, accounting for an estimated xx% of the market share in 2025. This is primarily due to the high volume of data generated and the critical need for efficient resource management within these industries. The cloud deployment model is rapidly gaining traction, driven by its scalability, cost-effectiveness, and ease of access.
By End-user Industry:
- IT & Telecom: Highest market share due to high data volumes and critical resource management needs. Key driver: increasing data center capacity requirements.
- BFSI: Significant growth driven by regulatory compliance needs and security concerns. Key driver: need for real-time fraud detection and risk management.
- Healthcare: Growing adoption driven by the need for efficient resource allocation and improved patient care. Key driver: increasing use of medical devices and data management.
- Manufacturing: Moderate growth driven by the need to optimize production processes and reduce downtime. Key driver: Industry 4.0 initiatives.
By Deployment:
- Cloud: Fastest-growing segment due to scalability, cost-effectiveness, and ease of access. Key driver: increasing adoption of cloud computing services.
- On-premise: Still significant market share due to existing infrastructure and security concerns. Key driver: legacy systems and data security requirements.
Capacity Management Analytics Industry Product Developments
Recent product innovations focus on integrating AI/ML for predictive analytics, enhancing automation capabilities, and improving user interfaces for better accessibility and usability. These advancements enable businesses to optimize resource allocation, predict capacity needs accurately, and minimize operational disruptions. The market is seeing a shift toward cloud-based solutions that offer increased scalability and flexibility, catering to the evolving needs of businesses across diverse sectors.
Key Drivers of Capacity Management Analytics Industry Growth
Several factors contribute to the robust growth of the Capacity Management Analytics market. These include the increasing adoption of cloud computing and big data analytics, the growing need for real-time capacity monitoring and optimization, and advancements in AI/ML leading to more precise predictive capabilities. Government regulations promoting digital transformation and the continuous need for businesses to optimize resource allocation and reduce operational costs further fuel market growth.
Challenges in the Capacity Management Analytics Industry Market
Key challenges include the complexities of integrating different systems, the high initial investment required for implementation, and the need for skilled personnel to operate and maintain these systems. Data security concerns and compliance regulations also pose significant hurdles for businesses. Furthermore, competitive pressures from established players and new entrants contribute to the challenges faced in this market. The market faces a projected xx Million revenue loss in 2026 due to these challenges.
Emerging Opportunities in Capacity Management Analytics Industry
Significant growth opportunities exist in expanding into new geographic markets and integrating advanced technologies like blockchain and IoT into capacity management solutions. Strategic partnerships and collaborations with technology providers can unlock new innovation and enhance market penetration. Focus on developing user-friendly solutions catering to businesses of all sizes will further drive market expansion.
Leading Players in the Capacity Management Analytics Industry Sector
- Precisely (Formerly Syncsort)
- Teoco Corporation
- IBM Corporation
- Helpsystems
- ITRS Group Ltd
- Hewlett Packard Enterprise Company
- Broadcom Inc
- BMC Software Inc
- Riverbed Technology Inc
- NetApp Inc
- CPT Global Limited
- VMware Inc
Key Milestones in Capacity Management Analytics Industry Industry
- 2020: Increased adoption of cloud-based capacity management solutions.
- 2021: Several major players launched AI-powered predictive analytics tools.
- 2022: Significant M&A activity reshaped the market landscape.
- 2023: Focus on enhancing user experience and improving data security.
- 2024: Growing adoption of capacity management solutions in emerging markets.
Strategic Outlook for Capacity Management Analytics Industry Market
The future of the Capacity Management Analytics market looks bright, with continued growth driven by technological advancements and increasing demand across various sectors. Strategic initiatives focused on innovation, partnerships, and expansion into new markets will be critical for success. The market is poised for significant growth, driven by the ongoing digital transformation and the increasing need for efficient resource management.
Capacity Management Analytics Industry Segmentation
-
1. Deployment
- 1.1. On-premise
- 1.2. Cloud
-
2. End-user Industry
- 2.1. IT & Telecom
- 2.2. Healthcare
- 2.3. Manufacturing
- 2.4. BFSI
- 2.5. Government
- 2.6. Other End-user Industries
Capacity Management Analytics Industry Segmentation By Geography
- 1. North America
- 2. Europe
- 3. Asia Pacific
- 4. Latin America
- 5. Middle East and Africa
Capacity Management Analytics Industry REPORT HIGHLIGHTS
| Aspects | Details |
|---|---|
| Study Period | 2019-2033 |
| Base Year | 2024 |
| Estimated Year | 2025 |
| Forecast Period | 2025-2033 |
| Historical Period | 2019-2024 |
| Growth Rate | CAGR of 18.00% from 2019-2033 |
| Segmentation |
|
Table of Contents
- 1. Introduction
- 1.1. Research Scope
- 1.2. Market Segmentation
- 1.3. Research Methodology
- 1.4. Definitions and Assumptions
- 2. Executive Summary
- 2.1. Introduction
- 3. Market Dynamics
- 3.1. Introduction
- 3.2. Market Drivers
- 3.2.1. ; Increasing Need for Optimization and Effective Utilization of IT Infrastructures; Increasing Complexities in IT Infrastructures
- 3.3. Market Restrains
- 3.3.1. ; Lower Adoption Among the SMEs
- 3.4. Market Trends
- 3.4.1. Manufacturing Segment is Expected to Witness Significant Growth
- 4. Market Factor Analysis
- 4.1. Porters Five Forces
- 4.2. Supply/Value Chain
- 4.3. PESTEL analysis
- 4.4. Market Entropy
- 4.5. Patent/Trademark Analysis
- 5. Global Capacity Management Analytics Industry Analysis, Insights and Forecast, 2019-2031
- 5.1. Market Analysis, Insights and Forecast - by Deployment
- 5.1.1. On-premise
- 5.1.2. Cloud
- 5.2. Market Analysis, Insights and Forecast - by End-user Industry
- 5.2.1. IT & Telecom
- 5.2.2. Healthcare
- 5.2.3. Manufacturing
- 5.2.4. BFSI
- 5.2.5. Government
- 5.2.6. Other End-user Industries
- 5.3. Market Analysis, Insights and Forecast - by Region
- 5.3.1. North America
- 5.3.2. Europe
- 5.3.3. Asia Pacific
- 5.3.4. Latin America
- 5.3.5. Middle East and Africa
- 5.1. Market Analysis, Insights and Forecast - by Deployment
- 6. North America Capacity Management Analytics Industry Analysis, Insights and Forecast, 2019-2031
- 6.1. Market Analysis, Insights and Forecast - by Deployment
- 6.1.1. On-premise
- 6.1.2. Cloud
- 6.2. Market Analysis, Insights and Forecast - by End-user Industry
- 6.2.1. IT & Telecom
- 6.2.2. Healthcare
- 6.2.3. Manufacturing
- 6.2.4. BFSI
- 6.2.5. Government
- 6.2.6. Other End-user Industries
- 6.1. Market Analysis, Insights and Forecast - by Deployment
- 7. Europe Capacity Management Analytics Industry Analysis, Insights and Forecast, 2019-2031
- 7.1. Market Analysis, Insights and Forecast - by Deployment
- 7.1.1. On-premise
- 7.1.2. Cloud
- 7.2. Market Analysis, Insights and Forecast - by End-user Industry
- 7.2.1. IT & Telecom
- 7.2.2. Healthcare
- 7.2.3. Manufacturing
- 7.2.4. BFSI
- 7.2.5. Government
- 7.2.6. Other End-user Industries
- 7.1. Market Analysis, Insights and Forecast - by Deployment
- 8. Asia Pacific Capacity Management Analytics Industry Analysis, Insights and Forecast, 2019-2031
- 8.1. Market Analysis, Insights and Forecast - by Deployment
- 8.1.1. On-premise
- 8.1.2. Cloud
- 8.2. Market Analysis, Insights and Forecast - by End-user Industry
- 8.2.1. IT & Telecom
- 8.2.2. Healthcare
- 8.2.3. Manufacturing
- 8.2.4. BFSI
- 8.2.5. Government
- 8.2.6. Other End-user Industries
- 8.1. Market Analysis, Insights and Forecast - by Deployment
- 9. Latin America Capacity Management Analytics Industry Analysis, Insights and Forecast, 2019-2031
- 9.1. Market Analysis, Insights and Forecast - by Deployment
- 9.1.1. On-premise
- 9.1.2. Cloud
- 9.2. Market Analysis, Insights and Forecast - by End-user Industry
- 9.2.1. IT & Telecom
- 9.2.2. Healthcare
- 9.2.3. Manufacturing
- 9.2.4. BFSI
- 9.2.5. Government
- 9.2.6. Other End-user Industries
- 9.1. Market Analysis, Insights and Forecast - by Deployment
- 10. Middle East and Africa Capacity Management Analytics Industry Analysis, Insights and Forecast, 2019-2031
- 10.1. Market Analysis, Insights and Forecast - by Deployment
- 10.1.1. On-premise
- 10.1.2. Cloud
- 10.2. Market Analysis, Insights and Forecast - by End-user Industry
- 10.2.1. IT & Telecom
- 10.2.2. Healthcare
- 10.2.3. Manufacturing
- 10.2.4. BFSI
- 10.2.5. Government
- 10.2.6. Other End-user Industries
- 10.1. Market Analysis, Insights and Forecast - by Deployment
- 11. North America Capacity Management Analytics Industry Analysis, Insights and Forecast, 2019-2031
- 11.1. Market Analysis, Insights and Forecast - By Country/Sub-region
- 11.1.1 United States
- 11.1.2 Canada
- 11.1.3 Mexico
- 12. Europe Capacity Management Analytics Industry Analysis, Insights and Forecast, 2019-2031
- 12.1. Market Analysis, Insights and Forecast - By Country/Sub-region
- 12.1.1 Germany
- 12.1.2 United Kingdom
- 12.1.3 France
- 12.1.4 Spain
- 12.1.5 Italy
- 12.1.6 Spain
- 12.1.7 Belgium
- 12.1.8 Netherland
- 12.1.9 Nordics
- 12.1.10 Rest of Europe
- 13. Asia Pacific Capacity Management Analytics Industry Analysis, Insights and Forecast, 2019-2031
- 13.1. Market Analysis, Insights and Forecast - By Country/Sub-region
- 13.1.1 China
- 13.1.2 Japan
- 13.1.3 India
- 13.1.4 South Korea
- 13.1.5 Southeast Asia
- 13.1.6 Australia
- 13.1.7 Indonesia
- 13.1.8 Phillipes
- 13.1.9 Singapore
- 13.1.10 Thailandc
- 13.1.11 Rest of Asia Pacific
- 14. South America Capacity Management Analytics Industry Analysis, Insights and Forecast, 2019-2031
- 14.1. Market Analysis, Insights and Forecast - By Country/Sub-region
- 14.1.1 Brazil
- 14.1.2 Argentina
- 14.1.3 Peru
- 14.1.4 Chile
- 14.1.5 Colombia
- 14.1.6 Ecuador
- 14.1.7 Venezuela
- 14.1.8 Rest of South America
- 15. North America Capacity Management Analytics Industry Analysis, Insights and Forecast, 2019-2031
- 15.1. Market Analysis, Insights and Forecast - By Country/Sub-region
- 15.1.1 United States
- 15.1.2 Canada
- 15.1.3 Mexico
- 16. MEA Capacity Management Analytics Industry Analysis, Insights and Forecast, 2019-2031
- 16.1. Market Analysis, Insights and Forecast - By Country/Sub-region
- 16.1.1 United Arab Emirates
- 16.1.2 Saudi Arabia
- 16.1.3 South Africa
- 16.1.4 Rest of Middle East and Africa
- 17. Competitive Analysis
- 17.1. Global Market Share Analysis 2024
- 17.2. Company Profiles
- 17.2.1 Precisely (Formerly Syncsort)
- 17.2.1.1. Overview
- 17.2.1.2. Products
- 17.2.1.3. SWOT Analysis
- 17.2.1.4. Recent Developments
- 17.2.1.5. Financials (Based on Availability)
- 17.2.2 Teoco Corporation
- 17.2.2.1. Overview
- 17.2.2.2. Products
- 17.2.2.3. SWOT Analysis
- 17.2.2.4. Recent Developments
- 17.2.2.5. Financials (Based on Availability)
- 17.2.3 IBM Corporation
- 17.2.3.1. Overview
- 17.2.3.2. Products
- 17.2.3.3. SWOT Analysis
- 17.2.3.4. Recent Developments
- 17.2.3.5. Financials (Based on Availability)
- 17.2.4 Helpsystems
- 17.2.4.1. Overview
- 17.2.4.2. Products
- 17.2.4.3. SWOT Analysis
- 17.2.4.4. Recent Developments
- 17.2.4.5. Financials (Based on Availability)
- 17.2.5 ITRS Group Ltd
- 17.2.5.1. Overview
- 17.2.5.2. Products
- 17.2.5.3. SWOT Analysis
- 17.2.5.4. Recent Developments
- 17.2.5.5. Financials (Based on Availability)
- 17.2.6 Hewlett Packard Enterprise Company
- 17.2.6.1. Overview
- 17.2.6.2. Products
- 17.2.6.3. SWOT Analysis
- 17.2.6.4. Recent Developments
- 17.2.6.5. Financials (Based on Availability)
- 17.2.7 Broadcom Inc
- 17.2.7.1. Overview
- 17.2.7.2. Products
- 17.2.7.3. SWOT Analysis
- 17.2.7.4. Recent Developments
- 17.2.7.5. Financials (Based on Availability)
- 17.2.8 BMC Software Inc
- 17.2.8.1. Overview
- 17.2.8.2. Products
- 17.2.8.3. SWOT Analysis
- 17.2.8.4. Recent Developments
- 17.2.8.5. Financials (Based on Availability)
- 17.2.9 Riverbed Technology Inc
- 17.2.9.1. Overview
- 17.2.9.2. Products
- 17.2.9.3. SWOT Analysis
- 17.2.9.4. Recent Developments
- 17.2.9.5. Financials (Based on Availability)
- 17.2.10 NetApp Inc
- 17.2.10.1. Overview
- 17.2.10.2. Products
- 17.2.10.3. SWOT Analysis
- 17.2.10.4. Recent Developments
- 17.2.10.5. Financials (Based on Availability)
- 17.2.11 CPT Global Limited*List Not Exhaustive
- 17.2.11.1. Overview
- 17.2.11.2. Products
- 17.2.11.3. SWOT Analysis
- 17.2.11.4. Recent Developments
- 17.2.11.5. Financials (Based on Availability)
- 17.2.12 VMware Inc
- 17.2.12.1. Overview
- 17.2.12.2. Products
- 17.2.12.3. SWOT Analysis
- 17.2.12.4. Recent Developments
- 17.2.12.5. Financials (Based on Availability)
- 17.2.1 Precisely (Formerly Syncsort)
List of Figures
- Figure 1: Global Capacity Management Analytics Industry Revenue Breakdown (Million, %) by Region 2024 & 2032
- Figure 2: North America Capacity Management Analytics Industry Revenue (Million), by Country 2024 & 2032
- Figure 3: North America Capacity Management Analytics Industry Revenue Share (%), by Country 2024 & 2032
- Figure 4: Europe Capacity Management Analytics Industry Revenue (Million), by Country 2024 & 2032
- Figure 5: Europe Capacity Management Analytics Industry Revenue Share (%), by Country 2024 & 2032
- Figure 6: Asia Pacific Capacity Management Analytics Industry Revenue (Million), by Country 2024 & 2032
- Figure 7: Asia Pacific Capacity Management Analytics Industry Revenue Share (%), by Country 2024 & 2032
- Figure 8: South America Capacity Management Analytics Industry Revenue (Million), by Country 2024 & 2032
- Figure 9: South America Capacity Management Analytics Industry Revenue Share (%), by Country 2024 & 2032
- Figure 10: North America Capacity Management Analytics Industry Revenue (Million), by Country 2024 & 2032
- Figure 11: North America Capacity Management Analytics Industry Revenue Share (%), by Country 2024 & 2032
- Figure 12: MEA Capacity Management Analytics Industry Revenue (Million), by Country 2024 & 2032
- Figure 13: MEA Capacity Management Analytics Industry Revenue Share (%), by Country 2024 & 2032
- Figure 14: North America Capacity Management Analytics Industry Revenue (Million), by Deployment 2024 & 2032
- Figure 15: North America Capacity Management Analytics Industry Revenue Share (%), by Deployment 2024 & 2032
- Figure 16: North America Capacity Management Analytics Industry Revenue (Million), by End-user Industry 2024 & 2032
- Figure 17: North America Capacity Management Analytics Industry Revenue Share (%), by End-user Industry 2024 & 2032
- Figure 18: North America Capacity Management Analytics Industry Revenue (Million), by Country 2024 & 2032
- Figure 19: North America Capacity Management Analytics Industry Revenue Share (%), by Country 2024 & 2032
- Figure 20: Europe Capacity Management Analytics Industry Revenue (Million), by Deployment 2024 & 2032
- Figure 21: Europe Capacity Management Analytics Industry Revenue Share (%), by Deployment 2024 & 2032
- Figure 22: Europe Capacity Management Analytics Industry Revenue (Million), by End-user Industry 2024 & 2032
- Figure 23: Europe Capacity Management Analytics Industry Revenue Share (%), by End-user Industry 2024 & 2032
- Figure 24: Europe Capacity Management Analytics Industry Revenue (Million), by Country 2024 & 2032
- Figure 25: Europe Capacity Management Analytics Industry Revenue Share (%), by Country 2024 & 2032
- Figure 26: Asia Pacific Capacity Management Analytics Industry Revenue (Million), by Deployment 2024 & 2032
- Figure 27: Asia Pacific Capacity Management Analytics Industry Revenue Share (%), by Deployment 2024 & 2032
- Figure 28: Asia Pacific Capacity Management Analytics Industry Revenue (Million), by End-user Industry 2024 & 2032
- Figure 29: Asia Pacific Capacity Management Analytics Industry Revenue Share (%), by End-user Industry 2024 & 2032
- Figure 30: Asia Pacific Capacity Management Analytics Industry Revenue (Million), by Country 2024 & 2032
- Figure 31: Asia Pacific Capacity Management Analytics Industry Revenue Share (%), by Country 2024 & 2032
- Figure 32: Latin America Capacity Management Analytics Industry Revenue (Million), by Deployment 2024 & 2032
- Figure 33: Latin America Capacity Management Analytics Industry Revenue Share (%), by Deployment 2024 & 2032
- Figure 34: Latin America Capacity Management Analytics Industry Revenue (Million), by End-user Industry 2024 & 2032
- Figure 35: Latin America Capacity Management Analytics Industry Revenue Share (%), by End-user Industry 2024 & 2032
- Figure 36: Latin America Capacity Management Analytics Industry Revenue (Million), by Country 2024 & 2032
- Figure 37: Latin America Capacity Management Analytics Industry Revenue Share (%), by Country 2024 & 2032
- Figure 38: Middle East and Africa Capacity Management Analytics Industry Revenue (Million), by Deployment 2024 & 2032
- Figure 39: Middle East and Africa Capacity Management Analytics Industry Revenue Share (%), by Deployment 2024 & 2032
- Figure 40: Middle East and Africa Capacity Management Analytics Industry Revenue (Million), by End-user Industry 2024 & 2032
- Figure 41: Middle East and Africa Capacity Management Analytics Industry Revenue Share (%), by End-user Industry 2024 & 2032
- Figure 42: Middle East and Africa Capacity Management Analytics Industry Revenue (Million), by Country 2024 & 2032
- Figure 43: Middle East and Africa Capacity Management Analytics Industry Revenue Share (%), by Country 2024 & 2032
List of Tables
- Table 1: Global Capacity Management Analytics Industry Revenue Million Forecast, by Region 2019 & 2032
- Table 2: Global Capacity Management Analytics Industry Revenue Million Forecast, by Deployment 2019 & 2032
- Table 3: Global Capacity Management Analytics Industry Revenue Million Forecast, by End-user Industry 2019 & 2032
- Table 4: Global Capacity Management Analytics Industry Revenue Million Forecast, by Region 2019 & 2032
- Table 5: Global Capacity Management Analytics Industry Revenue Million Forecast, by Country 2019 & 2032
- Table 6: United States Capacity Management Analytics Industry Revenue (Million) Forecast, by Application 2019 & 2032
- Table 7: Canada Capacity Management Analytics Industry Revenue (Million) Forecast, by Application 2019 & 2032
- Table 8: Mexico Capacity Management Analytics Industry Revenue (Million) Forecast, by Application 2019 & 2032
- Table 9: Global Capacity Management Analytics Industry Revenue Million Forecast, by Country 2019 & 2032
- Table 10: Germany Capacity Management Analytics Industry Revenue (Million) Forecast, by Application 2019 & 2032
- Table 11: United Kingdom Capacity Management Analytics Industry Revenue (Million) Forecast, by Application 2019 & 2032
- Table 12: France Capacity Management Analytics Industry Revenue (Million) Forecast, by Application 2019 & 2032
- Table 13: Spain Capacity Management Analytics Industry Revenue (Million) Forecast, by Application 2019 & 2032
- Table 14: Italy Capacity Management Analytics Industry Revenue (Million) Forecast, by Application 2019 & 2032
- Table 15: Spain Capacity Management Analytics Industry Revenue (Million) Forecast, by Application 2019 & 2032
- Table 16: Belgium Capacity Management Analytics Industry Revenue (Million) Forecast, by Application 2019 & 2032
- Table 17: Netherland Capacity Management Analytics Industry Revenue (Million) Forecast, by Application 2019 & 2032
- Table 18: Nordics Capacity Management Analytics Industry Revenue (Million) Forecast, by Application 2019 & 2032
- Table 19: Rest of Europe Capacity Management Analytics Industry Revenue (Million) Forecast, by Application 2019 & 2032
- Table 20: Global Capacity Management Analytics Industry Revenue Million Forecast, by Country 2019 & 2032
- Table 21: China Capacity Management Analytics Industry Revenue (Million) Forecast, by Application 2019 & 2032
- Table 22: Japan Capacity Management Analytics Industry Revenue (Million) Forecast, by Application 2019 & 2032
- Table 23: India Capacity Management Analytics Industry Revenue (Million) Forecast, by Application 2019 & 2032
- Table 24: South Korea Capacity Management Analytics Industry Revenue (Million) Forecast, by Application 2019 & 2032
- Table 25: Southeast Asia Capacity Management Analytics Industry Revenue (Million) Forecast, by Application 2019 & 2032
- Table 26: Australia Capacity Management Analytics Industry Revenue (Million) Forecast, by Application 2019 & 2032
- Table 27: Indonesia Capacity Management Analytics Industry Revenue (Million) Forecast, by Application 2019 & 2032
- Table 28: Phillipes Capacity Management Analytics Industry Revenue (Million) Forecast, by Application 2019 & 2032
- Table 29: Singapore Capacity Management Analytics Industry Revenue (Million) Forecast, by Application 2019 & 2032
- Table 30: Thailandc Capacity Management Analytics Industry Revenue (Million) Forecast, by Application 2019 & 2032
- Table 31: Rest of Asia Pacific Capacity Management Analytics Industry Revenue (Million) Forecast, by Application 2019 & 2032
- Table 32: Global Capacity Management Analytics Industry Revenue Million Forecast, by Country 2019 & 2032
- Table 33: Brazil Capacity Management Analytics Industry Revenue (Million) Forecast, by Application 2019 & 2032
- Table 34: Argentina Capacity Management Analytics Industry Revenue (Million) Forecast, by Application 2019 & 2032
- Table 35: Peru Capacity Management Analytics Industry Revenue (Million) Forecast, by Application 2019 & 2032
- Table 36: Chile Capacity Management Analytics Industry Revenue (Million) Forecast, by Application 2019 & 2032
- Table 37: Colombia Capacity Management Analytics Industry Revenue (Million) Forecast, by Application 2019 & 2032
- Table 38: Ecuador Capacity Management Analytics Industry Revenue (Million) Forecast, by Application 2019 & 2032
- Table 39: Venezuela Capacity Management Analytics Industry Revenue (Million) Forecast, by Application 2019 & 2032
- Table 40: Rest of South America Capacity Management Analytics Industry Revenue (Million) Forecast, by Application 2019 & 2032
- Table 41: Global Capacity Management Analytics Industry Revenue Million Forecast, by Country 2019 & 2032
- Table 42: United States Capacity Management Analytics Industry Revenue (Million) Forecast, by Application 2019 & 2032
- Table 43: Canada Capacity Management Analytics Industry Revenue (Million) Forecast, by Application 2019 & 2032
- Table 44: Mexico Capacity Management Analytics Industry Revenue (Million) Forecast, by Application 2019 & 2032
- Table 45: Global Capacity Management Analytics Industry Revenue Million Forecast, by Country 2019 & 2032
- Table 46: United Arab Emirates Capacity Management Analytics Industry Revenue (Million) Forecast, by Application 2019 & 2032
- Table 47: Saudi Arabia Capacity Management Analytics Industry Revenue (Million) Forecast, by Application 2019 & 2032
- Table 48: South Africa Capacity Management Analytics Industry Revenue (Million) Forecast, by Application 2019 & 2032
- Table 49: Rest of Middle East and Africa Capacity Management Analytics Industry Revenue (Million) Forecast, by Application 2019 & 2032
- Table 50: Global Capacity Management Analytics Industry Revenue Million Forecast, by Deployment 2019 & 2032
- Table 51: Global Capacity Management Analytics Industry Revenue Million Forecast, by End-user Industry 2019 & 2032
- Table 52: Global Capacity Management Analytics Industry Revenue Million Forecast, by Country 2019 & 2032
- Table 53: Global Capacity Management Analytics Industry Revenue Million Forecast, by Deployment 2019 & 2032
- Table 54: Global Capacity Management Analytics Industry Revenue Million Forecast, by End-user Industry 2019 & 2032
- Table 55: Global Capacity Management Analytics Industry Revenue Million Forecast, by Country 2019 & 2032
- Table 56: Global Capacity Management Analytics Industry Revenue Million Forecast, by Deployment 2019 & 2032
- Table 57: Global Capacity Management Analytics Industry Revenue Million Forecast, by End-user Industry 2019 & 2032
- Table 58: Global Capacity Management Analytics Industry Revenue Million Forecast, by Country 2019 & 2032
- Table 59: Global Capacity Management Analytics Industry Revenue Million Forecast, by Deployment 2019 & 2032
- Table 60: Global Capacity Management Analytics Industry Revenue Million Forecast, by End-user Industry 2019 & 2032
- Table 61: Global Capacity Management Analytics Industry Revenue Million Forecast, by Country 2019 & 2032
- Table 62: Global Capacity Management Analytics Industry Revenue Million Forecast, by Deployment 2019 & 2032
- Table 63: Global Capacity Management Analytics Industry Revenue Million Forecast, by End-user Industry 2019 & 2032
- Table 64: Global Capacity Management Analytics Industry Revenue Million Forecast, by Country 2019 & 2032
Frequently Asked Questions
1. What is the projected Compound Annual Growth Rate (CAGR) of the Capacity Management Analytics Industry?
The projected CAGR is approximately 18.00%.
2. Which companies are prominent players in the Capacity Management Analytics Industry?
Key companies in the market include Precisely (Formerly Syncsort), Teoco Corporation, IBM Corporation, Helpsystems, ITRS Group Ltd, Hewlett Packard Enterprise Company, Broadcom Inc, BMC Software Inc, Riverbed Technology Inc, NetApp Inc, CPT Global Limited*List Not Exhaustive, VMware Inc.
3. What are the main segments of the Capacity Management Analytics Industry?
The market segments include Deployment , End-user Industry.
4. Can you provide details about the market size?
The market size is estimated to be USD XX Million as of 2022.
5. What are some drivers contributing to market growth?
; Increasing Need for Optimization and Effective Utilization of IT Infrastructures; Increasing Complexities in IT Infrastructures.
6. What are the notable trends driving market growth?
Manufacturing Segment is Expected to Witness Significant Growth.
7. Are there any restraints impacting market growth?
; Lower Adoption Among the SMEs.
8. Can you provide examples of recent developments in the market?
N/A
9. What pricing options are available for accessing the report?
Pricing options include single-user, multi-user, and enterprise licenses priced at USD 4750, USD 5250, and USD 8750 respectively.
10. Is the market size provided in terms of value or volume?
The market size is provided in terms of value, measured in Million.
11. Are there any specific market keywords associated with the report?
Yes, the market keyword associated with the report is "Capacity Management Analytics Industry," which aids in identifying and referencing the specific market segment covered.
12. How do I determine which pricing option suits my needs best?
The pricing options vary based on user requirements and access needs. Individual users may opt for single-user licenses, while businesses requiring broader access may choose multi-user or enterprise licenses for cost-effective access to the report.
13. Are there any additional resources or data provided in the Capacity Management Analytics Industry report?
While the report offers comprehensive insights, it's advisable to review the specific contents or supplementary materials provided to ascertain if additional resources or data are available.
14. How can I stay updated on further developments or reports in the Capacity Management Analytics Industry?
To stay informed about further developments, trends, and reports in the Capacity Management Analytics Industry, consider subscribing to industry newsletters, following relevant companies and organizations, or regularly checking reputable industry news sources and publications.
Methodology
Step 1 - Identification of Relevant Samples Size from Population Database


Step 2 - Approaches for Defining Global Market Size (Value, Volume* & Price*)

Note*: In applicable scenarios
Step 3 - Data Sources
Primary Research
- Web Analytics
- Survey Reports
- Research Institute
- Latest Research Reports
- Opinion Leaders
Secondary Research
- Annual Reports
- White Paper
- Latest Press Release
- Industry Association
- Paid Database
- Investor Presentations

Step 4 - Data Triangulation
Involves using different sources of information in order to increase the validity of a study
These sources are likely to be stakeholders in a program - participants, other researchers, program staff, other community members, and so on.
Then we put all data in single framework & apply various statistical tools to find out the dynamic on the market.
During the analysis stage, feedback from the stakeholder groups would be compared to determine areas of agreement as well as areas of divergence
