

Key Insights
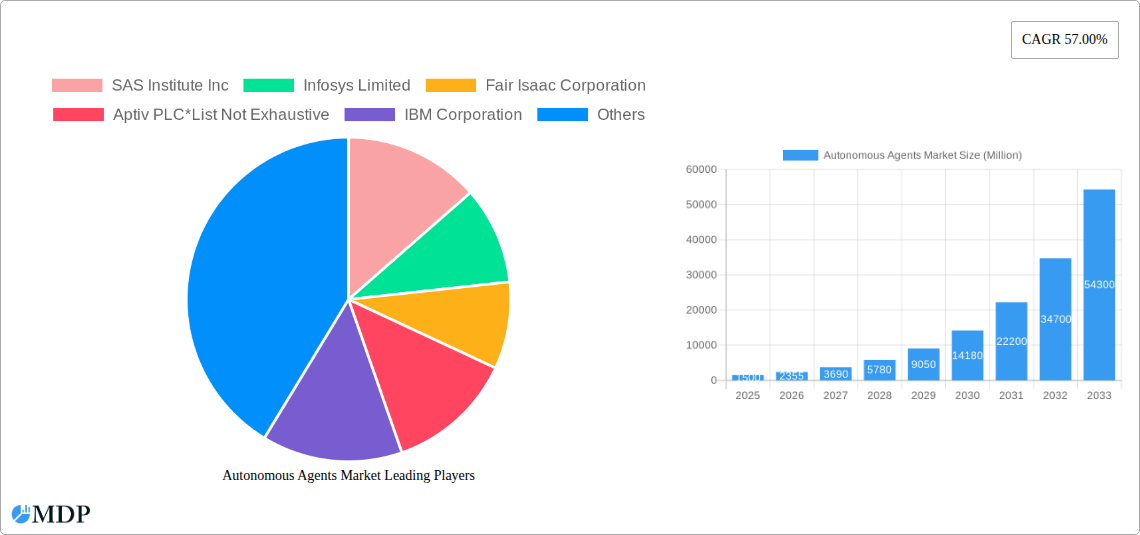
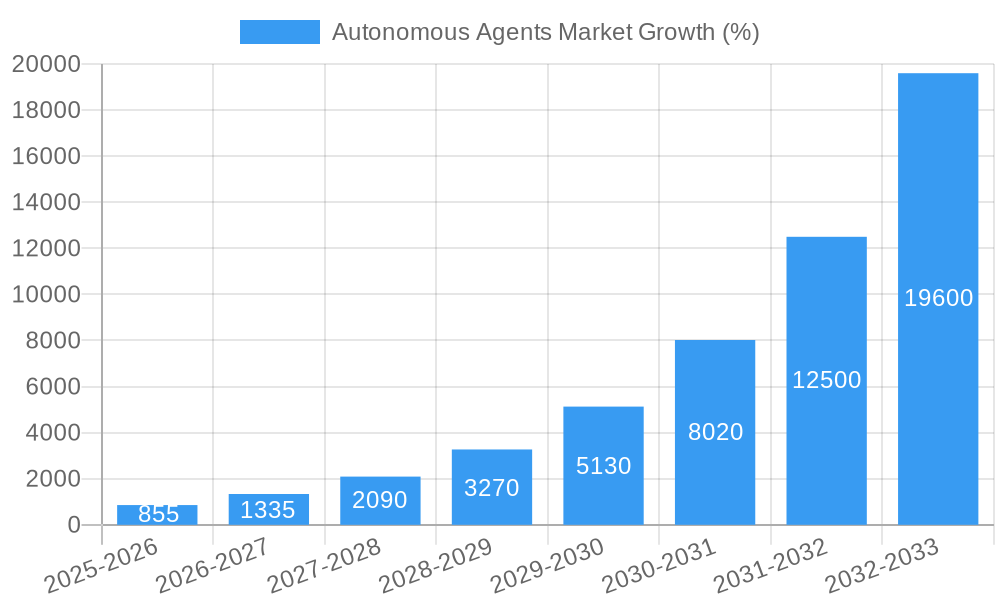
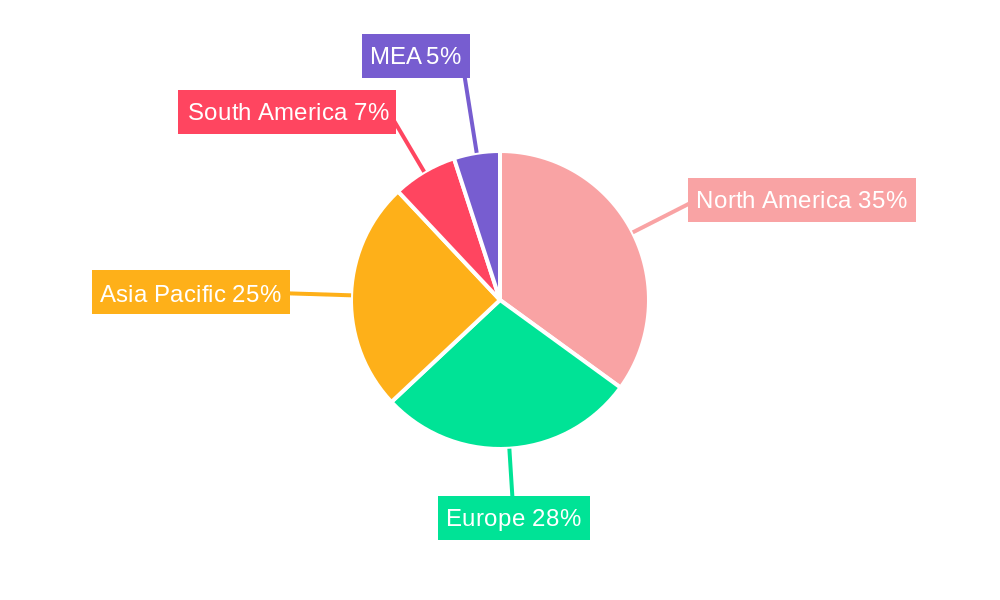
The Autonomous Agents market is experiencing explosive growth, projected to reach a substantial size, driven by the increasing demand for automation across diverse industries. The 57% CAGR indicates a rapid expansion, fueled by several key factors. The rise of cloud computing provides scalable and cost-effective infrastructure for deploying autonomous agents, while advancements in artificial intelligence and machine learning are continuously enhancing their capabilities and applications. Businesses, particularly large enterprises and those in sectors like BFSI and IT & Telecom, are adopting these agents for improved efficiency, reduced operational costs, and enhanced decision-making. The adoption is expanding to SMEs as the technology matures and becomes more accessible. While data security and ethical concerns present some restraints, ongoing technological advancements and regulatory frameworks are mitigating these risks. The market's segmentation across deployment types (cloud and on-premises), organization sizes (SMEs and large enterprises), and industry verticals reflects the wide-ranging applications of autonomous agents. Geographical distribution shows strong growth across North America and Asia Pacific, with Europe and other regions also contributing significantly. The market’s trajectory suggests a sustained period of robust growth, driven by ongoing innovation and expanding adoption across various sectors.
The competitive landscape is dynamic, with established technology giants like IBM, Google, Microsoft, and Salesforce, alongside specialized players like SAS Institute, Infosys, and Nuance Communications, vying for market share. The involvement of companies like Aptiv (automotive) and Fetch.ai (decentralized AI) showcases the diverse applications and potential of autonomous agents. Strategic partnerships, acquisitions, and continuous R&D are shaping the competitive dynamics. The future of the Autonomous Agents market looks promising, with ongoing innovation in areas such as natural language processing, computer vision, and reinforcement learning expected to further expand its capabilities and applications, leading to increased market penetration and growth across various sectors and geographies. This expansion is expected to be fueled by increasing data volumes, the need for real-time decision-making, and the desire for increased operational efficiency.
Autonomous Agents Market: A Comprehensive Report (2019-2033)
This in-depth report provides a comprehensive analysis of the Autonomous Agents Market, offering invaluable insights for stakeholders across the industry. With a focus on market dynamics, leading players, and future trends, this report is an essential resource for strategic decision-making. The study period covers 2019-2033, with a base year of 2025 and a forecast period of 2025-2033. The market is segmented by deployment type (Cloud, On-Premises), organization size (SMEs, Large Enterprises), and industry vertical (BFSI, IT & Telecom, Healthcare, Manufacturing, Transportation & Mobility, Other). Key players analyzed include SAS Institute Inc, Infosys Limited, Fair Isaac Corporation, Aptiv PLC, IBM Corporation, Google LLC, Nuance Communications, Salesforce.com Inc, Microsoft Corporation, Affectiva Inc, Amazon Web Services Inc, Fetch.ai, Oracle Corporation, Intel Corporation, and SAP SE.
Autonomous Agents Market Market Dynamics & Concentration
The Autonomous Agents market is experiencing significant growth driven by increasing demand for automation across various industries. Market concentration is moderate, with a few major players holding significant shares, while numerous smaller companies contribute to innovation. The market's dynamic nature is shaped by several factors:
- Innovation Drivers: Advancements in AI, machine learning, and natural language processing are fueling the development of sophisticated autonomous agents capable of complex tasks.
- Regulatory Frameworks: Government regulations regarding data privacy and AI ethics are influencing market growth and adoption rates. Variations in regulatory landscapes across different regions impact market expansion.
- Product Substitutes: Traditional manual processes and rule-based systems pose competition, though the increasing efficiency and cost-effectiveness of autonomous agents are driving substitution.
- End-User Trends: Businesses across sectors are increasingly adopting autonomous agents to optimize operations, improve customer experiences, and gain a competitive advantage. This trend is expected to accelerate.
- M&A Activities: The market has witnessed a moderate number of mergers and acquisitions (estimated xx deals in 2024), indicating a trend towards consolidation and expansion by key players. Market share data for leading players shows a competitive landscape with the top 5 companies holding an estimated xx% of the market share in 2025.
Autonomous Agents Market Industry Trends & Analysis
The Autonomous Agents market is projected to witness robust growth, with a CAGR of xx% during the forecast period (2025-2033). Several factors contribute to this expansion:
The market is driven by the growing adoption of cloud-based solutions, which offer scalability and cost-effectiveness. Technological advancements in AI and machine learning are continually enhancing the capabilities of autonomous agents, leading to broader applications. Consumer preferences are shifting towards personalized and automated experiences, fostering demand for intelligent agents across sectors. Intense competitive dynamics among major players are leading to innovation and price optimization, making autonomous agents more accessible. Market penetration in key sectors like BFSI and Healthcare is expected to reach xx% by 2033.
Leading Markets & Segments in Autonomous Agents Market
The North American region is currently the dominant market for autonomous agents, driven by robust technological advancements and early adoption by large enterprises. However, the Asia-Pacific region is projected to experience the fastest growth during the forecast period.
- By Deployment Type: The Cloud segment holds the largest market share, owing to its scalability, flexibility, and cost-effectiveness.
- By Organization Size: Large Enterprises are the primary adopters, driven by their significant IT budgets and the need for process automation. However, the SME segment is also showing significant growth, owing to the availability of affordable solutions and cloud-based deployments.
- By Industry Vertical: The BFSI sector is the leading adopter, owing to the need for fraud detection, risk management, and customer service automation. The Healthcare sector is also a major contributor due to the need for efficient patient management and improved diagnostics. Transportation and Mobility is emerging as a key vertical, with autonomous agents playing a crucial role in logistics and self-driving vehicles. The rapid expansion of each vertical is fuelled by factors such as robust economic policies, supportive government initiatives, and the availability of skilled workforce.
Autonomous Agents Market Product Developments
Recent product innovations include the development of more sophisticated AI algorithms, improved natural language processing capabilities, and the integration of autonomous agents with existing business systems. This has resulted in products offering enhanced automation, personalized user experiences, and improved decision-making. The market is witnessing increased focus on developing agents tailored for specific industry verticals, addressing unique challenges and opportunities.
Key Drivers of Autonomous Agents Market Growth
The market's growth is propelled by several key factors:
- Technological Advancements: Breakthroughs in AI, machine learning, and NLP are continuously enhancing the capabilities and efficiency of autonomous agents.
- Economic Factors: The need to reduce operational costs and increase efficiency is driving adoption across various sectors.
- Regulatory Support: Government initiatives promoting AI and automation are fostering market growth.
Challenges in the Autonomous Agents Market Market
Despite its potential, the market faces several challenges:
- Regulatory Hurdles: Data privacy concerns and ethical considerations surrounding AI deployment present obstacles.
- Supply Chain Issues: The availability of skilled AI professionals and specialized hardware can impact market growth.
- Competitive Pressures: The presence of established players and new entrants creates a highly competitive landscape. This has led to a decrease in profit margins, estimated at approximately xx% in 2024.
Emerging Opportunities in Autonomous Agents Market
The long-term growth prospects are promising, driven by several opportunities:
- Technological Breakthroughs: Advancements in quantum computing and edge AI are poised to revolutionize the capabilities of autonomous agents.
- Strategic Partnerships: Collaboration among technology companies and industry verticals are creating innovative solutions.
- Market Expansion: The adoption of autonomous agents is expanding into new sectors, generating substantial growth opportunities.
Leading Players in the Autonomous Agents Market Sector
- SAS Institute Inc
- Infosys Limited
- Fair Isaac Corporation
- Aptiv PLC
- IBM Corporation
- Google LLC
- Nuance Communications
- Salesforce.com Inc
- Microsoft Corporation
- Affectiva Inc
- Amazon Web Services Inc
- Fetch.ai
- Oracle Corporation
- Intel Corporation
- SAP SE
Key Milestones in Autonomous Agents Market Industry
- 2020: Increased investment in AI research and development by major technology companies.
- 2021: Launch of several cloud-based autonomous agent platforms.
- 2022: Growing adoption of autonomous agents in the BFSI sector for fraud detection.
- 2023: Significant M&A activity within the market.
- 2024: Growing regulatory focus on AI ethics and data privacy.
Strategic Outlook for Autonomous Agents Market Market
The Autonomous Agents market is poised for substantial growth, driven by continuous technological advancements and expanding adoption across various industries. Strategic partnerships and investments in research and development will be crucial for companies seeking to capitalize on emerging opportunities. The future market potential is significant, with autonomous agents becoming increasingly integrated into various aspects of daily life and business operations.
Autonomous Agents Market Segmentation
-
1. Deployment Type
- 1.1. Cloud
- 1.2. On-Premises
-
2. Organization Size
- 2.1. Small & Medium-Sized Enterprises (SMEs)
- 2.2. Large Enterprises
-
3. Industry Vertical
- 3.1. BFSI
- 3.2. IT &Telecom
- 3.3. Healthcare
- 3.4. Manufacturing
- 3.5. Transportation & Mobility
- 3.6. Other Industry Verticals
Autonomous Agents Market Segmentation By Geography
- 1. North America
- 2. Europe
- 3. Asia Pacific
- 4. Latin America
- 5. Middle East
Autonomous Agents Market REPORT HIGHLIGHTS
| Aspects | Details |
|---|---|
| Study Period | 2019-2033 |
| Base Year | 2024 |
| Estimated Year | 2025 |
| Forecast Period | 2025-2033 |
| Historical Period | 2019-2024 |
| Growth Rate | CAGR of 57.00% from 2019-2033 |
| Segmentation |
|
Table of Contents
- 1. Introduction
- 1.1. Research Scope
- 1.2. Market Segmentation
- 1.3. Research Methodology
- 1.4. Definitions and Assumptions
- 2. Executive Summary
- 2.1. Introduction
- 3. Market Dynamics
- 3.1. Introduction
- 3.2. Market Drivers
- 3.2.1. ; Rising Number of AI Applications; Growing Presence of Parallel Computational Resources
- 3.3. Market Restrains
- 3.3.1. Maintaining the Privacy and Integrity of Patient Data
- 3.4. Market Trends
- 3.4.1. Transportation and Mobility Segments to Dominate the Market
- 4. Market Factor Analysis
- 4.1. Porters Five Forces
- 4.2. Supply/Value Chain
- 4.3. PESTEL analysis
- 4.4. Market Entropy
- 4.5. Patent/Trademark Analysis
- 5. Global Autonomous Agents Market Analysis, Insights and Forecast, 2019-2031
- 5.1. Market Analysis, Insights and Forecast - by Deployment Type
- 5.1.1. Cloud
- 5.1.2. On-Premises
- 5.2. Market Analysis, Insights and Forecast - by Organization Size
- 5.2.1. Small & Medium-Sized Enterprises (SMEs)
- 5.2.2. Large Enterprises
- 5.3. Market Analysis, Insights and Forecast - by Industry Vertical
- 5.3.1. BFSI
- 5.3.2. IT &Telecom
- 5.3.3. Healthcare
- 5.3.4. Manufacturing
- 5.3.5. Transportation & Mobility
- 5.3.6. Other Industry Verticals
- 5.4. Market Analysis, Insights and Forecast - by Region
- 5.4.1. North America
- 5.4.2. Europe
- 5.4.3. Asia Pacific
- 5.4.4. Latin America
- 5.4.5. Middle East
- 5.1. Market Analysis, Insights and Forecast - by Deployment Type
- 6. North America Autonomous Agents Market Analysis, Insights and Forecast, 2019-2031
- 6.1. Market Analysis, Insights and Forecast - by Deployment Type
- 6.1.1. Cloud
- 6.1.2. On-Premises
- 6.2. Market Analysis, Insights and Forecast - by Organization Size
- 6.2.1. Small & Medium-Sized Enterprises (SMEs)
- 6.2.2. Large Enterprises
- 6.3. Market Analysis, Insights and Forecast - by Industry Vertical
- 6.3.1. BFSI
- 6.3.2. IT &Telecom
- 6.3.3. Healthcare
- 6.3.4. Manufacturing
- 6.3.5. Transportation & Mobility
- 6.3.6. Other Industry Verticals
- 6.1. Market Analysis, Insights and Forecast - by Deployment Type
- 7. Europe Autonomous Agents Market Analysis, Insights and Forecast, 2019-2031
- 7.1. Market Analysis, Insights and Forecast - by Deployment Type
- 7.1.1. Cloud
- 7.1.2. On-Premises
- 7.2. Market Analysis, Insights and Forecast - by Organization Size
- 7.2.1. Small & Medium-Sized Enterprises (SMEs)
- 7.2.2. Large Enterprises
- 7.3. Market Analysis, Insights and Forecast - by Industry Vertical
- 7.3.1. BFSI
- 7.3.2. IT &Telecom
- 7.3.3. Healthcare
- 7.3.4. Manufacturing
- 7.3.5. Transportation & Mobility
- 7.3.6. Other Industry Verticals
- 7.1. Market Analysis, Insights and Forecast - by Deployment Type
- 8. Asia Pacific Autonomous Agents Market Analysis, Insights and Forecast, 2019-2031
- 8.1. Market Analysis, Insights and Forecast - by Deployment Type
- 8.1.1. Cloud
- 8.1.2. On-Premises
- 8.2. Market Analysis, Insights and Forecast - by Organization Size
- 8.2.1. Small & Medium-Sized Enterprises (SMEs)
- 8.2.2. Large Enterprises
- 8.3. Market Analysis, Insights and Forecast - by Industry Vertical
- 8.3.1. BFSI
- 8.3.2. IT &Telecom
- 8.3.3. Healthcare
- 8.3.4. Manufacturing
- 8.3.5. Transportation & Mobility
- 8.3.6. Other Industry Verticals
- 8.1. Market Analysis, Insights and Forecast - by Deployment Type
- 9. Latin America Autonomous Agents Market Analysis, Insights and Forecast, 2019-2031
- 9.1. Market Analysis, Insights and Forecast - by Deployment Type
- 9.1.1. Cloud
- 9.1.2. On-Premises
- 9.2. Market Analysis, Insights and Forecast - by Organization Size
- 9.2.1. Small & Medium-Sized Enterprises (SMEs)
- 9.2.2. Large Enterprises
- 9.3. Market Analysis, Insights and Forecast - by Industry Vertical
- 9.3.1. BFSI
- 9.3.2. IT &Telecom
- 9.3.3. Healthcare
- 9.3.4. Manufacturing
- 9.3.5. Transportation & Mobility
- 9.3.6. Other Industry Verticals
- 9.1. Market Analysis, Insights and Forecast - by Deployment Type
- 10. Middle East Autonomous Agents Market Analysis, Insights and Forecast, 2019-2031
- 10.1. Market Analysis, Insights and Forecast - by Deployment Type
- 10.1.1. Cloud
- 10.1.2. On-Premises
- 10.2. Market Analysis, Insights and Forecast - by Organization Size
- 10.2.1. Small & Medium-Sized Enterprises (SMEs)
- 10.2.2. Large Enterprises
- 10.3. Market Analysis, Insights and Forecast - by Industry Vertical
- 10.3.1. BFSI
- 10.3.2. IT &Telecom
- 10.3.3. Healthcare
- 10.3.4. Manufacturing
- 10.3.5. Transportation & Mobility
- 10.3.6. Other Industry Verticals
- 10.1. Market Analysis, Insights and Forecast - by Deployment Type
- 11. North America Autonomous Agents Market Analysis, Insights and Forecast, 2019-2031
- 11.1. Market Analysis, Insights and Forecast - By Country/Sub-region
- 11.1.1 United States
- 11.1.2 Canada
- 11.1.3 Mexico
- 12. Europe Autonomous Agents Market Analysis, Insights and Forecast, 2019-2031
- 12.1. Market Analysis, Insights and Forecast - By Country/Sub-region
- 12.1.1 Germany
- 12.1.2 United Kingdom
- 12.1.3 France
- 12.1.4 Spain
- 12.1.5 Italy
- 12.1.6 Spain
- 12.1.7 Belgium
- 12.1.8 Netherland
- 12.1.9 Nordics
- 12.1.10 Rest of Europe
- 13. Asia Pacific Autonomous Agents Market Analysis, Insights and Forecast, 2019-2031
- 13.1. Market Analysis, Insights and Forecast - By Country/Sub-region
- 13.1.1 China
- 13.1.2 Japan
- 13.1.3 India
- 13.1.4 South Korea
- 13.1.5 Southeast Asia
- 13.1.6 Australia
- 13.1.7 Indonesia
- 13.1.8 Phillipes
- 13.1.9 Singapore
- 13.1.10 Thailandc
- 13.1.11 Rest of Asia Pacific
- 14. South America Autonomous Agents Market Analysis, Insights and Forecast, 2019-2031
- 14.1. Market Analysis, Insights and Forecast - By Country/Sub-region
- 14.1.1 Brazil
- 14.1.2 Argentina
- 14.1.3 Peru
- 14.1.4 Chile
- 14.1.5 Colombia
- 14.1.6 Ecuador
- 14.1.7 Venezuela
- 14.1.8 Rest of South America
- 15. North America Autonomous Agents Market Analysis, Insights and Forecast, 2019-2031
- 15.1. Market Analysis, Insights and Forecast - By Country/Sub-region
- 15.1.1 United States
- 15.1.2 Canada
- 15.1.3 Mexico
- 16. MEA Autonomous Agents Market Analysis, Insights and Forecast, 2019-2031
- 16.1. Market Analysis, Insights and Forecast - By Country/Sub-region
- 16.1.1 United Arab Emirates
- 16.1.2 Saudi Arabia
- 16.1.3 South Africa
- 16.1.4 Rest of Middle East and Africa
- 17. Competitive Analysis
- 17.1. Global Market Share Analysis 2024
- 17.2. Company Profiles
- 17.2.1 SAS Institute Inc
- 17.2.1.1. Overview
- 17.2.1.2. Products
- 17.2.1.3. SWOT Analysis
- 17.2.1.4. Recent Developments
- 17.2.1.5. Financials (Based on Availability)
- 17.2.2 Infosys Limited
- 17.2.2.1. Overview
- 17.2.2.2. Products
- 17.2.2.3. SWOT Analysis
- 17.2.2.4. Recent Developments
- 17.2.2.5. Financials (Based on Availability)
- 17.2.3 Fair Isaac Corporation
- 17.2.3.1. Overview
- 17.2.3.2. Products
- 17.2.3.3. SWOT Analysis
- 17.2.3.4. Recent Developments
- 17.2.3.5. Financials (Based on Availability)
- 17.2.4 Aptiv PLC*List Not Exhaustive
- 17.2.4.1. Overview
- 17.2.4.2. Products
- 17.2.4.3. SWOT Analysis
- 17.2.4.4. Recent Developments
- 17.2.4.5. Financials (Based on Availability)
- 17.2.5 IBM Corporation
- 17.2.5.1. Overview
- 17.2.5.2. Products
- 17.2.5.3. SWOT Analysis
- 17.2.5.4. Recent Developments
- 17.2.5.5. Financials (Based on Availability)
- 17.2.6 Google LLC
- 17.2.6.1. Overview
- 17.2.6.2. Products
- 17.2.6.3. SWOT Analysis
- 17.2.6.4. Recent Developments
- 17.2.6.5. Financials (Based on Availability)
- 17.2.7 Nuance Communications
- 17.2.7.1. Overview
- 17.2.7.2. Products
- 17.2.7.3. SWOT Analysis
- 17.2.7.4. Recent Developments
- 17.2.7.5. Financials (Based on Availability)
- 17.2.8 Salesforce com Inc
- 17.2.8.1. Overview
- 17.2.8.2. Products
- 17.2.8.3. SWOT Analysis
- 17.2.8.4. Recent Developments
- 17.2.8.5. Financials (Based on Availability)
- 17.2.9 Microsoft Corporation
- 17.2.9.1. Overview
- 17.2.9.2. Products
- 17.2.9.3. SWOT Analysis
- 17.2.9.4. Recent Developments
- 17.2.9.5. Financials (Based on Availability)
- 17.2.10 Affectiva Inc
- 17.2.10.1. Overview
- 17.2.10.2. Products
- 17.2.10.3. SWOT Analysis
- 17.2.10.4. Recent Developments
- 17.2.10.5. Financials (Based on Availability)
- 17.2.11 Amazon Web Services Inc
- 17.2.11.1. Overview
- 17.2.11.2. Products
- 17.2.11.3. SWOT Analysis
- 17.2.11.4. Recent Developments
- 17.2.11.5. Financials (Based on Availability)
- 17.2.12 Fetch ai
- 17.2.12.1. Overview
- 17.2.12.2. Products
- 17.2.12.3. SWOT Analysis
- 17.2.12.4. Recent Developments
- 17.2.12.5. Financials (Based on Availability)
- 17.2.13 Oracle Corporation
- 17.2.13.1. Overview
- 17.2.13.2. Products
- 17.2.13.3. SWOT Analysis
- 17.2.13.4. Recent Developments
- 17.2.13.5. Financials (Based on Availability)
- 17.2.14 Intel Corporation
- 17.2.14.1. Overview
- 17.2.14.2. Products
- 17.2.14.3. SWOT Analysis
- 17.2.14.4. Recent Developments
- 17.2.14.5. Financials (Based on Availability)
- 17.2.15 SAP SE
- 17.2.15.1. Overview
- 17.2.15.2. Products
- 17.2.15.3. SWOT Analysis
- 17.2.15.4. Recent Developments
- 17.2.15.5. Financials (Based on Availability)
- 17.2.1 SAS Institute Inc
List of Figures
- Figure 1: Global Autonomous Agents Market Revenue Breakdown (Million, %) by Region 2024 & 2032
- Figure 2: North America Autonomous Agents Market Revenue (Million), by Country 2024 & 2032
- Figure 3: North America Autonomous Agents Market Revenue Share (%), by Country 2024 & 2032
- Figure 4: Europe Autonomous Agents Market Revenue (Million), by Country 2024 & 2032
- Figure 5: Europe Autonomous Agents Market Revenue Share (%), by Country 2024 & 2032
- Figure 6: Asia Pacific Autonomous Agents Market Revenue (Million), by Country 2024 & 2032
- Figure 7: Asia Pacific Autonomous Agents Market Revenue Share (%), by Country 2024 & 2032
- Figure 8: South America Autonomous Agents Market Revenue (Million), by Country 2024 & 2032
- Figure 9: South America Autonomous Agents Market Revenue Share (%), by Country 2024 & 2032
- Figure 10: North America Autonomous Agents Market Revenue (Million), by Country 2024 & 2032
- Figure 11: North America Autonomous Agents Market Revenue Share (%), by Country 2024 & 2032
- Figure 12: MEA Autonomous Agents Market Revenue (Million), by Country 2024 & 2032
- Figure 13: MEA Autonomous Agents Market Revenue Share (%), by Country 2024 & 2032
- Figure 14: North America Autonomous Agents Market Revenue (Million), by Deployment Type 2024 & 2032
- Figure 15: North America Autonomous Agents Market Revenue Share (%), by Deployment Type 2024 & 2032
- Figure 16: North America Autonomous Agents Market Revenue (Million), by Organization Size 2024 & 2032
- Figure 17: North America Autonomous Agents Market Revenue Share (%), by Organization Size 2024 & 2032
- Figure 18: North America Autonomous Agents Market Revenue (Million), by Industry Vertical 2024 & 2032
- Figure 19: North America Autonomous Agents Market Revenue Share (%), by Industry Vertical 2024 & 2032
- Figure 20: North America Autonomous Agents Market Revenue (Million), by Country 2024 & 2032
- Figure 21: North America Autonomous Agents Market Revenue Share (%), by Country 2024 & 2032
- Figure 22: Europe Autonomous Agents Market Revenue (Million), by Deployment Type 2024 & 2032
- Figure 23: Europe Autonomous Agents Market Revenue Share (%), by Deployment Type 2024 & 2032
- Figure 24: Europe Autonomous Agents Market Revenue (Million), by Organization Size 2024 & 2032
- Figure 25: Europe Autonomous Agents Market Revenue Share (%), by Organization Size 2024 & 2032
- Figure 26: Europe Autonomous Agents Market Revenue (Million), by Industry Vertical 2024 & 2032
- Figure 27: Europe Autonomous Agents Market Revenue Share (%), by Industry Vertical 2024 & 2032
- Figure 28: Europe Autonomous Agents Market Revenue (Million), by Country 2024 & 2032
- Figure 29: Europe Autonomous Agents Market Revenue Share (%), by Country 2024 & 2032
- Figure 30: Asia Pacific Autonomous Agents Market Revenue (Million), by Deployment Type 2024 & 2032
- Figure 31: Asia Pacific Autonomous Agents Market Revenue Share (%), by Deployment Type 2024 & 2032
- Figure 32: Asia Pacific Autonomous Agents Market Revenue (Million), by Organization Size 2024 & 2032
- Figure 33: Asia Pacific Autonomous Agents Market Revenue Share (%), by Organization Size 2024 & 2032
- Figure 34: Asia Pacific Autonomous Agents Market Revenue (Million), by Industry Vertical 2024 & 2032
- Figure 35: Asia Pacific Autonomous Agents Market Revenue Share (%), by Industry Vertical 2024 & 2032
- Figure 36: Asia Pacific Autonomous Agents Market Revenue (Million), by Country 2024 & 2032
- Figure 37: Asia Pacific Autonomous Agents Market Revenue Share (%), by Country 2024 & 2032
- Figure 38: Latin America Autonomous Agents Market Revenue (Million), by Deployment Type 2024 & 2032
- Figure 39: Latin America Autonomous Agents Market Revenue Share (%), by Deployment Type 2024 & 2032
- Figure 40: Latin America Autonomous Agents Market Revenue (Million), by Organization Size 2024 & 2032
- Figure 41: Latin America Autonomous Agents Market Revenue Share (%), by Organization Size 2024 & 2032
- Figure 42: Latin America Autonomous Agents Market Revenue (Million), by Industry Vertical 2024 & 2032
- Figure 43: Latin America Autonomous Agents Market Revenue Share (%), by Industry Vertical 2024 & 2032
- Figure 44: Latin America Autonomous Agents Market Revenue (Million), by Country 2024 & 2032
- Figure 45: Latin America Autonomous Agents Market Revenue Share (%), by Country 2024 & 2032
- Figure 46: Middle East Autonomous Agents Market Revenue (Million), by Deployment Type 2024 & 2032
- Figure 47: Middle East Autonomous Agents Market Revenue Share (%), by Deployment Type 2024 & 2032
- Figure 48: Middle East Autonomous Agents Market Revenue (Million), by Organization Size 2024 & 2032
- Figure 49: Middle East Autonomous Agents Market Revenue Share (%), by Organization Size 2024 & 2032
- Figure 50: Middle East Autonomous Agents Market Revenue (Million), by Industry Vertical 2024 & 2032
- Figure 51: Middle East Autonomous Agents Market Revenue Share (%), by Industry Vertical 2024 & 2032
- Figure 52: Middle East Autonomous Agents Market Revenue (Million), by Country 2024 & 2032
- Figure 53: Middle East Autonomous Agents Market Revenue Share (%), by Country 2024 & 2032
List of Tables
- Table 1: Global Autonomous Agents Market Revenue Million Forecast, by Region 2019 & 2032
- Table 2: Global Autonomous Agents Market Revenue Million Forecast, by Deployment Type 2019 & 2032
- Table 3: Global Autonomous Agents Market Revenue Million Forecast, by Organization Size 2019 & 2032
- Table 4: Global Autonomous Agents Market Revenue Million Forecast, by Industry Vertical 2019 & 2032
- Table 5: Global Autonomous Agents Market Revenue Million Forecast, by Region 2019 & 2032
- Table 6: Global Autonomous Agents Market Revenue Million Forecast, by Country 2019 & 2032
- Table 7: United States Autonomous Agents Market Revenue (Million) Forecast, by Application 2019 & 2032
- Table 8: Canada Autonomous Agents Market Revenue (Million) Forecast, by Application 2019 & 2032
- Table 9: Mexico Autonomous Agents Market Revenue (Million) Forecast, by Application 2019 & 2032
- Table 10: Global Autonomous Agents Market Revenue Million Forecast, by Country 2019 & 2032
- Table 11: Germany Autonomous Agents Market Revenue (Million) Forecast, by Application 2019 & 2032
- Table 12: United Kingdom Autonomous Agents Market Revenue (Million) Forecast, by Application 2019 & 2032
- Table 13: France Autonomous Agents Market Revenue (Million) Forecast, by Application 2019 & 2032
- Table 14: Spain Autonomous Agents Market Revenue (Million) Forecast, by Application 2019 & 2032
- Table 15: Italy Autonomous Agents Market Revenue (Million) Forecast, by Application 2019 & 2032
- Table 16: Spain Autonomous Agents Market Revenue (Million) Forecast, by Application 2019 & 2032
- Table 17: Belgium Autonomous Agents Market Revenue (Million) Forecast, by Application 2019 & 2032
- Table 18: Netherland Autonomous Agents Market Revenue (Million) Forecast, by Application 2019 & 2032
- Table 19: Nordics Autonomous Agents Market Revenue (Million) Forecast, by Application 2019 & 2032
- Table 20: Rest of Europe Autonomous Agents Market Revenue (Million) Forecast, by Application 2019 & 2032
- Table 21: Global Autonomous Agents Market Revenue Million Forecast, by Country 2019 & 2032
- Table 22: China Autonomous Agents Market Revenue (Million) Forecast, by Application 2019 & 2032
- Table 23: Japan Autonomous Agents Market Revenue (Million) Forecast, by Application 2019 & 2032
- Table 24: India Autonomous Agents Market Revenue (Million) Forecast, by Application 2019 & 2032
- Table 25: South Korea Autonomous Agents Market Revenue (Million) Forecast, by Application 2019 & 2032
- Table 26: Southeast Asia Autonomous Agents Market Revenue (Million) Forecast, by Application 2019 & 2032
- Table 27: Australia Autonomous Agents Market Revenue (Million) Forecast, by Application 2019 & 2032
- Table 28: Indonesia Autonomous Agents Market Revenue (Million) Forecast, by Application 2019 & 2032
- Table 29: Phillipes Autonomous Agents Market Revenue (Million) Forecast, by Application 2019 & 2032
- Table 30: Singapore Autonomous Agents Market Revenue (Million) Forecast, by Application 2019 & 2032
- Table 31: Thailandc Autonomous Agents Market Revenue (Million) Forecast, by Application 2019 & 2032
- Table 32: Rest of Asia Pacific Autonomous Agents Market Revenue (Million) Forecast, by Application 2019 & 2032
- Table 33: Global Autonomous Agents Market Revenue Million Forecast, by Country 2019 & 2032
- Table 34: Brazil Autonomous Agents Market Revenue (Million) Forecast, by Application 2019 & 2032
- Table 35: Argentina Autonomous Agents Market Revenue (Million) Forecast, by Application 2019 & 2032
- Table 36: Peru Autonomous Agents Market Revenue (Million) Forecast, by Application 2019 & 2032
- Table 37: Chile Autonomous Agents Market Revenue (Million) Forecast, by Application 2019 & 2032
- Table 38: Colombia Autonomous Agents Market Revenue (Million) Forecast, by Application 2019 & 2032
- Table 39: Ecuador Autonomous Agents Market Revenue (Million) Forecast, by Application 2019 & 2032
- Table 40: Venezuela Autonomous Agents Market Revenue (Million) Forecast, by Application 2019 & 2032
- Table 41: Rest of South America Autonomous Agents Market Revenue (Million) Forecast, by Application 2019 & 2032
- Table 42: Global Autonomous Agents Market Revenue Million Forecast, by Country 2019 & 2032
- Table 43: United States Autonomous Agents Market Revenue (Million) Forecast, by Application 2019 & 2032
- Table 44: Canada Autonomous Agents Market Revenue (Million) Forecast, by Application 2019 & 2032
- Table 45: Mexico Autonomous Agents Market Revenue (Million) Forecast, by Application 2019 & 2032
- Table 46: Global Autonomous Agents Market Revenue Million Forecast, by Country 2019 & 2032
- Table 47: United Arab Emirates Autonomous Agents Market Revenue (Million) Forecast, by Application 2019 & 2032
- Table 48: Saudi Arabia Autonomous Agents Market Revenue (Million) Forecast, by Application 2019 & 2032
- Table 49: South Africa Autonomous Agents Market Revenue (Million) Forecast, by Application 2019 & 2032
- Table 50: Rest of Middle East and Africa Autonomous Agents Market Revenue (Million) Forecast, by Application 2019 & 2032
- Table 51: Global Autonomous Agents Market Revenue Million Forecast, by Deployment Type 2019 & 2032
- Table 52: Global Autonomous Agents Market Revenue Million Forecast, by Organization Size 2019 & 2032
- Table 53: Global Autonomous Agents Market Revenue Million Forecast, by Industry Vertical 2019 & 2032
- Table 54: Global Autonomous Agents Market Revenue Million Forecast, by Country 2019 & 2032
- Table 55: Global Autonomous Agents Market Revenue Million Forecast, by Deployment Type 2019 & 2032
- Table 56: Global Autonomous Agents Market Revenue Million Forecast, by Organization Size 2019 & 2032
- Table 57: Global Autonomous Agents Market Revenue Million Forecast, by Industry Vertical 2019 & 2032
- Table 58: Global Autonomous Agents Market Revenue Million Forecast, by Country 2019 & 2032
- Table 59: Global Autonomous Agents Market Revenue Million Forecast, by Deployment Type 2019 & 2032
- Table 60: Global Autonomous Agents Market Revenue Million Forecast, by Organization Size 2019 & 2032
- Table 61: Global Autonomous Agents Market Revenue Million Forecast, by Industry Vertical 2019 & 2032
- Table 62: Global Autonomous Agents Market Revenue Million Forecast, by Country 2019 & 2032
- Table 63: Global Autonomous Agents Market Revenue Million Forecast, by Deployment Type 2019 & 2032
- Table 64: Global Autonomous Agents Market Revenue Million Forecast, by Organization Size 2019 & 2032
- Table 65: Global Autonomous Agents Market Revenue Million Forecast, by Industry Vertical 2019 & 2032
- Table 66: Global Autonomous Agents Market Revenue Million Forecast, by Country 2019 & 2032
- Table 67: Global Autonomous Agents Market Revenue Million Forecast, by Deployment Type 2019 & 2032
- Table 68: Global Autonomous Agents Market Revenue Million Forecast, by Organization Size 2019 & 2032
- Table 69: Global Autonomous Agents Market Revenue Million Forecast, by Industry Vertical 2019 & 2032
- Table 70: Global Autonomous Agents Market Revenue Million Forecast, by Country 2019 & 2032
Frequently Asked Questions
1. What is the projected Compound Annual Growth Rate (CAGR) of the Autonomous Agents Market?
The projected CAGR is approximately 57.00%.
2. Which companies are prominent players in the Autonomous Agents Market?
Key companies in the market include SAS Institute Inc, Infosys Limited, Fair Isaac Corporation, Aptiv PLC*List Not Exhaustive, IBM Corporation, Google LLC, Nuance Communications, Salesforce com Inc, Microsoft Corporation, Affectiva Inc, Amazon Web Services Inc, Fetch ai, Oracle Corporation, Intel Corporation, SAP SE.
3. What are the main segments of the Autonomous Agents Market?
The market segments include Deployment Type, Organization Size, Industry Vertical.
4. Can you provide details about the market size?
The market size is estimated to be USD XX Million as of 2022.
5. What are some drivers contributing to market growth?
; Rising Number of AI Applications; Growing Presence of Parallel Computational Resources.
6. What are the notable trends driving market growth?
Transportation and Mobility Segments to Dominate the Market.
7. Are there any restraints impacting market growth?
Maintaining the Privacy and Integrity of Patient Data.
8. Can you provide examples of recent developments in the market?
N/A
9. What pricing options are available for accessing the report?
Pricing options include single-user, multi-user, and enterprise licenses priced at USD 4750, USD 5250, and USD 8750 respectively.
10. Is the market size provided in terms of value or volume?
The market size is provided in terms of value, measured in Million.
11. Are there any specific market keywords associated with the report?
Yes, the market keyword associated with the report is "Autonomous Agents Market," which aids in identifying and referencing the specific market segment covered.
12. How do I determine which pricing option suits my needs best?
The pricing options vary based on user requirements and access needs. Individual users may opt for single-user licenses, while businesses requiring broader access may choose multi-user or enterprise licenses for cost-effective access to the report.
13. Are there any additional resources or data provided in the Autonomous Agents Market report?
While the report offers comprehensive insights, it's advisable to review the specific contents or supplementary materials provided to ascertain if additional resources or data are available.
14. How can I stay updated on further developments or reports in the Autonomous Agents Market?
To stay informed about further developments, trends, and reports in the Autonomous Agents Market, consider subscribing to industry newsletters, following relevant companies and organizations, or regularly checking reputable industry news sources and publications.
Methodology
Step 1 - Identification of Relevant Samples Size from Population Database


Step 2 - Approaches for Defining Global Market Size (Value, Volume* & Price*)

Note*: In applicable scenarios
Step 3 - Data Sources
Primary Research
- Web Analytics
- Survey Reports
- Research Institute
- Latest Research Reports
- Opinion Leaders
Secondary Research
- Annual Reports
- White Paper
- Latest Press Release
- Industry Association
- Paid Database
- Investor Presentations

Step 4 - Data Triangulation
Involves using different sources of information in order to increase the validity of a study
These sources are likely to be stakeholders in a program - participants, other researchers, program staff, other community members, and so on.
Then we put all data in single framework & apply various statistical tools to find out the dynamic on the market.
During the analysis stage, feedback from the stakeholder groups would be compared to determine areas of agreement as well as areas of divergence
