

Key Insights
The automotive data logging market is experiencing robust growth, driven by the increasing need for advanced driver-assistance systems (ADAS), stringent emission regulations, and the rising demand for connected and autonomous vehicles. The market's Compound Annual Growth Rate (CAGR) of 7.40% from 2019 to 2024 indicates a significant upward trajectory, projected to continue into the forecast period (2025-2033). Key segments driving this growth include the adoption of web-based data logging systems for remote monitoring and analysis, the increasing utilization of multi-channel data loggers for comprehensive vehicle performance data capture, and a strong demand for temperature, pressure, and voltage data logging in various automotive applications. Major players like National Instruments, Bosch, and Keysight Technologies are actively contributing to market expansion through continuous innovation and the development of sophisticated data logging solutions. The prevalence of USB data loggers currently dominates, but wireless and Bluetooth-enabled options are gaining traction due to their improved convenience and remote accessibility. The automotive sector's focus on enhancing vehicle safety, optimizing performance, and improving fuel efficiency further fuels the market's expansion.
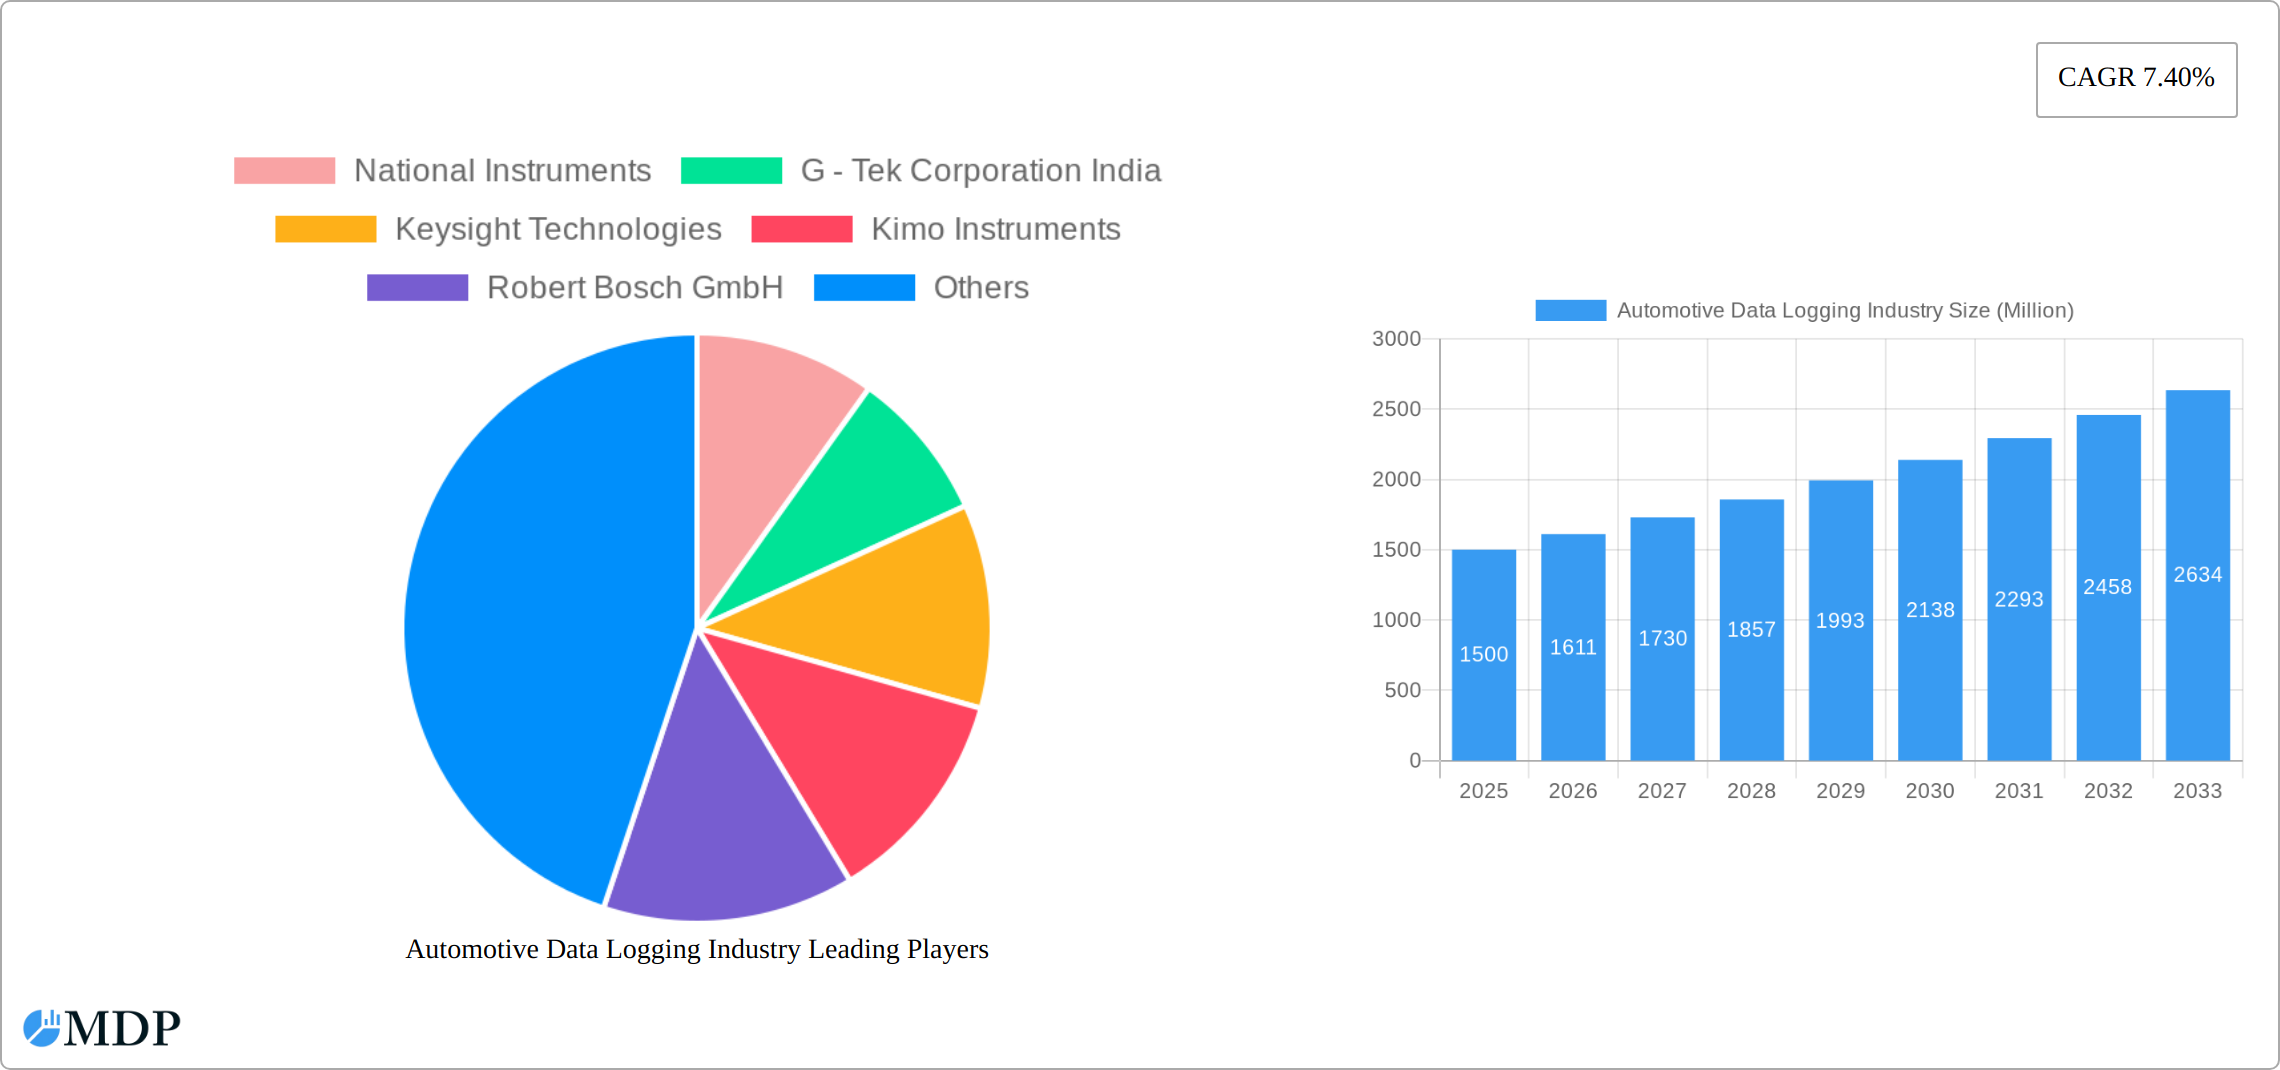
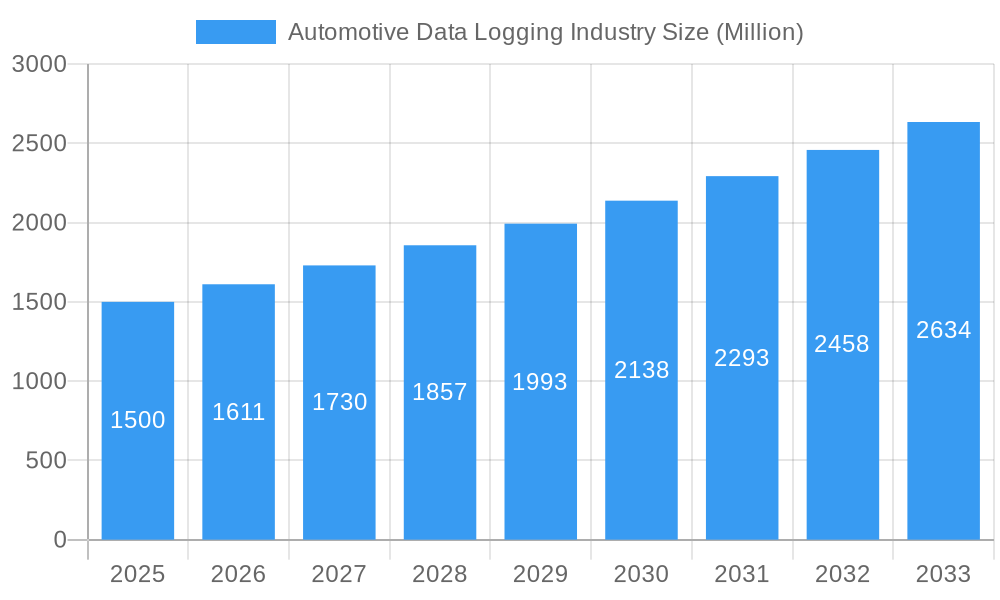
Automotive Data Logging Industry Market Size (In Billion)
Geographic growth is anticipated to be diverse, with North America and Europe maintaining strong positions due to established automotive industries and early adoption of advanced technologies. However, the Asia-Pacific region is poised for significant growth, driven by increasing vehicle production and the expansion of the automotive sector in rapidly developing economies. The market faces some restraints, primarily related to the high initial investment costs associated with implementing sophisticated data logging systems and the need for skilled personnel to manage and interpret the vast amounts of data generated. Nevertheless, the long-term benefits in terms of improved vehicle safety, reduced development time, and enhanced performance are compelling factors overcoming these challenges. The overall market trend points towards a continuous expansion, with an increasing focus on data analytics and the integration of artificial intelligence (AI) for more efficient data processing and insightful decision-making within the automotive industry.
Automotive Data Logging Industry Company Market Share
Automotive Data Logging Industry Market Report: 2019-2033
This comprehensive report provides an in-depth analysis of the Automotive Data Logging Industry, projecting a market value of $XX Million by 2033. It covers market dynamics, trends, leading players, and future opportunities, offering invaluable insights for stakeholders across the automotive, manufacturing, and other sectors. The report's detailed segmentation and forecast, spanning the period 2019-2033 (base year 2025), equips businesses with the knowledge needed to make strategic decisions and capitalize on emerging growth avenues.
Automotive Data Logging Industry Market Dynamics & Concentration
The Automotive Data Logging Industry is experiencing robust growth, projected to reach $XX Million by 2025. The market exhibits a moderately concentrated structure, where established leaders like National Instruments, Keysight Technologies, Robert Bosch GmbH, and Yokogawa Electric Company collectively command a significant market share, estimated at approximately XX%. This concentration is balanced by a vibrant ecosystem of smaller, agile, specialized players, particularly successful in addressing niche application requirements and emerging market segments. A primary catalyst for this expansion is the relentless drive for innovation in data acquisition technologies, fueled by the imperative to enhance vehicle performance, optimize fuel efficiency, and bolster safety features. Furthermore, increasingly stringent global regulatory standards concerning vehicle emissions, safety, and diagnostic reporting are not only shaping product development strategies but also accelerating the adoption of sophisticated data logging solutions. The industry is also characterized by a dynamic M&A landscape, with an estimated XX mergers and acquisitions transpiring over the past five years, indicative of ongoing consolidation and strategic realignment. While cloud-based data analysis platforms present a moderate competitive threat as product substitutes, the escalating demand for advanced, real-time data logging capabilities across the automotive value chain remains a paramount growth driver.
- Market Concentration: Moderately concentrated, with top-tier players holding approximately XX% of the global market share.
- Key Innovation Drivers: The pursuit of enhanced vehicle performance metrics, stringent safety regulations, evolving autonomous driving technologies, and the burgeoning need for sophisticated data analytics and insights.
- Regulatory Frameworks: A landscape dominated by stringent emission control standards (e.g., Euro 7, EPA regulations) and evolving safety mandates, which are actively driving the adoption of advanced, compliant data logging solutions.
- M&A Activity: The past five years have witnessed a notable trend of consolidation, with approximately XX strategic mergers and acquisitions aimed at expanding market reach and technological capabilities.
- End-User Trends: A pronounced shift towards the demand for real-time data analysis, predictive maintenance capabilities, and integrated vehicle diagnostics, directly supporting a more efficient and proactive automotive ecosystem.
Automotive Data Logging Industry Industry Trends & Analysis
The Automotive Data Logging Industry is experiencing robust growth, with a projected CAGR of XX% from 2025 to 2033. Several factors fuel this expansion, including the increasing adoption of electric and autonomous vehicles, which necessitate sophisticated data logging for performance optimization and safety validation. Technological advancements, such as the development of more efficient and compact data loggers with improved connectivity options (Bluetooth, Wi-Fi, and cellular), are driving market penetration. The preference for multi-channel data loggers capable of capturing various parameters simultaneously is also growing. Competitive dynamics are intense, with established players focusing on innovation and strategic partnerships to maintain their market leadership. The market penetration of wireless data logging systems is steadily increasing, driven by the advantages of remote monitoring and reduced installation complexity. Consumer preferences are shifting towards solutions offering seamless integration with existing vehicle systems and cloud-based data analytics platforms.
Leading Markets & Segments in Automotive Data Logging Industry
The automotive segment remains the dominant force within the Automotive Data Logging Industry, representing an estimated XX% of the total market share in 2025. Geographically, North America and Europe continue to lead, primarily due to their robust automotive manufacturing bases, substantial investments in R&D, and the presence of stringent, well-established regulatory frameworks that mandate data logging for compliance and performance monitoring. Within deployment types, wireless and web-based systems are experiencing significant growth, attributed to their inherent advantages in convenience, accessibility, and the enablement of remote data collection and analysis. The preference for multi-channel data loggers is widespread, as they offer the capability to capture a comprehensive and granular dataset essential for complex automotive diagnostics and development. Among the input parameters, temperature, pressure, and voltage consistently emerge as the most frequently monitored variables, reflecting their critical importance in vehicle operation and performance.
- Market Share by End-user Industry: Automotive (estimated XX%), Manufacturing (estimated XX%), Oil & Gas (estimated XX%), Power & Utilities (estimated XX%), and Other Industries (estimated XX%).
- Key Growth Drivers (Automotive Segment): The escalating adoption of electric vehicles (EVs) and their associated battery management systems, the rapid advancement and integration of autonomous driving technologies, and the continuous pressure from stringent emission regulations.
- Key Growth Drivers (Manufacturing Segment): The imperative for optimizing production processes, enhancing operational efficiency, and implementing predictive maintenance strategies to minimize downtime.
- By Deployment Type: Wireless solutions are exhibiting rapid adoption rates, complemented by a steadily increasing integration of web-based systems for enhanced accessibility and data management.
- By Channel Configuration: Multi-channel data loggers continue to dominate the market, offering superior data capture capabilities for intricate applications.
- By Input Parameter: The highest demand is consistently observed for sensors and logging capabilities related to temperature, pressure, and voltage measurements.
Automotive Data Logging Industry Product Developments
Recent product innovations focus on miniaturization, enhanced data processing capabilities, and improved connectivity. Data loggers with integrated GPS, higher sampling rates, and advanced data security features are gaining popularity. The integration of artificial intelligence (AI) and machine learning (ML) algorithms for real-time data analysis and predictive maintenance is a significant trend. These advancements enhance the value proposition for end-users by improving efficiency, reducing operational costs, and optimizing performance.
Key Drivers of Automotive Data Logging Industry Growth
Several factors contribute to the industry's growth. Technological advancements, including miniaturization, improved data processing, and wireless connectivity, are significantly enhancing the capabilities of data loggers. Stringent government regulations on vehicle emissions and safety are driving the adoption of advanced data logging systems for compliance and performance monitoring. The increasing demand for efficient fleet management and predictive maintenance solutions further fuels industry growth.
Challenges in the Automotive Data Logging Industry Market
The Automotive Data Logging Industry navigates several significant challenges. The high initial investment costs associated with acquiring and implementing advanced, feature-rich data logging systems can be a barrier for some organizations. Furthermore, the complexity of integrating these sophisticated data loggers seamlessly with existing vehicle architectures and diverse electronic control units (ECUs) presents a substantial technical hurdle. Data security and privacy concerns are also paramount, especially with the increasing volume and sensitivity of data being collected. The industry also contends with the volatile nature of global supply chain disruptions, which can impact the availability and cost of critical components. Intensified competition, not only from established giants but also from agile emerging players and software-focused companies, adds another layer of pressure. Finally, the necessity for continuous regulatory compliance demands ongoing adaptation, investment in updated technologies, and rigorous adherence to evolving standards.
Emerging Opportunities in Automotive Data Logging Industry
The industry presents significant long-term growth opportunities. Technological advancements such as the Internet of Things (IoT) integration and the use of AI/ML for predictive analysis are creating new avenues for market expansion. Strategic partnerships between data logger manufacturers and automotive companies are creating robust, scalable solutions. The growth of connected vehicles and the expansion into new end-user industries, such as renewable energy and smart infrastructure, are also catalysts for future growth.
Leading Players in the Automotive Data Logging Industry Sector
- National Instruments
- G - Tek Corporation India
- Keysight Technologies
- Kimo Instruments
- Robert Bosch GmbH
- Thermo Fisher Scientific
- Yokogawa Electric Company
- HIOKI E E Corporation
- ABB
Key Milestones in Automotive Data Logging Industry Industry
- 2020: Introduction of a new generation of compact data loggers with enhanced wireless capabilities by Keysight Technologies.
- 2022: National Instruments launched an advanced data acquisition system with AI-powered analytics.
- 2023: A major merger between two smaller data logging companies resulted in expanded market reach. (Specific details not available, placeholder for actual data)
Strategic Outlook for Automotive Data Logging Industry Market
The Automotive Data Logging Industry is strategically positioned for substantial and sustained growth. This trajectory is underpinned by a confluence of factors: accelerating technological innovation, the relentless push for higher levels of regulatory compliance, and the continuous expansion of data logging applications into emerging automotive domains such as advanced driver-assistance systems (ADAS) and vehicle-to-everything (V2X) communication. Companies that prioritize the development of highly integrated, user-friendly, and demonstrably cost-effective solutions are poised to capture significant market share and build a strong competitive advantage. The industry landscape will continue to be shaped by strategic partnerships and acquisitions, offering fertile ground for both established leaders to consolidate their positions and for innovative new entrants to gain traction. A critical focus for all players will be on fortifying data security protocols, ensuring seamless integration with existing automotive IT infrastructure, and leveraging the power of Artificial Intelligence (AI) and Machine Learning (ML) to unlock deeper, more actionable insights from the vast amounts of vehicle data generated.
Automotive Data Logging Industry Segmentation
-
1. Deployment
- 1.1. USB Data
- 1.2. Bluetooth Enabled Logger
- 1.3. Web-based Systems
- 1.4. Wireless
-
2. Channel
- 2.1. Single Channel
- 2.2. Multi-Channel
-
3. Input Parameter
- 3.1. Temperature
- 3.2. Pressure
- 3.3. Humidity
- 3.4. Voltage
- 3.5. Other Input Parameters
-
4. End-user Industry
- 4.1. Oil & Gas
- 4.2. Manufacturing
- 4.3. Automotive
- 4.4. Power & Utilities
- 4.5. Other End-user Industries
Automotive Data Logging Industry Segmentation By Geography
- 1. North America
- 2. Europe
- 3. Asia Pacific
- 4. Latin America
- 5. Middle East and Africa
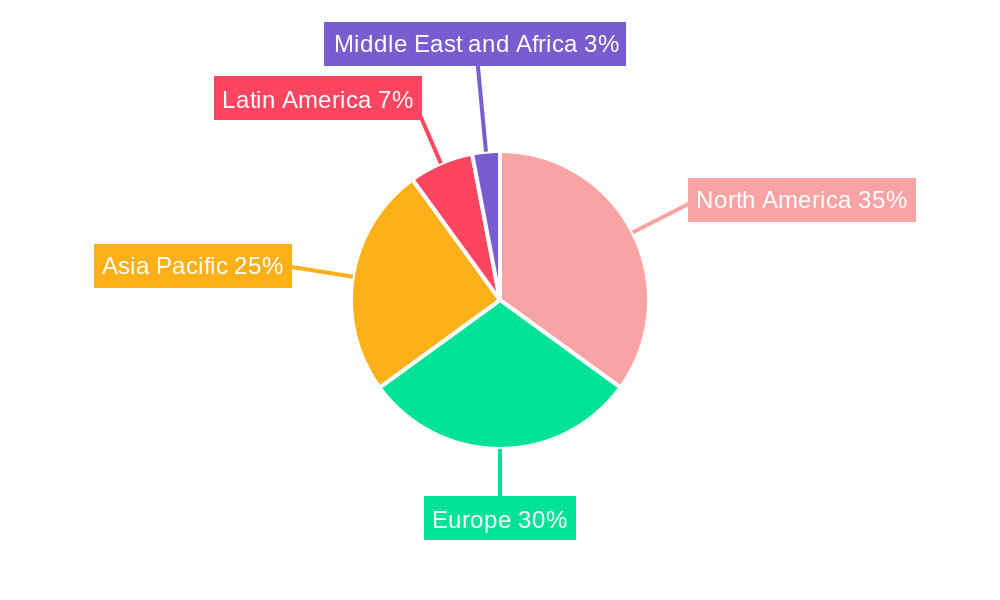
Automotive Data Logging Industry Regional Market Share
Geographic Coverage of Automotive Data Logging Industry
Automotive Data Logging Industry REPORT HIGHLIGHTS
| Aspects | Details |
|---|---|
| Study Period | 2020-2034 |
| Base Year | 2025 |
| Estimated Year | 2026 |
| Forecast Period | 2026-2034 |
| Historical Period | 2020-2025 |
| Growth Rate | CAGR of 7.40% from 2020-2034 |
| Segmentation |
|
Table of Contents
- 1. Introduction
- 1.1. Research Scope
- 1.2. Market Segmentation
- 1.3. Research Methodology
- 1.4. Definitions and Assumptions
- 2. Executive Summary
- 2.1. Introduction
- 3. Market Dynamics
- 3.1. Introduction
- 3.2. Market Drivers
- 3.2.1. ; High Demand for Measurement and Control Operations
- 3.3. Market Restrains
- 3.3.1. ; High Up-front Associated Costs
- 3.4. Market Trends
- 3.4.1. Oil and Gas is Expected to Hold a Major Market Share
- 4. Market Factor Analysis
- 4.1. Porters Five Forces
- 4.2. Supply/Value Chain
- 4.3. PESTEL analysis
- 4.4. Market Entropy
- 4.5. Patent/Trademark Analysis
- 5. Global Automotive Data Logging Industry Analysis, Insights and Forecast, 2020-2032
- 5.1. Market Analysis, Insights and Forecast - by Deployment
- 5.1.1. USB Data
- 5.1.2. Bluetooth Enabled Logger
- 5.1.3. Web-based Systems
- 5.1.4. Wireless
- 5.2. Market Analysis, Insights and Forecast - by Channel
- 5.2.1. Single Channel
- 5.2.2. Multi-Channel
- 5.3. Market Analysis, Insights and Forecast - by Input Parameter
- 5.3.1. Temperature
- 5.3.2. Pressure
- 5.3.3. Humidity
- 5.3.4. Voltage
- 5.3.5. Other Input Parameters
- 5.4. Market Analysis, Insights and Forecast - by End-user Industry
- 5.4.1. Oil & Gas
- 5.4.2. Manufacturing
- 5.4.3. Automotive
- 5.4.4. Power & Utilities
- 5.4.5. Other End-user Industries
- 5.5. Market Analysis, Insights and Forecast - by Region
- 5.5.1. North America
- 5.5.2. Europe
- 5.5.3. Asia Pacific
- 5.5.4. Latin America
- 5.5.5. Middle East and Africa
- 5.1. Market Analysis, Insights and Forecast - by Deployment
- 6. North America Automotive Data Logging Industry Analysis, Insights and Forecast, 2020-2032
- 6.1. Market Analysis, Insights and Forecast - by Deployment
- 6.1.1. USB Data
- 6.1.2. Bluetooth Enabled Logger
- 6.1.3. Web-based Systems
- 6.1.4. Wireless
- 6.2. Market Analysis, Insights and Forecast - by Channel
- 6.2.1. Single Channel
- 6.2.2. Multi-Channel
- 6.3. Market Analysis, Insights and Forecast - by Input Parameter
- 6.3.1. Temperature
- 6.3.2. Pressure
- 6.3.3. Humidity
- 6.3.4. Voltage
- 6.3.5. Other Input Parameters
- 6.4. Market Analysis, Insights and Forecast - by End-user Industry
- 6.4.1. Oil & Gas
- 6.4.2. Manufacturing
- 6.4.3. Automotive
- 6.4.4. Power & Utilities
- 6.4.5. Other End-user Industries
- 6.1. Market Analysis, Insights and Forecast - by Deployment
- 7. Europe Automotive Data Logging Industry Analysis, Insights and Forecast, 2020-2032
- 7.1. Market Analysis, Insights and Forecast - by Deployment
- 7.1.1. USB Data
- 7.1.2. Bluetooth Enabled Logger
- 7.1.3. Web-based Systems
- 7.1.4. Wireless
- 7.2. Market Analysis, Insights and Forecast - by Channel
- 7.2.1. Single Channel
- 7.2.2. Multi-Channel
- 7.3. Market Analysis, Insights and Forecast - by Input Parameter
- 7.3.1. Temperature
- 7.3.2. Pressure
- 7.3.3. Humidity
- 7.3.4. Voltage
- 7.3.5. Other Input Parameters
- 7.4. Market Analysis, Insights and Forecast - by End-user Industry
- 7.4.1. Oil & Gas
- 7.4.2. Manufacturing
- 7.4.3. Automotive
- 7.4.4. Power & Utilities
- 7.4.5. Other End-user Industries
- 7.1. Market Analysis, Insights and Forecast - by Deployment
- 8. Asia Pacific Automotive Data Logging Industry Analysis, Insights and Forecast, 2020-2032
- 8.1. Market Analysis, Insights and Forecast - by Deployment
- 8.1.1. USB Data
- 8.1.2. Bluetooth Enabled Logger
- 8.1.3. Web-based Systems
- 8.1.4. Wireless
- 8.2. Market Analysis, Insights and Forecast - by Channel
- 8.2.1. Single Channel
- 8.2.2. Multi-Channel
- 8.3. Market Analysis, Insights and Forecast - by Input Parameter
- 8.3.1. Temperature
- 8.3.2. Pressure
- 8.3.3. Humidity
- 8.3.4. Voltage
- 8.3.5. Other Input Parameters
- 8.4. Market Analysis, Insights and Forecast - by End-user Industry
- 8.4.1. Oil & Gas
- 8.4.2. Manufacturing
- 8.4.3. Automotive
- 8.4.4. Power & Utilities
- 8.4.5. Other End-user Industries
- 8.1. Market Analysis, Insights and Forecast - by Deployment
- 9. Latin America Automotive Data Logging Industry Analysis, Insights and Forecast, 2020-2032
- 9.1. Market Analysis, Insights and Forecast - by Deployment
- 9.1.1. USB Data
- 9.1.2. Bluetooth Enabled Logger
- 9.1.3. Web-based Systems
- 9.1.4. Wireless
- 9.2. Market Analysis, Insights and Forecast - by Channel
- 9.2.1. Single Channel
- 9.2.2. Multi-Channel
- 9.3. Market Analysis, Insights and Forecast - by Input Parameter
- 9.3.1. Temperature
- 9.3.2. Pressure
- 9.3.3. Humidity
- 9.3.4. Voltage
- 9.3.5. Other Input Parameters
- 9.4. Market Analysis, Insights and Forecast - by End-user Industry
- 9.4.1. Oil & Gas
- 9.4.2. Manufacturing
- 9.4.3. Automotive
- 9.4.4. Power & Utilities
- 9.4.5. Other End-user Industries
- 9.1. Market Analysis, Insights and Forecast - by Deployment
- 10. Middle East and Africa Automotive Data Logging Industry Analysis, Insights and Forecast, 2020-2032
- 10.1. Market Analysis, Insights and Forecast - by Deployment
- 10.1.1. USB Data
- 10.1.2. Bluetooth Enabled Logger
- 10.1.3. Web-based Systems
- 10.1.4. Wireless
- 10.2. Market Analysis, Insights and Forecast - by Channel
- 10.2.1. Single Channel
- 10.2.2. Multi-Channel
- 10.3. Market Analysis, Insights and Forecast - by Input Parameter
- 10.3.1. Temperature
- 10.3.2. Pressure
- 10.3.3. Humidity
- 10.3.4. Voltage
- 10.3.5. Other Input Parameters
- 10.4. Market Analysis, Insights and Forecast - by End-user Industry
- 10.4.1. Oil & Gas
- 10.4.2. Manufacturing
- 10.4.3. Automotive
- 10.4.4. Power & Utilities
- 10.4.5. Other End-user Industries
- 10.1. Market Analysis, Insights and Forecast - by Deployment
- 11. Competitive Analysis
- 11.1. Global Market Share Analysis 2025
- 11.2. Company Profiles
- 11.2.1 National Instruments
- 11.2.1.1. Overview
- 11.2.1.2. Products
- 11.2.1.3. SWOT Analysis
- 11.2.1.4. Recent Developments
- 11.2.1.5. Financials (Based on Availability)
- 11.2.2 G - Tek Corporation India
- 11.2.2.1. Overview
- 11.2.2.2. Products
- 11.2.2.3. SWOT Analysis
- 11.2.2.4. Recent Developments
- 11.2.2.5. Financials (Based on Availability)
- 11.2.3 Keysight Technologies
- 11.2.3.1. Overview
- 11.2.3.2. Products
- 11.2.3.3. SWOT Analysis
- 11.2.3.4. Recent Developments
- 11.2.3.5. Financials (Based on Availability)
- 11.2.4 Kimo Instruments
- 11.2.4.1. Overview
- 11.2.4.2. Products
- 11.2.4.3. SWOT Analysis
- 11.2.4.4. Recent Developments
- 11.2.4.5. Financials (Based on Availability)
- 11.2.5 Robert Bosch GmbH
- 11.2.5.1. Overview
- 11.2.5.2. Products
- 11.2.5.3. SWOT Analysis
- 11.2.5.4. Recent Developments
- 11.2.5.5. Financials (Based on Availability)
- 11.2.6 Thermo Fisher Scientific
- 11.2.6.1. Overview
- 11.2.6.2. Products
- 11.2.6.3. SWOT Analysis
- 11.2.6.4. Recent Developments
- 11.2.6.5. Financials (Based on Availability)
- 11.2.7 Yokogawa Electric Company
- 11.2.7.1. Overview
- 11.2.7.2. Products
- 11.2.7.3. SWOT Analysis
- 11.2.7.4. Recent Developments
- 11.2.7.5. Financials (Based on Availability)
- 11.2.8 HIOKI E E Corporation*List Not Exhaustive
- 11.2.8.1. Overview
- 11.2.8.2. Products
- 11.2.8.3. SWOT Analysis
- 11.2.8.4. Recent Developments
- 11.2.8.5. Financials (Based on Availability)
- 11.2.9 ABB
- 11.2.9.1. Overview
- 11.2.9.2. Products
- 11.2.9.3. SWOT Analysis
- 11.2.9.4. Recent Developments
- 11.2.9.5. Financials (Based on Availability)
- 11.2.1 National Instruments
List of Figures
- Figure 1: Global Automotive Data Logging Industry Revenue Breakdown (Million, %) by Region 2025 & 2033
- Figure 2: North America Automotive Data Logging Industry Revenue (Million), by Deployment 2025 & 2033
- Figure 3: North America Automotive Data Logging Industry Revenue Share (%), by Deployment 2025 & 2033
- Figure 4: North America Automotive Data Logging Industry Revenue (Million), by Channel 2025 & 2033
- Figure 5: North America Automotive Data Logging Industry Revenue Share (%), by Channel 2025 & 2033
- Figure 6: North America Automotive Data Logging Industry Revenue (Million), by Input Parameter 2025 & 2033
- Figure 7: North America Automotive Data Logging Industry Revenue Share (%), by Input Parameter 2025 & 2033
- Figure 8: North America Automotive Data Logging Industry Revenue (Million), by End-user Industry 2025 & 2033
- Figure 9: North America Automotive Data Logging Industry Revenue Share (%), by End-user Industry 2025 & 2033
- Figure 10: North America Automotive Data Logging Industry Revenue (Million), by Country 2025 & 2033
- Figure 11: North America Automotive Data Logging Industry Revenue Share (%), by Country 2025 & 2033
- Figure 12: Europe Automotive Data Logging Industry Revenue (Million), by Deployment 2025 & 2033
- Figure 13: Europe Automotive Data Logging Industry Revenue Share (%), by Deployment 2025 & 2033
- Figure 14: Europe Automotive Data Logging Industry Revenue (Million), by Channel 2025 & 2033
- Figure 15: Europe Automotive Data Logging Industry Revenue Share (%), by Channel 2025 & 2033
- Figure 16: Europe Automotive Data Logging Industry Revenue (Million), by Input Parameter 2025 & 2033
- Figure 17: Europe Automotive Data Logging Industry Revenue Share (%), by Input Parameter 2025 & 2033
- Figure 18: Europe Automotive Data Logging Industry Revenue (Million), by End-user Industry 2025 & 2033
- Figure 19: Europe Automotive Data Logging Industry Revenue Share (%), by End-user Industry 2025 & 2033
- Figure 20: Europe Automotive Data Logging Industry Revenue (Million), by Country 2025 & 2033
- Figure 21: Europe Automotive Data Logging Industry Revenue Share (%), by Country 2025 & 2033
- Figure 22: Asia Pacific Automotive Data Logging Industry Revenue (Million), by Deployment 2025 & 2033
- Figure 23: Asia Pacific Automotive Data Logging Industry Revenue Share (%), by Deployment 2025 & 2033
- Figure 24: Asia Pacific Automotive Data Logging Industry Revenue (Million), by Channel 2025 & 2033
- Figure 25: Asia Pacific Automotive Data Logging Industry Revenue Share (%), by Channel 2025 & 2033
- Figure 26: Asia Pacific Automotive Data Logging Industry Revenue (Million), by Input Parameter 2025 & 2033
- Figure 27: Asia Pacific Automotive Data Logging Industry Revenue Share (%), by Input Parameter 2025 & 2033
- Figure 28: Asia Pacific Automotive Data Logging Industry Revenue (Million), by End-user Industry 2025 & 2033
- Figure 29: Asia Pacific Automotive Data Logging Industry Revenue Share (%), by End-user Industry 2025 & 2033
- Figure 30: Asia Pacific Automotive Data Logging Industry Revenue (Million), by Country 2025 & 2033
- Figure 31: Asia Pacific Automotive Data Logging Industry Revenue Share (%), by Country 2025 & 2033
- Figure 32: Latin America Automotive Data Logging Industry Revenue (Million), by Deployment 2025 & 2033
- Figure 33: Latin America Automotive Data Logging Industry Revenue Share (%), by Deployment 2025 & 2033
- Figure 34: Latin America Automotive Data Logging Industry Revenue (Million), by Channel 2025 & 2033
- Figure 35: Latin America Automotive Data Logging Industry Revenue Share (%), by Channel 2025 & 2033
- Figure 36: Latin America Automotive Data Logging Industry Revenue (Million), by Input Parameter 2025 & 2033
- Figure 37: Latin America Automotive Data Logging Industry Revenue Share (%), by Input Parameter 2025 & 2033
- Figure 38: Latin America Automotive Data Logging Industry Revenue (Million), by End-user Industry 2025 & 2033
- Figure 39: Latin America Automotive Data Logging Industry Revenue Share (%), by End-user Industry 2025 & 2033
- Figure 40: Latin America Automotive Data Logging Industry Revenue (Million), by Country 2025 & 2033
- Figure 41: Latin America Automotive Data Logging Industry Revenue Share (%), by Country 2025 & 2033
- Figure 42: Middle East and Africa Automotive Data Logging Industry Revenue (Million), by Deployment 2025 & 2033
- Figure 43: Middle East and Africa Automotive Data Logging Industry Revenue Share (%), by Deployment 2025 & 2033
- Figure 44: Middle East and Africa Automotive Data Logging Industry Revenue (Million), by Channel 2025 & 2033
- Figure 45: Middle East and Africa Automotive Data Logging Industry Revenue Share (%), by Channel 2025 & 2033
- Figure 46: Middle East and Africa Automotive Data Logging Industry Revenue (Million), by Input Parameter 2025 & 2033
- Figure 47: Middle East and Africa Automotive Data Logging Industry Revenue Share (%), by Input Parameter 2025 & 2033
- Figure 48: Middle East and Africa Automotive Data Logging Industry Revenue (Million), by End-user Industry 2025 & 2033
- Figure 49: Middle East and Africa Automotive Data Logging Industry Revenue Share (%), by End-user Industry 2025 & 2033
- Figure 50: Middle East and Africa Automotive Data Logging Industry Revenue (Million), by Country 2025 & 2033
- Figure 51: Middle East and Africa Automotive Data Logging Industry Revenue Share (%), by Country 2025 & 2033
List of Tables
- Table 1: Global Automotive Data Logging Industry Revenue Million Forecast, by Deployment 2020 & 2033
- Table 2: Global Automotive Data Logging Industry Revenue Million Forecast, by Channel 2020 & 2033
- Table 3: Global Automotive Data Logging Industry Revenue Million Forecast, by Input Parameter 2020 & 2033
- Table 4: Global Automotive Data Logging Industry Revenue Million Forecast, by End-user Industry 2020 & 2033
- Table 5: Global Automotive Data Logging Industry Revenue Million Forecast, by Region 2020 & 2033
- Table 6: Global Automotive Data Logging Industry Revenue Million Forecast, by Deployment 2020 & 2033
- Table 7: Global Automotive Data Logging Industry Revenue Million Forecast, by Channel 2020 & 2033
- Table 8: Global Automotive Data Logging Industry Revenue Million Forecast, by Input Parameter 2020 & 2033
- Table 9: Global Automotive Data Logging Industry Revenue Million Forecast, by End-user Industry 2020 & 2033
- Table 10: Global Automotive Data Logging Industry Revenue Million Forecast, by Country 2020 & 2033
- Table 11: Global Automotive Data Logging Industry Revenue Million Forecast, by Deployment 2020 & 2033
- Table 12: Global Automotive Data Logging Industry Revenue Million Forecast, by Channel 2020 & 2033
- Table 13: Global Automotive Data Logging Industry Revenue Million Forecast, by Input Parameter 2020 & 2033
- Table 14: Global Automotive Data Logging Industry Revenue Million Forecast, by End-user Industry 2020 & 2033
- Table 15: Global Automotive Data Logging Industry Revenue Million Forecast, by Country 2020 & 2033
- Table 16: Global Automotive Data Logging Industry Revenue Million Forecast, by Deployment 2020 & 2033
- Table 17: Global Automotive Data Logging Industry Revenue Million Forecast, by Channel 2020 & 2033
- Table 18: Global Automotive Data Logging Industry Revenue Million Forecast, by Input Parameter 2020 & 2033
- Table 19: Global Automotive Data Logging Industry Revenue Million Forecast, by End-user Industry 2020 & 2033
- Table 20: Global Automotive Data Logging Industry Revenue Million Forecast, by Country 2020 & 2033
- Table 21: Global Automotive Data Logging Industry Revenue Million Forecast, by Deployment 2020 & 2033
- Table 22: Global Automotive Data Logging Industry Revenue Million Forecast, by Channel 2020 & 2033
- Table 23: Global Automotive Data Logging Industry Revenue Million Forecast, by Input Parameter 2020 & 2033
- Table 24: Global Automotive Data Logging Industry Revenue Million Forecast, by End-user Industry 2020 & 2033
- Table 25: Global Automotive Data Logging Industry Revenue Million Forecast, by Country 2020 & 2033
- Table 26: Global Automotive Data Logging Industry Revenue Million Forecast, by Deployment 2020 & 2033
- Table 27: Global Automotive Data Logging Industry Revenue Million Forecast, by Channel 2020 & 2033
- Table 28: Global Automotive Data Logging Industry Revenue Million Forecast, by Input Parameter 2020 & 2033
- Table 29: Global Automotive Data Logging Industry Revenue Million Forecast, by End-user Industry 2020 & 2033
- Table 30: Global Automotive Data Logging Industry Revenue Million Forecast, by Country 2020 & 2033
Frequently Asked Questions
1. What is the projected Compound Annual Growth Rate (CAGR) of the Automotive Data Logging Industry?
The projected CAGR is approximately 7.40%.
2. Which companies are prominent players in the Automotive Data Logging Industry?
Key companies in the market include National Instruments, G - Tek Corporation India, Keysight Technologies, Kimo Instruments, Robert Bosch GmbH, Thermo Fisher Scientific, Yokogawa Electric Company, HIOKI E E Corporation*List Not Exhaustive, ABB.
3. What are the main segments of the Automotive Data Logging Industry?
The market segments include Deployment, Channel, Input Parameter, End-user Industry.
4. Can you provide details about the market size?
The market size is estimated to be USD XX Million as of 2022.
5. What are some drivers contributing to market growth?
; High Demand for Measurement and Control Operations.
6. What are the notable trends driving market growth?
Oil and Gas is Expected to Hold a Major Market Share.
7. Are there any restraints impacting market growth?
; High Up-front Associated Costs.
8. Can you provide examples of recent developments in the market?
N/A
9. What pricing options are available for accessing the report?
Pricing options include single-user, multi-user, and enterprise licenses priced at USD 4750, USD 5250, and USD 8750 respectively.
10. Is the market size provided in terms of value or volume?
The market size is provided in terms of value, measured in Million.
11. Are there any specific market keywords associated with the report?
Yes, the market keyword associated with the report is "Automotive Data Logging Industry," which aids in identifying and referencing the specific market segment covered.
12. How do I determine which pricing option suits my needs best?
The pricing options vary based on user requirements and access needs. Individual users may opt for single-user licenses, while businesses requiring broader access may choose multi-user or enterprise licenses for cost-effective access to the report.
13. Are there any additional resources or data provided in the Automotive Data Logging Industry report?
While the report offers comprehensive insights, it's advisable to review the specific contents or supplementary materials provided to ascertain if additional resources or data are available.
14. How can I stay updated on further developments or reports in the Automotive Data Logging Industry?
To stay informed about further developments, trends, and reports in the Automotive Data Logging Industry, consider subscribing to industry newsletters, following relevant companies and organizations, or regularly checking reputable industry news sources and publications.
Methodology
Step 1 - Identification of Relevant Samples Size from Population Database


Step 2 - Approaches for Defining Global Market Size (Value, Volume* & Price*)

Note*: In applicable scenarios
Step 3 - Data Sources
Primary Research
- Web Analytics
- Survey Reports
- Research Institute
- Latest Research Reports
- Opinion Leaders
Secondary Research
- Annual Reports
- White Paper
- Latest Press Release
- Industry Association
- Paid Database
- Investor Presentations

Step 4 - Data Triangulation
Involves using different sources of information in order to increase the validity of a study
These sources are likely to be stakeholders in a program - participants, other researchers, program staff, other community members, and so on.
Then we put all data in single framework & apply various statistical tools to find out the dynamic on the market.
During the analysis stage, feedback from the stakeholder groups would be compared to determine areas of agreement as well as areas of divergence